The consolidated balance sheet of urban co-operative banks expanded moderately in 2018-19 on the back of robust deposit growth which financed the pick-up in lending. Although their asset quality and provisions improved, a fall in interest income adversely affected profitability. Among short-term rural co-operatives, the financial health of state co-operative banks and district central co-operative banks weakened on account of an increase in the non-performing assets and slowdown in profitability. The soundness indicators of long-term co-operatives remained fragile. 1. Introduction V.1 In keeping with their ‘grassroots’ integration into the life and ethos of the widest sections of society, co-operative banks in India are invested with developmental goals among which financial inclusion has assumed crucial importance. These institutions play a critical role in last-mile credit delivery and in extending financial services across the length and breadth of the country through their geographic and demographic outreach. V.2 At the end of March 2019, credit co-operatives comprised 1,544 urban co-operative banks (UCBs) and 96,248 rural co-operative banks (end-March 20181), with the latter accounting for 64.7 per cent of the total assets of co-operatives (Chart V.1). V.3 UCBs and among the rural co-operatives, the State Co-operative Banks (StCBs) and the District Central Co-operative Banks (DCCBs) are registered either under the Co-operative Societies Act of the state concerned or under the Multi State Co-operative Societies Act, 2002. Banking laws were made applicable to co-operative societies since March 1, 1966. Currently, there is duality of control over StCBs/DCCBs/UCBs between the Registrar of Cooperative Societies (RCS) or the Central Registrar of Cooperative Societies (CRCS) and the Reserve Bank. While the mandates of the RCS/CRCS encompass incorporation, registration, management, recovery, audit, supersession of Board of Directors and liquidation, the Reserve Bank is invested with regulatory functions. The Reserve Bank is also entrusted with the responsibility of supervision of UCBs, entailing prescription of prudential norms for capital adequacy, income recognition, asset classification and provisioning, liquidity requirements and single/group exposure norms. In addition, it also helps in capacity building of employees and assist in implementation of IT infrastructure in UCBs. V.4 Primary Agricultural Credit Societies (PACS) and long-term co-operatives are outside the purview of the Banking Regulation Act, 1949. The NABARD has been given power under Section 35 (6) of the Banking Regulation Act to conduct inspections of StCBs and DCCBs. The NABARD also conducts voluntary inspections of State Co-operative Agriculture and Rural Development Banks (SCARDBs). V.5 The growth of these co-operative institutions has not been commensurate with that of other constituents of the banking sector in India. At the end of March 2018, the combined assets of urban and rural co-operatives were 10.6 per cent of the total assets of scheduled commercial banks (SCBs), down from 19.4 per cent in 2004-05. Several operational and governance-based impediments have operated as drags on their performance, stunting their growth. V.6 In this milieu, this chapter examines the performance of the urban co-operatives and rural credit co-operatives in the remaining five sections. Section 2 addresses the activities of UCBs from the point of view of their financial performance and asset quality. Section 3 reviews the performance of State Co-operative Banks (StCBs), District Central Co-operative Banks (DCCBs) and PACS. A brief description of long-term co-operatives is provided in section 4, notwithstanding the fact that they are outside the purview of the Reserve Bank’s regulation. Section 5 concludes with some overall perspectives. Detailed tables on balance sheets, financial performance indicators, asset quality and other salient indicators are presented in the appendix. 2. Urban Co-operative Banks V.7 Despite their large number, UCBs account for 3.6 per cent of the total assets of SCBs. Most of them are single branch entities, with limited avenues to raise capital. Successful international co-operative models highlights the role of umbrella organisation in strengthening the performance of co-operatives by providing a range of services like liquidity and capital support (Box V.1). V.8 Enabled by a liberal licensing policy, the period 1991-2004 saw phenomenal growth in UCBs’ number and asset size. Subsequently, this expansion turned unsustainable and some of them became weak and unviable over time. The Reserve Bank’s Vision Document 2005, adopted a multi-layered approach for bolstering the UCBs, including merger of weak UCBs with stronger ones and exit of unviable ones that has resulted in the state of consolidation that exists today (Chart V.2). Box V.1: Co-operative Banks: A Cross-Country Comparison The financial co-operative (FC) institutions, which trace back their origins to the 19th century, were established across jurisdictions with the objective of extending loans at affordable prices to the unbanked population. Amongst the FCs, the services of credit unions are exclusive for their members, who share a common profession, entrepreneurship interests, or in some cases, just their location. In contrast, co-operative banks offer services to non-members as well (Birchall, 2013). While there are co-operatives based on a simple business model of deposit-taking and lending, others, such as those in Europe, form federations by pooling their resources resembling large banking groups and provide a large array of services (for example, Rabobank Group in Netherlands, Credit Agricole Group in France and Op-Pohjola Group in Finland). Regulation and Supervision The supervisory framework of FCs has evolved over time and differs across boundaries. In France, their regulation and supervision are at par with commercial banks which includes, inter alia, removal of board members and power to appoint temporary administrators. In the US, central co-operative banks are regulated by the National Credit Union Administration (NCUA) and it has the power to merge FCs if there are risks of insolvency. Indian co-operatives, on the other hand, are faced with a problem of dual regulation where their banking-related functions are regulated by the Reserve Bank and management-related functions are controlled by the concerned state/central Government. Further, unlike France, the control over co-operative banks is not at par with commercial banks. This system impedes effective regulatory control of the Reserve Bank over co-operative banks. Market Share and Role in Credit Delivery The market share of FCs in terms of asset size varies significantly ranging from 0.03 per cent in Brazil to 47 per cent in France. In India, credit co-operatives (including urban and rural co-operatives) accounted for about one-tenth of the total assets of scheduled commercial banks in 2017-18. Further, loans and advances by three major cooperative banking groups in France accounted for 51 per cent of the total loans of the financial system2 (Chart 1). In AEs, such as the United States (US), France and the Netherlands, FCs compete with commercial banks in retail banking and lending to small and medium enterprises (SMEs)3. The market share of loans to SMEs of Rabobank in the Netherlands is 39.6 per cent and of the Credit Agricole Group in France is 34 per cent4. In comparison, the lending of Indian urban co-operative banks (UCBs) to micro, small and medium enterprises (MSMEs) is 14.5 per cent of the total commercial bank lending in 2018-19. FCs showed considerable resilience during the global financial crisis of 2007-08 as they outperformed commercial banks and continued lending to SMEs (Birchall, 2013). Umbrella Organisations Co-operative banks have limited ability to raise capital given their business model, wherein they can raise resources only from member shares and retained earnings. Also, FCs find themselves unable to adopt latest banking technology due to their limited size. To some extent, these limitations faced by the FCs are overcome by the presence of umbrella organisations, which can exist either in the form of an apex level entity or as a distinct entity where the credit unions are its members.  In some countries, the apex central body (umbrella organisation) provides services to its member banks and regulates their activities. All local co-operative banks are members of this apex entity and are provided with voting rights based on ‘one member one vote’ system. These apex entities provide access to resources/capital to financial co-operatives at the base level through their ability of tapping into the capital market, while maintaining the cooperative character. Member co-operatives within an apex bank also agree to provide mutual support to each other in times of financial difficulty. This system also enables self-regulation and good corporate governance in the sector. The Credit Agricole Group in France has an internal audit mechanism that covers all member co-operative banks and also has power to issue instructions and merge two or more entities affiliated to them. Similarly, the Rabobank Group in the Netherlands is responsible for supervising the financial health and professionalism of local co-operative banks. International experience suggests that existence of an umbrella model (for instance, European model of co-operatives) provides mutual support system, viz., legally binding cross guarantees, liquidity support, among others and therefore adds to the strength of the system. Based on this important role, various committees5 of the Reserve Bank have recommended setting up of such a structure. Accordingly, regulatory approval to the National Federation of Urban Cooperative Banks and Credit Societies Ltd. (NAFCUB) has been accorded by the Reserve Bank for setting up an umbrella organisation as a non-deposit taking NBFC (NBFC-ND) on June 06, 2019. References Birchall, J. (2013). Resilience in a downturn: The power of financial cooperatives. Geneva: International Labour Office. Coelho, R., J.A. Mazzillo, J.P. Sovornos & T. Yu (2019). Regulation and supervision of financial cooperatives, Bank for International Settlements (BIS). European Association of Co-operative Banks (EACB). Key statistics – Financial indicators 2018. Reserve Bank of India (2009). Report of the Working Group on Umbrella Organization and Constitution of Revival Fund for Primary (Urban) Co-operative Banks. | V.9 Maharashtra—which has the largest number of UCBs across states—accounted for the highest number of mergers (Chart V.3) V.10 Notwithstanding the fall in the number of UCBs, however, their combined asset size has continuously increased (Chart V.4). V.11 UCBs are classified for regulatory purposes into Tier-I and Tier-II categories, based on their depositor base6. Tier II UCBs have larger depositor bases and wider geographical presence than their Tier I counterparts. During 2018-19, the number of Tier II UCBs increased sharply (Table V.1).
2.1 Balance SheetV.12 The combined balance sheet of UCBs witnessed robust expansion underscoring the effectiveness of measures taken to strengthen their financials. However, in the recent years, UCBs’ assets growth has moderated (Chart V.5). V.13 In 2014-15, the distribution of UCBs became bi-modal, with concentration in two asset brackets viz., ₹ 25 crore to ₹ 50 crore and ₹ 100 crore to ₹ 250 crore. Since 2016-17, however, the distribution has become uni-modal, with the largest frequency concentrated at the ₹ 100 crore to ₹ 250 crore asset bracket. Moreover, there has been a rightward shift in the distribution, with the share of UCBs with assets greater than ₹ 1,000 crore increasing to 6.5 per cent in 2018-19 from 4.6 per cent in 2014-15 (Chart V.6). V.14 Deposits—which accounted for 89.5 per cent of the resource base7 of UCBs—revived during 2018-19 after a deceleration in the previous year (Chart V.7). Nonetheless, UCBs’ deposit growth remains well-below the average of 13.9 per cent achieved during 2007-08 to 2016-17. | Table V.1: Tier-wise Distribution of Urban Co-operative Banks | | (At end-March 2019) | | (Amount in ₹ crore) | | Tier Type | Number of Banks | Deposits | Advances | Total Assets | | Number | % to Total | Amount | % to Total | Amount | % to Total | Amount | % to Total | | Tier I UCBs | 917 | 59.4 | 43,588 | 9.0 | 25,076 | 8.3 | 54,591 | 9.1 | | Tier II UCBs | 627 | 40.6 | 4,40,728 | 91.0 | 2,77,942 | 91.7 | 5,44,622 | 90.9 | | All UCBs | 1,544 | 100.0 | 4,84,316 | 100.0 | 3,03,018 | 100.0 | 5,99,214 | 100.0 | Note: Data are provisional.
Source: Off-site surveillance returns, RBI. |
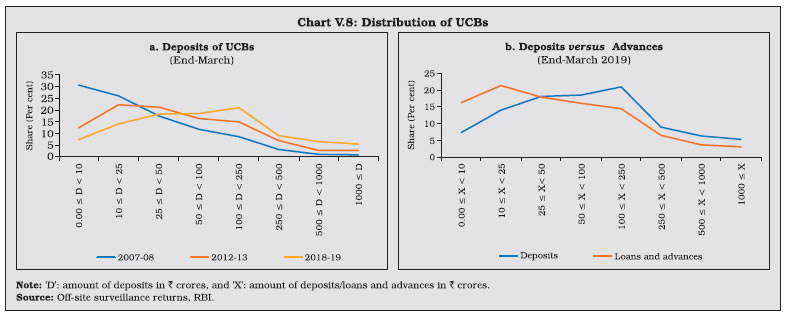
V.15 As deposit growth moderated during 2017-18, lending had to be financed by a steep increase in borrowings. This growth in borrowings reversed during 2018-19 as pick-up in deposit growth financed the increase in loans and advances (Table V.2). V.16 While UCBs with deposit bases upto ₹ 10 crore formed the modal class at the end of March 2008, the ₹ 100 crore to ₹ 250 crore bracket became the modal class at the end of March 2019 (Table V.3 and Chart V.8a). This suggests an increase in average deposit per account as well as an expansion of the customer base of UCBs. V.17 In contrast, UCBs with advances in the range of ₹ 10 crore to ₹ 25 crore formed the modal class during 2018-19 (Chart V.8b). V.18 Since 2015, the SLR requirements of UCBs are being reduced progressively in line with the prescription applicable to SCBs. Furthermore, since UCBs are governed by Basel I regulatory norms, the liquidity coverage ratio (LCR) requirement is not applicable to them. As SLR investments – constituting 88.9 per cent of total investments, primarily in central government securities – moderated over the last two years, overall investments also followed suit (Table V.4). However, non-SLR investments expanded by a faster pace. Incidentally, in August 2018, the list of eligible counterparties for trading in secondary market for this type of investment was widened. | Table V.2: Liabilities and Assets of Urban Co-operative Banks | | (At end-March) | | (Amount in ₹ crore) | | Assets/Liabilities | Scheduled UCBs | Non-scheduled UCBs | All UCBs | Rate of Growth (%) All UCBs | | 2018 | 2019 | 2018 | 2019 | 2018 | 2019 | 2017-18 | 2018-19 | | 1 | 2 | 3 | 4 | 5 | 6 | 7 | 8 | 9 | | Liabilities | | | | | | | | | | 1. Capital | 4,118 | 4,348 | 8,852 | 9,235 | 12,970 | 13,583 | 7.1 | 4.7 | | | (1.6) | (1.5) | (3.0) | (2.9) | (2.3) | (2.3) | | | | 2. Reserves | 16,663 | 18,447 | 18,626 | 19,342 | 35,288 | 37,789 | 5.5 | 7.1 | | | (6.3) | (6.5) | (6.2) | (6.2) | (6.3) | (6.3) | | | | 3. Deposits | 2,12,041 | 2,25,688 | 2,44,466 | 2,58,628 | 4,56,507 | 4,84,316 | 2.9 | 6.1 | | | (80.1) | (79.2) | (81.9) | (82.3) | (81.0) | (80.8) | | | | 4. Borrowings | 4,628 | 4,908 | 367 | 333 | 4,995 | 5,241 | 41.6 | 4.9 | | | (1.7) | (1.7) | (0.1) | (0.1) | (0.9) | (0.9) | | | | 5. Other Liabilities | 27,308 | 31,538 | 26,183 | 26,747 | 53,491 | 58,285 | 12.8 | 9.0 | | | (10.3) | (11.1) | (8.8) | (8.5) | (9.5) | (9.7) | | | | Assets | | | | | | | | | | 1. Cash in Hand | 1,482 | 1,342 | 3,982 | 4,046 | 5,464 | 5,388 | 21.7 | -1.4 | | | (0.6) | (0.5) | (1.3) | (1.3) | (1.0) | (0.9) | | | | 2. Balances with RBI | 10,360 | 11,080 | 2,144 | 2,699 | 12,503 | 13,779 | 8.9 | 10.2 | | | (3.9) | (3.9) | (0.7) | (0.9) | (2.2) | (2.3) | | | | 3. Balances with Banks | 16,155 | 17,065 | 46,813 | 43,780 | 62,968 | 60,845 | 3.6 | -3.4 | | | (6.1) | (6.0) | (15.7) | (13.9) | (11.2) | (10.2) | | | | 4. Money at Call and Short Notice | 3,081 | 4,291 | 1,381 | 1,580 | 4,462 | 5,871 | -11.0 | 31.6 | | | (1.2) | (1.5) | (0.5) | (0.5) | (0.8) | (1.0) | | | | 5. Investments | 68,928 | 72,305 | 80,906 | 84,638 | 1,49,834 | 1,56,943 | 5.4 | 4.7 | | | (26.0) | (25.4) | (27.1) | (26.9) | (26.6) | (26.2) | | | | 6. Loans and Advances | 1,36,822 | 1,46,572 | 1,43,637 | 1,56,446 | 2,80,460 | 3,03,018 | 7.4 | 8.0 | | | (51.7) | (51.4) | (48.1) | (49.8) | (49.8) | (50.6) | | | | 7. Other Assets | 27,930 | 32,274 | 19,631 | 21,096 | 47,561 | 53,370 | -13.3 | 12.2 | | | (10.5) | (11.3) | (6.6) | (6.7) | (8.4) | (8.9) | | | | Total Liabilities/ Assets | 2,64,758 | 2,84,929 | 2,98,494 | 3,14,285 | 5,63,252 | 5,99,214 | 4.3 | 6.4 | | | (100.0) | (100.0) | (100.0) | (100.0) | (100.0) | (100.0) | | | Notes: 1. Data for March 2019 are provisional.
2. Figures in brackets are proportion to total liabilities / assets (in per cent).
3. Components may not add up to the total due to rounding off.
Source: Off-site surveillance returns, RBI. |
| Table V.3: Distribution of UCBs by Size of Deposits and Advances | | (At end-March 2019) | | (Amount in ₹ crore) | | Deposit | Number of UCBs | Amount of Deposits | Advances | Number of UCBs | Amount of Advances | | Number | % Share | Amount | % Share | Number | % Share | Amount | % Share | | 1 | 2 | 3 | 4 | 5 | 6 | 7 | 8 | 9 | 10 | | 0.00 ≤ D < 10 | 115 | 7.4 | 651 | 0.1 | 0.00 ≤ Ad < 10 | 253 | 16.4 | 1,349 | 0.4 | | 10 ≤ D < 25 | 216 | 14.0 | 3,661 | 0.8 | 10 ≤ Ad < 25 | 331 | 21.4 | 5,601 | 1.8 | | 25 ≤ D < 50 | 281 | 18.2 | 10,101 | 2.1 | 25 ≤ Ad < 50 | 278 | 18.0 | 9,911 | 3.3 | | 50 ≤ D < 100 | 285 | 18.5 | 19,997 | 4.1 | 50 ≤ Ad < 100 | 248 | 16.1 | 17,992 | 5.9 | | 100 ≤ D < 250 | 323 | 20.9 | 50,755 | 10.5 | 100 ≤ Ad < 250 | 225 | 14.6 | 35,270 | 11.6 | | 250 ≤ D < 500 | 140 | 9.1 | 47,216 | 9.7 | 250 ≤ Ad < 500 | 101 | 6.5 | 35,141 | 11.6 | | 500 ≤ D < 1000 | 100 | 6.5 | 67,362 | 13.9 | 500 ≤ Ad < 1000 | 59 | 3.8 | 39,853 | 13.2 | | 1000 ≤ D | 84 | 5.4 | 2,84,574 | 58.8 | 1000 ≤ Ad | 49 | 3.2 | 1,57,902 | 52.1 | | Total | 1,544 | 100.0 | 4,84,316 | 100.0 | Total | 1,544 | 100.0 | 3,03,018 | 100.0 | Note: 1. Data are provisional.
2. ‘D’ and ‘Ad’ indicates amount of deposits and advances respectively.
3. Components may not add up to the whole due to rounding off.
Source: Off-site surveillance returns, RBI. |
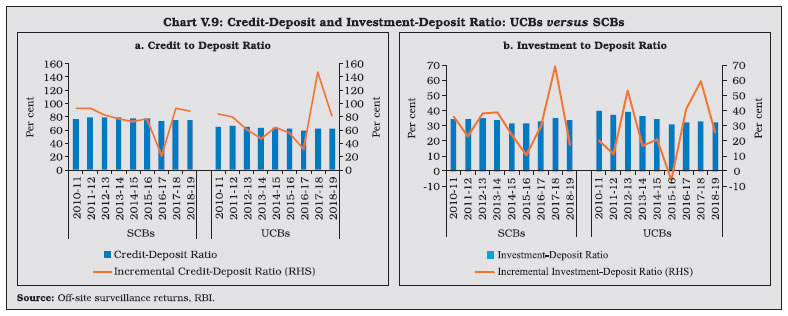
V.19 During 2016-17 and 2017-18, the incremental credit-to-deposit ratio of UCBs rose above those of SCBs, owing to the impact of high deposit growth on account of demonetisation in 2016-17 and lower credit growth of SCBs in the next year. This upturn was, however, reversed in 2018-19 with a pick-up in credit growth of SCBs (Chart V.9a). V.20 Since April 1, 2015 the balances of UCBs with DCCBs and StCBs ceased to be treated as SLR investments. Consequently, the investment-to-deposit ratio of UCBs fell below that of SCBs for the first time and remained so in subsequent years as well (Chart V.9b). | Table V.4: Investments by Urban Co-operative Banks | | (Amount in ₹ crore) | | Item | At end-March | Variation (%) | | 2017 | 2018 | 2019 | 2017-18 | 2018-19 | | 1 | 2 | 3 | 4 | 5 | 6 | | Total Investments (A + B) | 1,42,091 | 1,49,834 | 1,56,943 | 5.45 | 4.74 | | | (100.0) | (100.0) | (100.0) | | | | A. SLR Investments (i to iii) | 1,25,378 | 1,35,863 | 1,39,450 | 8.36 | 2.64 | | | (88.2) | (90.7) | (88.9) | | | | (i) Central Govt. Securities | 95,471 | 98,433 | 98,215 | 3.10 | -0.22 | | | (67.2) | (65.7) | (62.6) | | | | (ii) State Govt. Securities | 29,356 | 37,227 | 40,566 | 26.81 | 8.97 | | | (20.7) | (24.9) | (25.9) | | | | (iii) Other approved Securities | 551 | 204 | 669 | -63.04 | 228.45 | | | (0.4) | (0.1) | (0.4) | | | | B. Non-SLR Investments | 16,713 | 13,971 | 17,493 | -16.41 | 25.22 | | | (11.8) | (9.3) | (11.2) | | | Notes: 1. Data for 2019 are provisional.
2. Figures in parentheses are percentages to total investments.
Source: Off-site surveillance returns, RBI. |
2.2 SoundnessV.21 A CAMELS (capital adequacy; asset quality; management; earnings; liquidity; and systems and control) rating model is used to classify UCBs for regulatory and supervisory purposes8. UCBs in the top-ranking categories— with ratings A and B—accounted for 78 per cent of the sector (Table V.5). The share of UCBs in category A has, however declined in the last five years with a concomitant increase in category B banks. The share of UCBs in category D has remained in the range of 4 to 5 per cent in the last five years (Chart V.10). | Table V.5: Rating-wise Distribution of UCBs | | (At end-March 2019) | | (Amount in ₹ crore) | | Ratings | Number | Deposits | Advances | | Banks | % share in Total | Amount | % share in Total | Amount | % share in Total | | 1 | 2 | 3 | 4 | 5 | 6 | 7 | | A | 286 | 18.52 | 1,39,696 | 28.84 | 88,640 | 29.25 | | B | 913 | 59.13 | 2,71,573 | 56.07 | 1,71,129 | 56.47 | | C | 275 | 17.81 | 63,488 | 13.11 | 38,620 | 12.75 | | D | 70 | 4.53 | 9,559 | 1.97 | 4,628 | 1.53 | | Total | 1,544 | 100.00 | 4,84,316 | 100.00 | 3,03,018 | 100.00 | Notes: 1. Data are provisional.
2. Components may not add up to the total due to rounding off.
3. Ratings are based on the inspection conducted during the financial years 2017-18 and 2018-19.
Source: Off-site surveillance returns, RBI. | 2.3 Capital Adequacy V.22 Under the Basel I norms, UCBs are required to maintain a minimum statutory capital to risk weighted assets ratio (CRAR) of 9 per cent, with no additional requirements like capital conservation buffer and high common equity tier 1 (CET 1) capital ratio. As of end-March 2019, more than 96 per cent of UCBs maintained CRAR of 9 per cent and above (Table V.6).
| Table V.6: CRAR-wise Distribution of UCBs | | (At end-March 2019) | | CRAR (in Per cent) | Scheduled UCBs | Non-scheduled UCBs | All UCBs | | 1 | 2 | 3 | 4 | | CRAR < 3 | 4 | 34 | 38 | | 3 <= CRAR < 6 | 0 | 7 | 7 | | 6 <= CRAR < 9 | 0 | 14 | 14 | | 9 <= CRAR < 12 | 6 | 150 | 156 | | 12 <= CRAR | 44 | 1,285 | 1,329 | | Total | 54 | 1,490 | 1,544 | Note: Data are provisional.
Source: Off-site surveillance returns, RBI. | V.23 At a disaggregated level, non-scheduled UCBs (NSUCBs) that are characterised by lower asset size have better capital positions than scheduled UCBs (SUCBs). During 2018-19, the share of NSUCBs maintaining CRAR of 9 per cent and above was 96 per cent vis-a-vis 92 per cent for SUCBs. On the downside, however, four SUCBs had negative CRAR in that year (Chart V.11). Latest supervisory returns suggest deterioration in CRAR of SUCBs to 9.8 per cent in H1:2019-20 from 13.5 per cent inH1:2018-19. 2.4 Asset Quality V.24 While UCBs had higher NPA ratio than SCBs till 2014-15, this was reversed on account of two distinct factors. First, the asset quality review (AQR), which resulted in better asset recognition of SCBs led to their NPA ratio rising to its true level. Second, the asset quality of UCBs has been gradually improving over time (Chart V.12). V.25 During 2018-19, UCBs registered moderate improvement in their asset quality, driven by the decline in the GNPA ratio of NSUCBs. Notwithstanding this improvement, the NSUCBs continue to have higher NPAs than SUCBs (Table V.7). SUCBs’ GNPA ratio deteriorated to 10.5 per cent in H1: 2019-20 reflecting large delinquencies in one of the fraud hit banks. V.26 Larger increase in provisions vis-à-vis GNPA enabled an improvement in UCBs’ provisioning coverage ratio (PCR) (Chart V.13). Given the elevated level of GNPA ratio in NSUCBs in comparison to SUCBs, the provisioning requirements of the former are correspondingly higher (Chart V.13). During H1: 2019-20, PCR of SUCBs reduced to 40.9 per cent from 48.4 per cent in H1:2018-19.
| Table V.7: Non-performing Assets of UCBs | | Sr. No. | Items | Scheduled UCBs | Non-Scheduled UCBs | All UCBs | | 2018 | 2019 | 2018 | 2019 | 2018 | 2019 | | 1 | 2 | 3 | 4 | 5 | 6 | 7 | 8 | | 1 | Gross NPAs (₹ crore) | 8,687 | 9,435 | 11,390 | 12,124 | 20,077 | 21,559 | | 2 | Gross NPA Ratio (%) | 6.3 | 6.4 | 7.9 | 7.7 | 7.2 | 7.1 | | 3 | Net NPAs (₹ crore) | 3,428 | 3,669 | 3,926 | 3,751 | 7,355 | 7,421 | | 4 | Net NPA Ratio (%) | 2.6 | 2.6 | 2.9 | 2.5 | 2.8 | 2.6 | | 5 | Provisioning (₹ crore) | 5,259 | 5,766 | 7,464 | 8,373 | 12,723 | 14,139 | | 6 | Provisioning Coverage Ratio (%) | 60.5 | 61.1 | 65.5 | 69.1 | 63.4 | 65.6 | Note: Data for 2019 are provisional.
Source: Off-site surveillance returns, RBI. |
2.5 Financial Performance and ProfitabilityV.27 UCBs recorded a decline in net profit after taxes in 2018-19. Interest expenses declined for the second consecutive year, notwithstanding a revival in deposit growth. The decline in interest income and interest expenses of all UCBs was driven by the NSUCBs whereas SUCBs registered a moderate growth in both. Non-interest income declined for both SUCBs and NSUCBs reflective of a decline in income from a host of fee-earning activities and loss on sale and trading of securities (Table V.8). V.28 The profitability of UCBs, measured in terms of return on equity (RoE), deteriorated marginally, mainly on account of below par performance of NSUCBs (Table V.9). During H1:2019-20, SUCBs posted losses. V.29 Notwithstanding this decline, the profitability indicators of NSUCBs, except RoE, remained higher than those of their scheduled counterparts (Chart V.14). 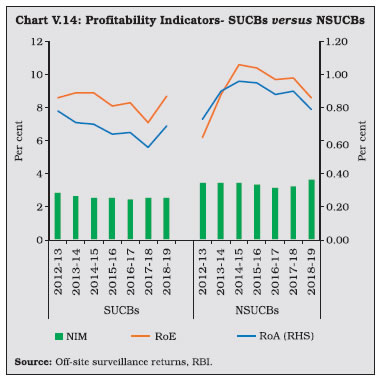
| Table V.8: Financial Performance of Scheduled and Non-scheduled Urban Co-operative Banks | | (Amount in ₹ crore) | | Item | Scheduled UCBs | Non-scheduled UCBs | All UCBs | All UCBs Variation (%) | | 2017-18 | 2018-19 | 2017-18 | 2018-19 | 2017-18 | 2018-19 | 2017-18 | 2018-19 | | 1 | 2 | 3 | 4 | 5 | 6 | 7 | 8 | 9 | | A. Total Income [i+ii] | 23,222 | 23,360 | 30,200 | 28,744 | 53,422 | 52,103 | 1.5 | -2.5 | | | (100.0) | (100.0) | (100.0) | (100.0) | (100.0) | (100.0) | | | | i. Interest Income | 20,237 | 20,794 | 28,332 | 27,226 | 48,569 | 48,020 | 2.1 | -1.1 | | | (87.1) | (89.0) | (93.8) | (94.7) | (90.9) | (92.2) | | | | ii. Non-interest Income | 2,986 | 2,566 | 1,867 | 1,517 | 4,853 | 4,084 | -4.1 | -15.9 | | | (12.9) | (11.0) | (6.2) | (5.3) | (9.1) | (7.8) | | | | B. Total Expenditure [i+ii] | 19,330 | 19,453 | 25,642 | 24,460 | 44,972 | 43,912 | 0.7 | -2.4 | | | (100.0) | (100.0) | (100.0) | (100.0) | (100.0) | (100.0) | | | | i. Interest Expenditure | 13,595 | 13,719 | 18,837 | 17,508 | 32,432 | 31,227 | -2.6 | -3.7 | | | (70.3) | (70.5) | (73.5) | (71.6) | (72.1) | (71.1) | | | | ii. Non-interest Expenditure | 5,735 | 5,733 | 6,805 | 6,952 | 12,540 | 12,685 | 10.4 | 1.2 | | | (29.7) | (29.5) | (26.5) | (28.4) | (27.9) | (28.9) | | | | of which: Staff Expenses | 2,486 | 2,591 | 3,631 | 3,609 | 6,117 | 6,199 | 4.7 | 1.3 | | C. Profits | | | | | | | | | | i. Amount of Operating Profits | 3,893 | 3,907 | 4,558 | 4,284 | 8,450 | 8,191 | 6.3 | -3.1 | | ii. Provision, Contingencies | 1,706 | 1,239 | 1,155 | 1,241 | 2,861 | 2,480 | 8.6 | -13.3 | | iii. Provision for taxes | 742 | 771 | 765 | 932 | 1,508 | 1,702 | 10.0 | 12.9 | | iv. Amount of Net Profit before Taxes | 2,187 | 2,669 | 3,403 | 3,043 | 5,589 | 5,711 | 5.2 | 2.2 | | v. Amount of Net Profit after Taxes | 1,445 | 1,898 | 2,637 | 2,111 | 4,082 | 4,009 | 3.5 | -1.8 | Notes: 1. Data for 2018-19 are provisional.
2. Components may not add up to the total due to rounding off.
3. Percentage variation could be slightly different because absolute numbers have been rounded off to ₹ crores.
Source: Off-site surveillance returns, RBI. | V.30 Bank-specific factors like credit risk, interest and non-interest income and the overall macroeconomic environment weigh in as the key determinants of UCBs’ profitability (Box V.2). | Table V.9: Select Profitability Indicators of UCBs | | (Per cent) | | Indicators | Scheduled UCBs | Non-scheduled UCBs | All UCBs | | 2017-18 | 2018-19 | 2017-18 | 2018-19 | 2017-18 | 2018-19 | | 1 | 2 | 3 | 4 | 5 | 6 | 7 | | Return on Assets | 0.56 | 0.69 | 0.90 | 0.79 | 0.74 | 0.74 | | Return on Equity | 7.14 | 8.71 | 9.88 | 8.62 | 8.70 | 8.66 | | Net Interest Margin | 2.56 | 2.57 | 3.25 | 3.62 | 2.93 | 3.12 | Note: Data for 2018-19 are provisional.
Source: Off-site surveillance returns, RBI. | 2.6 Priority Sector Advances V.31 The Reserve Bank revised guidelines on lending by UCBs to the priority sector9 effective May 10, 2018. New categories like credit to food and agro-processing units, medium enterprises, social infrastructure and renewable energy formed part of the priority sector. The distinction between direct and indirect credit was dispensed with and micro-credit ceased to be a separate category under the priority sector. V.32 Historically, UCBs’ lending to the priority sector has been higher than their prescribed priority sector targets. Despite inclusion of new categories in the priority sector targets, UCBs recorded a dip in the share of priority sector advances in total advances during 2018-19 but maintained it above the overall priority target of 40 per cent (Table V.10). Box V.2: Drivers of Profitability of Scheduled Urban Co-operative Banks (SUCBs) Balance sheet dynamics suggest that key determinants impacting profitability of Urban Co-operative Banks (UCBs) are credit risk and non-interest income. In the context of Indian scheduled commercial banks (SCBs), efficiency of fund management—defined as the ratio of interest expenses to interest income—is found to be a prominent determinant of their profitability (Rakhe, 2010). Economic literature points to macroeconomic factors driving profitability of banks besides bank-specific factors (Athanasoglou et.al 2005, Kohlscheen et. al 2018). A fixed effects panel framework using annual balance sheet data for 52 SUCBs10 and macroeconomic data for the period 2012-2019 is employed, with the return on assets (RoA) defined as ratio of net profits to total assets as the dependent variable. Among bank-specific factors, non-interest income ratio emerges as the most important determinant of profitability of SUCBs (Table 1). Credit risk (proxied by ratio of provisions and contingencies to loans and advances) adversely affects the profitability of SUCBs as additional provisions in times of stress leaves lesser resources for lending or investment. Other bank-specific factors like interest expenses to interest income negatively impact profitability of SUCBs. In the case of macroeconomic control variables, real GDP growth positively impacts the RoA, implying pro-cyclicality of bank profitability–high growth is usually fuelled by high credit demand, which propels bank profitability. The WALR of SCBs, taken as a proxy for lending rate is positively related to the same. | Table 1: Dependent Variable – Return on Assets | | | (1) | (2) | (3) | (4) | | Credit Risk | -0.119*** | -0.113*** | -0.118*** | -0.115*** | | | (0.0217) | (0.0239) | (0.0216) | (0.0209) | | Interest expenses to interest income | -0.0396*** | -0.0383*** | -0.0404*** | -0.0402*** | | | (0.00714) | (0.00634) | (0.00737) | (0.00697) | | Non-interest income to working fund | | 0.197** | | | | | | (0.0829) | | | | Non-interest expenses to total assets | | | -0.0950 | | | | | | (0.0585) | | | Real GDP Growth | | | | 0.0895* | | | | | | (0.0496) | | Inflation | | | | -0.136 | | | | | | (0.0832) | | WALR | | | | 0.389*** | | | | | | (0.128) | | cons | 3.684*** | 3.472*** | 3.942*** | -0.849 | | | (0.470) | (0.435) | (0.514) | (0.928) | | Bank fixed effects | Yes | Yes | Yes | Yes | | Time fixed effects | Yes | Yes | Yes | No | | N | 388 | 388 | 388 | 388 | | R2 | 0.336 | 0.362 | 0.341 | 0.322 | Robust standard errors in parentheses
* p < 0.10, ** p < 0.05, *** p < 0.01 | References Athanasoglou, P. P., Brissimis, S. N., & Delis, M. D. (2008). Bank-specific, industry-specific and macroeconomic determinants of bank profitability. Journal of international financial Markets, Institutions and Money, 18(2), 121- 136. Kohlscheen, E., Murcia Pabón, A., & Contreras, J. (2018). Determinants of bank profitability in emerging markets. BIS Working Papers, No 686. Rakhe, P.B., (2010), “Profitability of Foreign Banks vis-à-vis Other Bank Groups in India – A Panel Data Analysis”, Reserve Bank of India Occasional Papers Vol. 31, No.2. | V.33 The composition of credit to the priority sector by UCBs shows that lending to micro, small and medium enterprises (MSMEs) accounted for 60.7 per cent of the total priority sector advances, followed by advances to housing. Given the urban focus of UCBs, their share of agricultural lending under the priority sector is low. V.34 UCBs are mandated to provide 10 per cent of adjusted net bank credit (ANBC) to weaker sections11. During 2018-19, credit to weaker sections fell below the minimum target of 10 per cent of ANBC and their share in overall lending to the priority sector also fell to 21 per cent. | Table V.10: Composition of Credit to Priority Sectors by UCBs | | (As on March 31, 2019) | | (Amount in ₹ crore) | | Item | Priority Sector Advances | | Amount | Share in Total Advances (%) | | 1 | 2 | 3 | | 1. Agriculture [(i)+(ii)+(iii)] | 9,803 | 3.2 | | (i) Farm Credit | 7,209 | 2.4 | | (ii) Agriculture Infrastructure | 589 | 0.2 | | (iii) Ancillary Activities | 2,005 | 0.7 | | 2. Micro, Small and Medium Enterprises [(i) + (ii)+(iii)+(iv)] | 81,387 | 26.9 | | (i) Micro Enterprises | 27,789 | 9.2 | | (ii) Small Enterprises | 42,232 | 13.9 | | (iii) Medium Enterprises | 11,013 | 3.6 | | (iv) Advances to KVI (Including ‘Other Finance to MSMEs’) | 353 | 0.1 | | 3. Export Credit | 218 | 0.1 | | 4. Education | 1,910 | 0.6 | | 5. Housing | 22,721 | 7.5 | | 6. Social Infrastructure | 831 | 0.3 | | 7. Renewable Energy | 241 | 0.1 | | 8. ‘Others’ category under Priority Sector | 16,916 | 5.6 | | 9. Total (1 to 8) | 1,34,028 | 44.2 | | of which, Loans to Weaker Sections under Priority Sector | 28,143 | 9.3 | Notes: 1. Data for 2019 are provisional. Component-wise comparable data for previous years are not available due to changes in priority sector norms.
2. Components may not add up to the total due to rounding off.
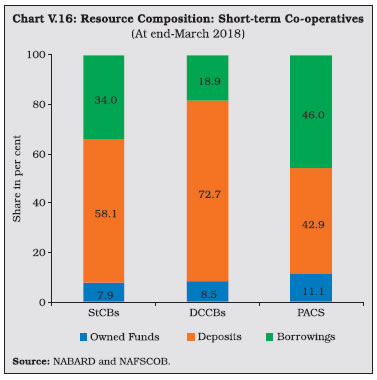
Source: Off-site surveillance returns, RBI. | 3. Rural Co-operatives V.35 Rural co-operatives play an important role in delivering affordable institutional credit and promoting financial inclusion in underbanked areas through their geographical outreach. Short-term co-operatives primarily meet crop loan requirements whereas long-term co-operatives make credit available for capital formation in agriculture, rural industries and housing. Although the focus of rural co-operative lending is agriculture, the share of rural co-operatives to this category of loans —which was as high as 64 per cent in 1992-93—has fallen dramatically over the years while commercial banks have acquired a dominant position (Table V.11). | Table V.11: Share in Credit Flow – Rural Co-operatives | | (Figures in Per cent) | | | Share in Credit Flow to Agriculture | | Co-operative Banks | Regional Rural Banks | SCBs | | 2014-15 | 16.4 | 12.1 | 71.5 | | 2015-16 | 16.7 | 13.0 | 70.2 | | 2016-17 | 13.4 | 11.6 | 75.0 | | 2017-18 | 12.9 | 12.1 | 74.9 | | 2018-19 | 12.1 | 11.9 | 76.0 | | Source: NABARD. | V.36 As of March 2018, short-term cooperatives comprising StCBs, DCCBs and PACS accounted for 94.2 per cent of the total assets of rural co-operatives (Chart V.15). V.37 Long-term co-operatives comprise State Co-operative Agriculture and Rural Development Banks (SCARDBs) and Primary Co-operative Agriculture and Rural Development Banks (PCARDBs). Due to the limited range of credit products and relatively lower outreach, their share in the total assets of rural co-operatives has been declining over the years. V.38 The structure of short-term rural cooperatives is largely federal – with StCBs acting as the apex body – whereas that of long-term co-operatives varies significantly across states. Presently, out of the thirteen fully functional SCARDBs, five (Gujarat, Jammu & Kashmir, Puducherry, Tripura and Uttar Pradesh) are unitary, i.e., they operate through their branches with no separate PCARDBs, six (Haryana, Karnataka, Kerala, Punjab, Rajasthan and Tamil Nadu) are federal where they operate through PCARDBs, and two (Himachal Pradesh and West Bengal) have mixed structure with SCARDBs operating through PCARDBs as well as through their branches. 3.1 Short-term Co-operatives V.39 Short-term co-operatives are arranged in a three-tier structure in most of the states, StCBs at the apex level, DCCBs at the intermediate level and PACS at the grassroots level. Deposits are the dominant component of the liability structure of StCBs, and especially of DCCBs whose extensive branch network enables higher deposit mobilisation. In the case of PACS, however, borrowings from StCBs and DCCBs are the key sources of funds12 (Chart V.16). 3.1.1 State Co-operative Banks V.40 StCBs are established in each state to mobilise deposits, provide liquidity support and offer technical assistance to DCCBs and PACS. In terms of size, StCBs account for 23 per cent of assets of short-term rural co-operatives and rely on the NABARD refinance facility as the major source of borrowings. | Table V.12: A Profile of Rural Co-operatives | | (At end-March 2018) | | (Amount in ₹ crore) | | Item | Short-term | Long-term | | StCBs | DCCBs | PACS | SCARDBs | PCARDBs | | 1 | 2 | 3 | 4 | 5 | 6 | | A. Number of Co-operatives | 33 | 363 | 95,238 | 13 | 601 | | B. Balance Sheet Indicators | | | | | | | i. Owned Funds (Capital + Reserves) | 16,782 | 40,624 | 30,942 | 4,305 | 3,288 | | ii. Deposits | 1,23,534 | 3,47,967 | 1,19,632 | 2,341 | 1,306 | | iii. Borrowings | 72,170 | 90,312 | 1,28,333 | 15,400 | 16,349 | | iv. Loans and Advances | 1,31,934 | 2,77,079 | 2,07,322 | 20,788 | 15,821 | | v. Total Liabilities/Assets | 2,26,841 | 5,25,157 | 2,43,563* | 28,994 | 30,550 | | C. Financial Performance | | | | | | | i. Institutions in Profits | | | | | | | a. No. | 32 | 311 | 46,405 | 9 | 257 | | b. Amount of Profit | 1,037 | 1,744 | 4,134 | 74 | 127 | | ii. Institutions in Loss | | | | | | | a. No. | 1 | 52 | 37,838 | 4 | 344 | | b. Amount of Loss | 7 | 893 | 7,316 | 83 | 638 | | iii. Overall Profits (+)/Loss (-) | 1,030 | 851 | -3,182 | -9 | -511 | | D. Non-performing Assets | | | | | | | i. Amount | 6,223 | 30,894 | 47,915** | 5,206 | 6,058 | | ii. As percentage of Loans Outstanding | 4.7 | 11.2 | 28.2 | 25.0 | 38.4 | | E. Recovery of Loans to Demand Ratio# (Per cent) | 94.2 | 71.1 | 75.6 | 48.4 | 41.1 | Notes: StCBs: State Co-operative Banks; DCCBs: District Central Co-operative Banks; PACS: Primary Agricultural Credit Societies; SCARDBs: State Co-operative Agriculture and Rural Development Banks; PCARDBs: Primary Co-operative Agriculture and Rural Development Banks.
*: Working Capital. **: Total overdues. #: This ratio captures the share of outstanding non-performing loan amounts that have been recovered.
Source: NABARD and NAFSCOB. |
 Balance Sheet Operations V.41 The consolidated balance sheet of StCBs contracted in 2017-18 on account of a decline in investments and cash and bank balances on the asset side. On the liability side, borrowings declined due to a fall in the short-term refinance support provided by NABARD. Deposits, which account for more than half of the liability side, decelerated during 2017-18, from a high base in the previous year when StCBs were allowed to garner deposits in the form of specified bank notes in the post-demonetisation period. On the assets side, StCBs unwound their investments to extend loans and advances especially against the backdrop of lower refinance support and muted deposits growth (Table V.13). V.42 The latest data available for scheduled StCBs show acceleration in both deposit and credit growth in 2018-19 (Table V.14). | Table V.13: Liabilities and Assets of State Co-operative Banks | | (At end-March 2018) | | (Amount in ₹ crore) | | Item | At end-March | Percentage Variation | | 2017 | 2018 | 2016-17 | 2017-18 | | 1 | 2 | 3 | 4 | 5 | | Liabilities | | | | | | 1. Capital | 5,161 | 5,542 | -7.1 | 7.4 | | | (2.2) | (2.4) | | | | 2. Reserves | 10,294 | 11,240 | 9.6 | 9.2 | | | (4.4) | (4.9) | | | | 3. Deposits | 1,22,039 | 1,23,534 | 11.6 | 1.2 | | | (52.3) | (54.4) | | | | 4. Borrowings | 80,892 | 72,170 | 17.6 | -10.8 | | | (34.7) | (31.8) | | | | 5. Other Liabilities | 14,515 | 14,355 | 6.6 | -1.1 | | | (6.2) | (6.3) | | | | Assets | | | | | | 1. Cash and Bank Balances | 9,660 | 9,288 | 51.6 | -3.9 | | | (4.1) | (4.0) | | | | 2. Investments | 84,613 | 74,398 | 22.6 | -12.1 | | | (36.3) | (32.7) | | | | 3. Loans and Advances | 1,27,048 | 1,31,934 | 3.4 | 3.9 | | | (54.5) | (58.1) | | | | 4. Other Assets | 11,580 | 11,221 | 36.2 | -3.1 | | | (4.9) | (4.9) | | | | Total Liabilities/Assets | 2,32,901 | 2,26,841 | 12.7 | -2.6 | | | (100.00) | (100.00) | | | Notes: 1. Figures in parentheses are proportion to total liabilities/assets
2. Y-o-Y variations could be slightly different because absolute numbers have been rounded off to ₹ 1 crore in the table.
3. Components may not add up to the total due to rounding off.
Source: NABARD. | Profitability V.43 Net profits of StCBs decelerated during 2017-18 after a significant increase in the previous year. The slowdown mainly reflected a sharp increase in provisions and contingencies in consonance with deteriorating asset quality during the year. On the positive side, however, net interest income rose; although interest income decelerated, it was outweighed by the contraction in the interest expenses. Another positive factor was the slowdown in operating expenses, notwithstanding the acceleration in the wage bill. Consequently, operating profits of the StCBs reversed the contraction of the previous two years and grew in double digits (Table V.15). | Table V.14: Select Balance Sheet Indicators of Scheduled State Co-operative Banks | | (Amount in ₹ crore) | | Item | 2014-15 | 2015-16 | 2016-17 | 2017-18 | 2018-19 | | 1 | 2 | 3 | 4 | 5 | 6 | | Deposits | 77,233 | 79,564 | 90,277 | 98,768 | 1,10,559 | | | (-0.6) | (3.0) | (13.5) | (9.4) | (11.9) | | Credit | 1,03,798 | 1,07,360 | 1,10,934 | 1,17,989 | 1,31,399 | | | (10.6) | (3.4) | (3.3) | (6.4) | (11.4) | | SLR Investments | 23,294 | 24,220 | 26,225 | 33,411 | 33,130 | | | (-3.1) | (4.0) | (8.3) | (27.4) | (-0.8) | | Credit plus SLR Investments | 1,27,092 | 1,31,580 | 1,37,159 | 1,51,400 | 1,64,529 | | | (7.8) | (3.5) | (4.2) | (10.4) | (8.7) | Notes: 1. Data pertains to last reporting Friday of March of the corresponding year.
2. Figures in brackets are growth rates in per cent over previous year.
Source: Form B under Section 42 of RBI Act (as submitted by scheduled StCBs). |
| Table V.15: Financial Performance of State Co-operative Banks | | (Amount in ₹ crore) | | Item | As during | Variation (%) | | 2016-17 | 2017-18 | 2016-17 | 2017-18 | | 1 | 2 | 3 | 4 | 5 | | A. Income (i+ii) | 15,247 | 15,477 | -0.7 | 1.5 | | | (100.0) | (100.0) | | | | i. Interest Income | 14,691 | 14,798 | 1.3 | 0.7 | | | (97.8) | (95.6) | | | | ii. Other Income | 556 | 679 | -30.0 | 22.1 | | | (1.9) | (4.5) | | | | B. Expenditure (i+ii+iii) | 14,295 | 14,447 | -2.7 | 1.1 | | | (100.0) | (100.0) | | | | i. Interest Expended | 11,520 | 11,450 | -3.5 | -0.6 | | | (80.5) | (79.2) | | | | ii. Provisions and Contingencies | 860 | 1,078 | -33.3 | 25.3 | | | (6.0) | (7.4) | | | | iii. Operating Expenses | 1,915 | 1,919 | 15.8 | 0.2 | | | (13.3) | (13.2) | | | | Of which : Wage Bill | 1,148 | 1,212 | 0.0 | 5.6 | | | (8.0) | (10.5) | | | | C. Profitability | | | | | | Operating Profits | 1,482 | 1,818 | -16.7 | 22.7 | | Net Profits | 952 | 1,030 | 66.7 | 8.2 | Notes: 1. Figures in parentheses are proportion to total income/expenditure (in per cent).
2. Y-o-Y variations could be slightly different because absolute numbers have been rounded off to ₹ 1 crore in the table.
3. Components may not add up to the total due to rounding off.
Source: NABARD. |
Asset QualityV.44 The asset quality of StCBs—as reflected in the NPA ratio—had been improving continuously since 2012-13, but it deteriorated during 2017- 18. Alongside significant accretions to NPAs, both the doubtful and loss component of NPAs also increased, notwithstanding an increase in the recovery-to-demand ratio (Table V.16). V.45 This deterioration is stark against the backdrop of improvement in asset quality of UCBs and SCBs (Chart V.17). V.46 From a regional perspective, there has been an increase in the NPA ratio in 2017-18 across all regions except in the north-eastern region (Chart V.18a). The all-India recovery-to-demand ratio improved for StCBs, driven by the northern, eastern and southern regions. (Chart V.18b). 3.1.2 District Central Co-operative Banks V.47 DCCBs—the intermediate tier in the short-term rural co-operatives structure—mobilise deposits from the public and provide credit to the public and PACS. DCCBs’ borrowings comprise of loans and advances from StCBs and direct refinancing from the NABARD. They have a large number of depositors, given their branch network. This also results in a lower credit-to-deposit ratio than StCBs (Chart V.19). | Table V.16: Soundness Indicators: State Co-operative Banks | | (Amount in ₹ crore) | | Item | At end-March | Variation (%) | | 2017 | 2018 | 2016-17 | 2017-18 | | 1 | 2 | 3 | 4 | 5 | | A. Total NPAs (i+ii+iii) | 5,180 | 6,223 | -7.1 | 20.1 | | i. Sub-standard | 1,592 | 2,293 | -15.8 | 44.0 | | | (30.8) | (36.8) | | | | ii. Doubtful | 2,419 | 2,539 | -4.0 | 4.9 | | | (46.2) | (40.7) | | | | iii. Loss | 1,168 | 1,397 | 0.0 | 19.6 | | | (23.1) | (22.4) | | | | B. NPAs to Loans Ratio (%) | 4.1 | 4.7 | - | - | | C. Recovery to Demand Ratio (%) | 93.5 | 94.2 | - | - | Notes: 1. Figures in parentheses are shares in total NPA (%).
2. Absolute numbers have been rounded off, leading to slight variations in per cent.
3. Components may not add-up to the total due to rounding off.
Source: NABARD. |
Balance Sheet Operations V.48 During 2017-18, the balance sheet of DCCBs decelerated on slowdown in deposits on the liabilities side, and in investments on the asset side. Loans and advances, which revived after a deceleration in the previous year, were funded mainly through reduction in cash and bank balances (Table V.17).
ProfitabilityV.49 The net profit of DCCBs declined for the second consecutive year, though the pace of reduction slowed. This was mainly on account of higher provision requirements and slower growth in interest income (Table V.18). | Table V.17: Liabilities and Assets of District Central Co-operative Banks | | (Amount in ₹ crore) | | Item | At end-March | Variation (%) | | 2017 | 2018 | 2016-17 | 2017-18 | | 1 | 2 | 3 | 4 | 5 | | Liabilities | | | | | | 1. Capital | 18,674 | 19,693 | 13.3 | 5.5 | | | (3.6) | (3.7) | | | | 2. Reserves | 19,766 | 20,931 | 13.1 | 5.9 | | | (3.9) | (3.9) | | | | 3. Deposits | 3,30,904 | 3,47,967 | 11.0 | 5.2 | | | (65.4) | (66.2) | | | | 4. Borrowings | 91,438 | 90,312 | 9.3 | -1.2 | | | (18.0) | (17.1) | | | | 5. Other Liabilities | 44,698 | 46,254 | 5.4 | 3.5 | | | (8.8) | (8.8) | | | | Assets | | | | | | 1. Cash and Bank Balances | 32,874 | 27,230 | 41.2 | -17.2 | | | (6.5) | (5.1) | | | | 2. Investments | 1,84,634 | 1,84,883 | 14.5 | 0.1 | | | (36.5) | (35.2) | | | | 3. Loans and Advances | 2,52,655 | 2,77,079 | 4.1 | 9.7 | | | (49.9) | (52.7) | | | | 4. Other Assets | 35,317 | 35,965 | 15.0 | 1.8 | | | (6.9) | (6.8) | | | | Total Liabilities/Assets | 5,05,480 | 5,25,157 | 10.3 | 3.9 | | | (100.00) | (100.00) | | | Notes: 1. Figures in parentheses are proportion to total liabilities/assets
2. Y-o-Y variations could be slightly different because absolute numbers have been rounded off to ₹ 1 crore in the table.
3. Components may not add up to the total due to rounding off.
Source: NABARD. | Asset Quality V.50 The asset quality of DCCBs deteriorated in 2017-18. Although there was a marginal deceleration in the growth of sub-standard and doubtful assets, they remained at elevated levels (Table V.19). The decline in the asset quality is attributable to farm loan waivers announced by various state governments13. Pari passu, the recovery to demand ratio of DCCBs declined during this period across all regions with the exception of the southern region (Chart V.20). | Table V.18: Financial Performance of District Central Co-operative Banks | | (Amount in ₹ crore) | | Item | As during | Variation (%) | | 2016-17 | 2017-18 | 2016-17 | 2017-18 | | 1 | 2 | 3 | 4 | 5 | | A. Income (i+ii) | 38,546 | 39,437 | 4.9 | 2.3 | | | (100.0) | (100.0) | | | | i. Interest Income | 36,592 | 37,669 | 5.5 | 2.9 | | | (94.9) | (95.5) | | | | ii. Other Income | 1,954 | 1,768 | 2.8 | -9.5 | | | (5.0) | (4.6) | | | | B. Expenditure (i+ii+iii) | 37,636 | 38,587 | 5.9 | 2.5 | | | (100.0) | (100.0) | | | | i. Interest Expended | 26,849 | 26,788 | 7.2 | -0.2 | | | (71.3) | (69.4) | | | | ii. Provisions and Contingencies | 3,020 | 3,476 | 3.4 | 15.1 | | | (8.0) | (9.0) | | | | iii. Operating Expenses | 7,767 | 8,323 | 2.6 | 7.2 | | | (20.6) | (21.5) | | | | Of which : Wage Bill | 4,980 | 5,222 | 4.2 | 4.9 | | | (13.2) | (13.5) | | | | C. Profits | | | | | | i. Operating Profits | 3,331 | 3,812 | -17.5 | 14.4 | | ii. Net Profits | 910 | 850 | -18.2 | -6.6 | Notes: 1. Figures in parentheses are proportion to total liabilities/assets.
2. Y-o-Y variations could be slightly different because absolute numbers have been rounded off to ₹ 1 crore in the table.
3. Components may not add up to the total due to rounding off.
Source: NABARD. |
V.51 DCCBs have persistently higher NPA ratios and lower recovery to demand ratio than StCBs (Chart V.21a). The share of agricultural lending in the portfolio of DCCBs is higher than that of StCBs; as such, their balance sheets are exposed to the volatility in agricultural prices and output. DCCBs also have a higher share of operating expenses in overall expenses than StCBs due to their district level presence, which requires larger staff costs (Chart V.21b). 3.1.3 Primary Agricultural Credit Societies (PACS) V.52 PACS form the third tier of short-term cooperatives. Apart from providing agricultural loans, they also arrange for the supply of agricultural inputs, distribution of consumer articles and marketing of produce for their members. | Table V.19: Soundness Indicators: District Central Co-operative Banks | | (Amount in ₹ crore) | | Item | At end-March | Variation (%) | | 2017 | 2018 | 2016-17 | 2017-18 | | 1 | 2 | 3 | 4 | 5 | | A. Total NPAs (i+ii+iii) | 26,414 | 30,894 | 16.3 | 17.0 | | i. Sub-standard | 11,982 | 15,094 | 26.3 | 26.0 | | | (45.3) | (48.8) | | | | ii. Doubtful | 12,040 | 13,232 | 10.1 | 9.9 | | | (45.5) | (42.8) | | | | iii. Loss | 2,392 | 2,568 | 4.3 | 7.4 | | | (9.0) | (8.3) | | | | B. NPAs to Loans Ratio (%) | 10.5 | 11.2 | - | - | | C. Recovery to Demand Ratio (%) | 78.9 | 71.1 | - | - | Notes: 1. Figures in parentheses are proportion to total NPAs.
2. Y-o-Y variations could be slightly different because absolute numbers have been rounded off to ₹ 1 crore in the table.
3. Components may not add up to the total due to rounding off.
Source: NABARD. | V.53 The liabilities side of the consolidated balance sheet of PACS – both deposits and borrowings – decelerated sharply in 2017-18 (Appendix Table V.5). On the asset side, credit declined mainly on the back of contraction in short-term loans and deceleration in long-term advances. The share of agriculture in total lending of PACS is 54.9 per cent. (Appendix Table V.6). V.54 The losses of PACS outweighed their profits in 2017-18. The Southern region contributed around two-third of the total losses (Appendix Table V.6). V.55 PACS extend loans only to their members and therefore, borrower to member ratio is a useful indicator for access to and demand for credit. During 2017-18, the ratio declined to 38.8 per cent from 39.6 per cent in 2016- 17. The decline in the ratio was particularly striking in the case of ST members (Appendix Table V.7). 4. Long-term Rural Co-operatives V.56 Long-term rural co-operatives consist of State Co-operative Agriculture and Rural Development Banks (SCARDBs) operating at the state level and Primary Co-operative Agriculture and Rural Development Banks (PCARDBs) operating at the district/block level. These institutions play an important role in agricultural development by purveying long-term credit for capital. As of end-March 2018, there were 13 SCARDBs and 601 PCARDBs across the country. 4.1 State Co-operative Agriculture and Rural Development Banks (SCARDBs) V.57 The consolidated balance sheet of SCARDBs contracted during 2017-18 in contrast to an expansion in the previous year (Appendix Table V.8). SCARDBs continued to report net losses for the second consecutive year (Appendix Table V.9). Asset quality, measured in terms of the NPA ratio, also deteriorated (Appendix Table V.10). Among the states, Kerala maintained the highest recovery rate and the lowest NPA ratio, while Haryana had the highest NPA ratio (Appendix Table V.11) 4.2 Primary Co-operative Agriculture and Rural Development Banks (PCARDBs) V.58 The balance sheet of PCARDBs, which showed signs of revival in 2016-17, deteriorated in 2017-18 (Appendix Table V.12). PCARDBs posted operating profits due to moderation in operating expenses reversing the operating losses of the previous year (Appendix Table V.13). Like the SCARDBs, the NPA ratio of PCARDBs also deteriorated (Appendix Table V.14). 5. Overall Assessment V.59 The year 2018-19 turned out to be one of consolidation and expansion in balance sheets for UCBs, along with an improvement in asset quality and provision coverage ratio. Driving this improvement were various measures taken by the government and the Reserve Bank to strengthen this sector’s performance and financial health. Recently, the unearthing of irregularities in one of the UCBs has brought to the forefront issues relating to low capital base, weak corporate governance, inability to prevent frauds, slower adoption of new technology and inadequate system of checks and balances. Going forward, UCBs need to break out of these drags. The highest priority needs to be assigned to the establishment of a uniform regulatory and supervisory structure and an umbrella organisation in the architecture, which will provide liquidity and capital support and galvanise the spread of and leveraging on IT infrastructure and other capacity and skill building facilities. V.60 Looking ahead, the co-operative sector faces dual challenges: first, increasing competition from not only SCBs but also from small finance banks and payments banks; and second, vulnerability stemming from internal weaknesses including the inability to prevent frauds. Although this sector accounts for just 10.6 per cent of the commercial banking sector, the need to strengthen it from the financial stability point of view cannot be overemphasised, given its predominant domestic orientation, its massive financial inclusion quotient and its sheer presence across the country, especially in lower tier towns and villages. In view of this important role, there is a need to undertake reforms aimed at upgrading corporate governance and strengthening their financials.
|