Consolidated operations1 2.1 The consolidated balance sheets of the banking sector continued to grow at a modest pace during 2015-16 with assets/liabilities expanding at 7.7 per cent as compared to 9.7 per cent in 2014-15 (Chart 2.1). A high and rising proportion of banks’ delinquent loans, particularly those of public sector banks (PSBs) and a consequent increase in provisioning for non-performing assets (NPAs) continued to weigh on credit growth reflecting their lower risk appetite and stressed financial position. Consequently, growth in loans and advances of PSBs decelerated to 2.1 per cent in 2015-16 from 7.4 per cent in the previous year (Chart 2.2). On the liability side, moderation in deposit growth was commensurate.
Current and saving account deposits 2.2 During 2015-16, SCBs’ low-cost current and saving account (CASA) deposits posted marginally higher growth as compared to the previous year. Both private sector banks (PVBs) and foreign banks (FBs) witnessed higher growth in CASA deposits as compared to PSBs (Chart 2.3). Credit-deposit ratio 2.3 While the credit-deposit (C-D) ratio of the banking system remained around 78 per cent, it was significantly higher at 90.3 per cent for PVBs as at end-March 2016 (Chart 2.4). Maturity profile of liabilities and assets 2.4 Almost half of the total deposits and borrowings of the banking sector were short-term in nature as at end-March 2016 (Chart 2.5). Long-term assets financed by short-term liabilities showed an increase during 2015-16 (Chart 2.6).
Off-balance sheet operations 2.5 During 2015-16, banks’ off-balance sheet operations contracted. Forward exchange contracts which accounted for more than 86 per cent of the total off-balance sheet liabilities of banks in 2015-16 declined by 4.9 per cent during the year (Chart 2.7). The share of FBs in total off-balance sheet operations of the banking sector remained the highest at 50.9 per cent, followed by PSBs (25.7 per cent) and PVBs (23.4 per cent).
Financial performance of SCBs 2.6 During 2015-16, SCBs’ interest earnings and non-interest incomes were adversely affected. Interest income reflected the impact of the continuing slowdown in credit growth. Interest expended also witnessed deceleration. However, growth in net interest income declined as compared to the previous year. Further, operating expenses showed an improvement largely due to moderate growth in the wage bill. Provisions and contingencies surged due to a sharp deterioration in asset quality. Provisioning for NPAs more than doubled on account of improved recognition of non-performing assets. This led to a more than 60 per cent drop in net profits for the banking sector as a whole though it remained in the positive zone (Chart 2.8). Bank group-wise, PVBs and FBs reported net profits while PSBs incurred losses. PSBs reported losses to the tune of ₹180 billion with net profits declining by 148 per cent over the previous year. 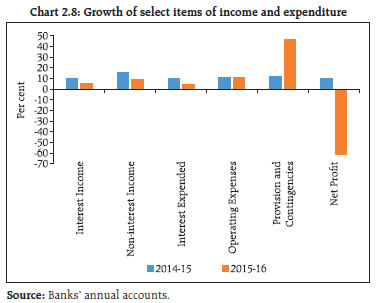 2.7 Net interest margin (NIM) came under further pressure during the year due to loss of interest from standard assets slipping into NPAs, the impact of implementation of the Ujwal DISCOM Assurance Yojana (UDAY) leading to lower yields and adoption of the marginal cost lending rate (MCLR) during a decreasing rate scenario. Lower costs of funds could not offset the decline in NIM. Spread marginally increased in 2015-16 (Chart 2.9). 2.8 During the year, major indicators of profitability, that is, banks’ return on assets (RoA) and return on equity (RoE) showed a substantial decline as compared to the previous year, reflecting the impact of a sharp decline in net profits. PSBs reported negative RoA (Table 2.1). | Table 2.1: SCBs’ return on assets and return on equity (bank group-wise) | | (per cent) | | Sr. no. | Bank group | Return on assets | Return on equity | | 2014-15 | 2015-16 | 2014-15 | 2015-16 | | 1 | Public Sector Banks | 0.46 | -0.20 | 7.76 | -3.47 | | | 1.1 Nationalised Banks* | 0.37 | -0.49 | 6.44 | -8.52 | | | 1.2 The State Bank Group | 0.66 | 0.42 | 10.56 | 6.78 | | 2 | Private Sector Banks | 1.68 | 1.50 | 15.74 | 13.81 | | 3 | Foreign Banks | 1.84 | 1.45 | 10.24 | 8.00 | | 4 | All SCBs | 0.81 | 0.31 | 10.42 | 3.59 | Notes: Return on assets = net profit/average total assets. Return on equity = net profit/average total equity.
* Nationalised banks include IDBI Bank Ltd and Bharatiya Mahila Bank Ltd.
Source: Banks’ annual accounts. | Bank group-wise share in assets and profits 2.9 The declining trend in the share of assets and profits of PSBs continued during 2015-16 reflecting slower growth in assets and large losses (Chart 2.10). Recovery of NPAs 2.10 Banks have been making all efforts to reduce their non-performing assets through various legal channels like resolutions through Lok Adalats, Debt Recovery Tribunals (DRTs) and invocation of SARFAESI. However, the amount recovered by all SCBs during 2015-16 reduced to ₹227.68 billion as against ₹307.92 billion during the previous year (Table 2.2). PSBs, which are burdened with a high proportion of the banking sector’s NPAs, could recover only ₹197.57 billion as against ₹278.49 billion during the previous year (Table 2.3). The deceleration in recovery was mainly due to a reduction in recovery through the SARFAESI channel by 52 per cent from ₹256 billion in 2014-15 to ₹131.79 billion in 2015-16. On the other hand, recovery through Lok Adalats and DRTs increased. | Table 2.2: SCBs’ NPAs recovered through various channels | | (Amount in ₹ billion) | | | 2014-15 (Revised) | 2015-16 | | Channel of Recovery | No. of cases Referred | Amount involved | Amount Recovered * | No. of cases Referred | Amount involved | Amount Recovered * | | Lok Adalats | 29,58,313 | 309.79 | 9.84 | 44,56,634 | 720.33 | 32.24 | | DRTs | 22,004 | 603.71 | 42.08 | 24,537 | 693.41 | 63.65 | | SARFAESI | 1,75,355 | 1,567.78 | 256.00 | 1,73,582 | 801.00 | 131.79 | | Total | 31,55,672 | 2,481.28 | 307.92 | 46,54,753 | 2,214.74 | 227.68 | Note: * refers to the amount recovered during the given year, which could be with reference to cases referred during the given year and those referred during earlier years.
Source: RBI Supervisory Returns. |
| Table 2.3: PSBs’ NPAs recovered through various channels | | (Amount in ₹ billion) | | | 2014-15 (Revised) | 2015-16 | | Channel of Recovery | No. of cases Referred | Amount involved | Amount Recovered * | No. of cases Referred | Amount involved | Amount Recovered * | | Lok Adalats | 25,96,351 | 270.20 | 9.31 | 42,44,800 | 690.17 | 31.34 | | DRTs | 18,397 | 532.03 | 34.84 | 19,133 | 574.39 | 55.90 | | SARFAESI | 1,66,804 | 1,463.06 | 234.34 | 1,59,147 | 650.08 | 110.33 | | Total | 27,81,552 | 2,265.29 | 278.49 | 44,23,080 | 1,914.64 | 197.57 | Note: * refers to the amount recovered during the given year, which could be with reference to cases referred during the given year and those referred during earlier years.
Source: RBI Supervisory Returns. | 2.11 Banks also reduced their stressed assets by selling them to asset reconstruction companies (ARCs). This has been increasing since March 2014 because of the regulatory support extended to banks under the Framework to Revitalise the Distressed Assets in the Economy (Table 2.4). | Table 2.4: Number of ARCs and assets acquired from banks | | (Amount in ₹ billion) | | Values | December 2013 | March 2014 | March 2015 | March 2016 | | Company count | 5 | 13 | 14 | 16 | | Total acquired from banks | 163.56 | 351.64 | 584.79 | 726.26 | | Source: RBI Supervisory Returns. | Priority sector credit 2.12 In contrast to the trend in total credit, the priority sector registered a strong growth of 16.0 per cent during 2015-16 as compared to 9.3 per cent in the previous year. Credit for housing loans increased significantly (Chart 2.11). SCBs as a whole could achieve the priority sector target of 40 per cent (of adjusted net bank credit (ANBC) or credit equivalent amount of off-balance sheet exposure, whichever is higher). As on end-March 2016, bank-group wise achievement of priority sector target is: PSBs (39.3 per cent), PVBs (45.1 per cent) and FBs (35.3 per cent). Priority sector lending certificates 2.13 The priority sector lending certificates (PSLCs) scheme introduced by the Reserve Bank in April 2016 provides for the purchase of these instruments by banks in the event of a shortfall in their achievement of PSL targets/sub-targets. It simultaneously incentivises surplus banks by making available a mechanism to sell their over-achievement thereby enhancing lending to the categories under the priority sector. The PSLC mechanism does not involve transfer of credit risk or underlying assets. Retail credit 2.14 Banks’ retail loan portfolios registered double-digit growth. The housing loan component which constitutes more than 54 per cent of the total retail loan portfolio of banks increased by 16.4 per cent (Chart 2.12). The personal loans component, which is the second major retail segment and consists of education loans, loans against fixed deposits, shares and bonds, among others, however, continued to witness negative growth. In comparison, the auto loan segment made a smart recovery after registering negative growth during the previous year (Chart 2.13).
Credit to sensitive sectors 2.15 Credit to sensitive sectors viz. the capital market and real estate sector accounted for around 20 per cent of the total loans and advances by SCBs. Among bank-groups, exposure of FBs to these sectors was the highest at 27.7 per cent followed by PVBs (26.3 per cent) and PSBs (16.9 per cent). Even among these two sectors, 92.5 per cent of the credit pertained to the real estate sector. During 2015-16, credit to both the sectors witnessed deceleration. (Chart 2.14). SCBs’ ownership patterns 2.16 Government of India continued to maintain more than the statutory minimum shareholding of 51 per cent in all PSBs. The maximum non-resident shareholding during the year among PSBs2 was 11.9 per cent as against 72.7 per cent in the case of PVBs3. However, as the government has allowed PSBs to raise capital from markets through the follow-on public offer (FPO) or qualified institutional placement (QIP) by diluting the government’s holding up to 52 per cent in a phased manner based on their capital requirements, their stock performance and liquidity and market conditions, the government shareholding in some of the PSBs is expected to come down. Regional rural banks 2.17 As at end-March 2016, there were 56 regional rural banks (RRBs) in the country with 45 sustainable RRBs, i.e., earning profits and carrying no accumulated losses. Assets/liabilities of RRBs increased by 8.4 per cent during the year. On the asset side, loans and advances witnessed a growth of 14.6 per cent against 22.9 per cent in the previous year, while investments improved by 3.6 per cent against an increase of 10.0 per cent during the corresponding period. On the liability side, deposits witnessed a marginal increase in growth to 14.8 per cent as against 14.0 per cent in the previous year, while borrowings declined by 19.4 per cent vis-a-vis a 28.0 per cent increase in the previous year. 2.18 During 2015-16, both interest income and interest expended witnessed lower growth as compared to the previous year. Interest expended increased by 14.6 per cent against 11.1 per cent increase in interest income. This led to a marginal decline in NIM. Further, provisions and contingencies increased by 71.0 per cent largely on account of deteriorating asset quality. These factors led to a decline in the overall net profits of RRBs by 26.5 per cent as against a 1.9 per cent increase during the previous year (Chart 2.15). Local area banks 2.19 There were four local area banks (LABs) at the end of March 2016. However, this number reduced to three with the Capital Local Area Bank transforming into a small finance bank w.e.f. April 24, 2016. These banks witnessed a growth of 19.6 per cent in assets with their net interest incomes growing by 13.3 per cent during 2015-16. However, their net profits declined by 4.0 per cent resulting in a decline in RoA (Chart 2.16). As the assets of the erstwhile Capital Local Area Bank Ltd. constituted over 74 per cent of the assets of all LABs, the significance of LABs as a bank-group has diminished further. Customer services 2.20 During 2015-16, 95,377 complaints were received against SCBs by 15 regional offices of the Banking Ombudsman as against 85,131 during the previous year. PSBs witnessed a marginal decline in the share of complaints received at Banking Ombudsman Offices to 68.2 per cent from 70.5 per cent in the previous year. PVBs’ share of the complaints increased during this period (Chart 2.17). Population group-wise, urban and metropolitan centres received a majority of the complaints (73 per cent of the total complaints in 2015-16) under the Banking Ombudsman scheme (Chart 2.18).
Growth in ATMs 2.21 The geographic reach of ATMs increased further as the number of ATMs installed increased to around 0.2 million as at end March 2016, an increase of 9.7 per cent over the previous year. PSBs maintained more than a 70 per cent share in the total number of ATMs. FBs, however, continued to post a decline in the number of ATMs (Chart 2.19). Distribution of ATMs 2.22 Regional distribution of ATMs became more balanced with the share of metropolitan, urban and semi-urban centres in total installed ATMs varying between 26.0 per cent and 29.0 per cent. However, metropolitan centres witnessed a marginal decline in the share of ATMs to 26.9 per cent in March 2016 from 27.7 per cent during the previous year. Semi-urban and urban centres registered a marginal increase in their share of ATMs (Chart 2.20). Off-site ATMs 2.23 More than 60 per cent of the PVB and FB ATMs are off-site ATMs which are set up on a standalone basis and not on the premises of a bank’s branches. However, in case of PSBs the share of off-site ATMs is less than 45 per cent. During 2015-16, the share of off-site ATMs in total ATMs declined in every bank-group (Chart 2.21). Given that the Reserve Bank has allowed banks to offer all their products and services through the ATM channel, a decline in the share of off-site ATMs is a disquieting development. White label ATMs 2.24 During 2015-16 the number of white label ATMs (WLAs), which are owned and operated by non-bank entities, increased significantly to 12,962 from 7,881 during the previous year. This spurt in WLAs can be attributed to the entry of new players in the banking space such as payments banks and small finance banks which are collaborating with WLA operators rather than having their own ATMs to minimise costs. Debit and credit cards 2.25 Growth in the number of outstanding debit cards decelerated sharply to 19.6 per cent in 2015-16 from 40.3 per cent in the previous year. During 2014-15, the spurt in debit card growth was attributed to the Pradhan Mantri Jan Dhan Yojana (PMJDY) under which every account holder under the scheme was issued a RuPay debit card. As the growth in account opening under PMJDY decelerated, this resulted in a decline in the growth of debit card issuances. However, credit cards registered increased growth of 16.1 per cent during the year as against 10.1 per cent during 2014-15 (Chart 2.22). Bank group-wise, PSBs maintained a strong lead in issuance of debit cards with a share of 82.8 per cent. On the other hand, PVBs had a dominant position in credit card issuances with a share of 60.1 per cent (Chart 2.23).
Prepaid payment instruments 2.26 Due to greater use of prepaid payment instruments (PPIs) for purchase of goods and services and for fund transfers, the value of transactions by these instruments has increased considerably in recent years. Among the prepaid instruments, PPI cards (which include mobile prepaid instruments, gift cards, social benefit cards, foreign travel cards and corporate cards) remained the most popular mode followed by mobile-wallets. During 2015-16, the value of transactions through PPI cards and mobile-wallets increased significantly to ₹254 billion and ₹206 billion respectively, against ₹105 billion and ₹82 billion respectively in the previous year (Chart 2.24).
|