| Press Release RBI Working Paper Series No. 11
Non Deliverable Forward and Onshore Indian Rupee Market:
A Study on Inter-linkages
@Rajan Goyal, Rajeev Jain and Soumasree Tewari Abstract 1The study examines the inter-linkages of onshore segments of India’s foreign exchange market with Non-Deliverable Forwards (NDF) market for Indian rupee (INR) for a sample period of June 6, 2006 to April 3, 2013. The study period is divided into four sub-periods based on appreciating/depreciating trend in INR. To examine the direction of transmission between onshore and NDF markets, vector error correction model (VECM) and ARCH/GARCH models are used. Analysis shows that there exists a long term relationship between onshore and NDF markets and relationship is bidirectional as both markets adjusts to any deviation from equilibrium state. However, bidirectional relationship turns unidirectional from NDF to onshore during the period when rupee comes under downward pressure. ARCH/GARCH models also confirm broadly the same dynamics of inter-relationship through cross-mean and volatility spillover between NDF and onshore markets. While both mean and volatility spillover from NDF market to onshore market and onshore to NDF market are found to be statistically significant during period of rupee appreciation, the volatility spillover turns unidirectional from NDF to onshore market during period of rupee depreciation. In short, even though both onshore and offshore segments follow an equilibrium relationship in the long-run, movements in NDF market seem to drive adjustment in onshore market when rupee faces downward pressure. JEL Classification : C5, F31 Keywords : Non-deliverable forward; Spillover effect; ARCH/GARCH Model I. Introduction Non-Deliverable Forwards (NDF) are foreign exchange forward contracts traded in the over-the-counter market at offshore destinations, generally major international financial centres. An NDF contract is similar to a regular forward foreign exchange contract but does not need physical delivery of currencies at the time of maturity. In fact, NDF contract is typically cash settled in international currency on a specified future date. Since the NDF market operates in overseas financial centres, it remains outside the regulatory purview of the local authorities. An NDF market generally grows when the onshore forward market is either under-developed or its access for market participants is restricted. NDF markets allow market agents, facing regulatory restrictions in the onshore market, to hedge their exposures and speculators to take a position on future movements in domestic currency. In fact, as market players’ interest grows in a particular currency with convertible restrictions, NDF market generally gains momentum in overseas financial centres (Hutchison et al., 2009). Further, growing trade and financial openness across countries, especially emerging market economies, is another major factor behind the growing size of NDF markets. The major participants in NDF market could include: (i) foreign investors, doing business in countries with exchange controls, undertake forward contracts in the offshore markets to hedge currency risk, (ii) entities like hedge funds, commercial and investment banks, currency speculators taking positions in the NDF market and (iii) participants, with access to both onshore and offshore forward markets, may also be operating in the NDF markets to gain from exchange rate differential of a currency pair the domestic and offshore markets. Another reason for growing NDF currency markets could be that carry trades for currencies with NDF contracts perform better compared to carry trades for currencies with deliverable forward contracts as empirically found by Doukas and Zhang (2013). Experience shows that NDF market is generally more active when movements in exchange rate are uncertain and market players expect significant adjustment in the local currency exchange rate regime. For instance, leading up to the Asian crisis of 1997, interest in NDF trading had increased significantly, as devaluation in local currencies was widely expected in the market. Countries whose currencies are actively traded in the offshore NDF market are Argentina, Brazil, Chile, China, Guatemala, Indonesia, India, Columbia, Korea, Malaysia, Philippines, Peru, Russia, Taiwan, Venezuela and Vietnam. Theoretically, standard onshore forward exchange contracts are priced based on interest rate parity calculations (interest rate differential and current spot exchange rate) while many other factors such as volume of trade flows, liquidity conditions, and counterparty risk can also determine the pricing. Besides these factors, NDF prices can also be affected by the likely changes in foreign exchange regime, speculative positioning, conditions in local onshore interest rate markets and dynamic inter-linkages between offshore and onshore currency forward markets (Lipscomb, 2005). Moreover, NDF could argued to be useful tool for gauging market expectations on a currency relevant for its pricing as supply and demand factors may not get fully manifested in onshore pricing of local currency in a country with capital controls. The need to examine the issue of market interlinkages arises from the fact that there is a lack of enough evidence in the context of India how NDF markets relates to onshore currency market. Although a few studies have been undertaken, these are not only mostly dated, but also do not provide conclusive evidence. Further, recently, following the LIBOR rigging scandal, concerns have also been raised with regard to transparency in operations in NDF contracts in overseas markets. It was perceived that entities interested in local currency could have attempted to influence spot rates in order to make gain while settling NDFs carried on their books (Okongwu and Bruegger, 2012). In fact, recognising the possibility of manipulation in NDF rates, the Monetary Authority of Singapore directed its banks to review procedures being followed for setting the foreign-exchange rates while settling certain currency forward contracts. Such concerns seem to pre-suppose that NDF markets can be used to drive onshore currency markets. From this perspective as well, studying spill-over from NDF to onshore currency markets (and vice versa) becomes important. Against this backdrop, an attempt is made to examine whether there is any spill-over effect from NDF market of INR to its spot and forward counterparts and vice versa. Accordingly, the study has been organised into four sections (including introductory section). The section II of the study deals with the review of literature summarising major studies examining inter-linkages between offshore and onshore currency markets. The section III discusses data sources and methodology to be used and also presents major findings of the study. Section IV provides concluding observations. II. Review of Literature In literature, the flow of information from one market to another has been studied extensively as volatility transmission across various segments of financial markets is an important policy issue from the financial stability perspective. Such studies have focused mainly on spillovers within equity, fixed income segment and foreign exchange markets. However, the inter-linkage between offshore NDF market and onshore spot segment of foreign exchange markets has not been studied much in the economic and financial literature. This is notwithstanding a phenomenal growth in NDF segments over the years. According to a Report prepared by London School of Economics (LSE) (December 2012), the average daily UK trading volume in NDFs in the four BRIC currencies, viz., Brazilian real, Russian rouble, Indian rupee and Chinese renminbi has grown by nearly 70 per cent from just over US$ 11 billion in April 2008 to almost US$ 20 billion in April 2012. Since NDF is over-the-counter in offshore market, data availability could be one of the issues for limited number of studies on the subject. These studies have generally tried to examine interlinkages between onshore and off shore markets and assessed the size and direction of causality between the two. Findings of these studies are largely mixed. While examining the impact of financial deregulation on relationship between onshore and offshore market of Korean won, Park (2001) finds that the interrelationship is dynamic and changes with the extent of deregulation in the foreign exchange market and liberalisation of capital flows. He argues that in the Korean economy with a managed float exchange rate and restriction on capital flows, movements in the domestic spot market influenced the NDF market. This was reversed as exchange rate policy was shifted to free float and capital flow restrictions were reduced. The domestic market was mainly driven by offshore NDF market where price innovations originated. A similar study by Wang et al (2007) shows that the NDF market seems to be the driver for the domestic spot market of Korean won, while for Taiwanese dollar, it is the spot market which contains more information and influences the NDF market. Ma et al (2004) provide evidence that volatility in NDF currency rates has been higher than that in local spot markets for six Asian currencies, viz., Chinese renminbi, Indian rupee, Indonesian rupiah, Korean won, Philippine peso and New Taiwan dollar. Although the NDF markets may be posing challenges for local policymakers, these markets could facilitate development of local bond markets in Asia by enabling offshore bond investors to hedge currency risk. A study on the Indonesian currency and US dollar by Cadarajat and Lubis (2012) shows that NDF market tends to influence the return on the domestic spot and forward market. Examining the NDF markets for Chinese and six Asian Pacific counterpart currencies, Colavecchio et al. (2006) reveal that the Chinese NDF seems to be a major driver for the other currency markets in Asia. The extent of co-movement, however, is heterogeneous which is mainly influenced by real and financial integration. Lipscomb (2005) views the rates in NDF market to be a useful tool for market monitoring as these reflect market expectations and supply and demand factors which otherwise may not be fully manifested in onshore currency markets with capital controls. He further argued that since the convertibility restrictions for currencies of countries with significant foreign investor involvement are likely to stay, a global NDF market is likely to continue. In the Indian context, there are only a few studies on the subject. A study by Misra and Behera (2006) shows that for India, it is the onshore spot and forward prices that influence the NDF market prices and not the other way round mainly because of the restricted participation of domestic players in the offshore market. The returns in the NDF market are mainly driven by the information flows in the Indian spot market and forward market. However, the sample period of this study was November 2004 to February 2007 during which rupee was relatively stable. In a subsequent study based on November 2000 to November 2009 period, Behera (2011) finds the evidence of greater volatility spillover from NDF to spot market since the period of introduction of currency futures in India. Another study covering a period of 2007 to 2009 by Guru (2009) also finds somewhat similar evidence on interdependencies between the NDF and onshore segments (spot and forward) of rupee market. She argues that dynamics of relationship between onshore and offshore markets has undergone a change with the introduction of the currency future market in 2008 and returns in NDF market seem to be influencing the domestic spot as well as forward market. A study by Darbha (2012) finds that offshore markets are important in price discovery process, particularly in India and China. Concluding that NDF markets do have significant impact on onshore markets, he further emphasises that until full capital convertibility is achieved, NDF market rates and activity are important information signal and thus need to be monitored by investors and regulators. The above discussion suggests that most of the studies on NDF markets have attempted to examine the impact on local markets. There is ample evidence, particularly from more recent studies, that NDF markets do influence onshore markets. While NDF market may be a risk management avenue for those entities having exposure to local currencies which are not fully convertible on capital account, its role as market monitoring tool is also emphasised in literature. Against this backdrop, this paper attempts to examine the dynamics of relationship between NDF market and onshore segments of rupee market. III. Relationship between Onshore and Offshore NDF INR markets: Data Sources, Methodology and Empirical Analysis There are two major offshore markets for Indian rupee, viz., Singapore and London. Probably owing to difference in trading hours, there is a possibility that impact of/on these markets on/of Indian market may vary. Since, time series volume data are not available, it is not clear which of the two markets are more important. While a study conducted by London School of Economics claims London as the major centre hosting Rupee NDF market, other studies believe that Singapore market is more prominent. For instance, Hutchison et al (2009) suggest “the Indian rupee NDF market is most active in Singapore and Hong Kong, though there is also trading in places such as Dubai”. In order to ascertain linkages, we have attempted an exercise to examine interlinkages between NDF and onshore markets which may vary depending upon the market conditions. Probably, during the period of rupee depreciation, the dynamics of interlinkages between these markets might be different from appreciating phase. Thus, for empirical purpose, we have analysed 4 sub-periods capturing different phases (appreciation and depreciation) in the foreign exchange market. In general, rupee shows more volatility during period of depreciation (Chart 1 and Table 1).
| Table 1: Various Phases of Trend in Rupee Exchange Rate | | Period 1: | June 6, 2006 to January 2008 | Appreciation | Prior to Global financial crisis | | Period 2: | January 2008 to March 2009 | Depreciation | Global financial crisis | | Period 3: | March 2009 to August 2011 | Appreciation | Recovery from global crisis | | Period 4: | August 2011 to April 3, 2013 | Depreciation | Post US rating downgrade | Data and Methodology Daily data on NDF market represents the WM/Reuters Closing Non-Deliverable Forward Rates. WM/Reuters database provides NDF rates based on information from specific sources and locations in European and Asian regions. Data on closing INR spot rate is also sourced from the Reuters. Augmented Dickey Fuller (ADF) tests are used to verify the presence of unit root in series on INR spot, INR forward and IND NDF rate. In addition, Johansen cointegration test is performed to check the long-run relationship between onshore and NDF rates. Various lag length criteria based on vector autoregression (VAR) model are used for selecting the lag length for Johansen test. After confirming long-term relationship, the paper uses vector error correction (VEC) model for finding causal relation between onshore and offshore NDF rates. The VEC has cointegration relations built into the specification under which long-run components of the variables follow equilibrium constraints while the short-run components have a flexible dynamic specification. Further, considering the fact that financial variables such as exchange rate quite often exhibit ‘volatility clustering’, i.e., varying amplitude of returns over time as some periods are riskier than others, findings based on the VEC model are corroborated through ARCH/GARCH models. ARCH/GARCH models are extensively used for modelling and forecasting volatility in financial data series. In order to analyze the NDF market sentiment on the spot market and vice versa, we propose a GARCH (1,1) model, which takes the following form: The simplest GARCH (1, 1) specification as developed by Bollerslev (1986) and Taylor (1986) can be written as: Empirical Results As stated earlier, as a first step towards ascertaining relationship between onshore and offshore NDF market based on daily data, stationarity properties of data are checked (results are presented at Annex). ADF test reveals that all the INR exchange rate series viz., spot, 1-month forward and NDF market are non-stationary and are integrated of order 1. Thus, the series are tested for the presence of co-integrating relationship between them. In fact, a priori, it was expected that both onshore and offshore markets should be co-integrated since they are prices for the same asset (in our case INR) at different points in time though at different locations and therefore, might be affected in very similar ways by given pieces of information. The co-integration test confirms presence of long term relationship between onshore and offshore INR markets. Since the presence of co-integrating relationship also implies existence of at least unidirectional causation between the variables, we examine the direction of relationship in the following ECM framework. It implies that information flow from offshore NDF market to onshore foreign exchange market becomes more important for movements in both spot and forward segments. To get an idea on the nature of spillovers across both markets, ARCH/GARCH estimation is also undertaken. In fact the distribution properties of data as shown in Table 3 indicate that the currency series are skewed and leptokurtic with respect to the normal distribution. The Jacque–Bera normality test rejects the null hypothesis of a normal distribution while the Ljung–Box Q (10 lags) statistics for serial correlation of the spot, forward and NDF rate changes are statistically significant implying the presence of serial correlation. To address this issue, the spot and NDF processes need to be estimated in a manner, which allows for higher moving average processes to be estimated. The L–B Q2 (10 lags) statistics for all the three series are also statistically significant, confirming the presence of non-linear dependency in the squared series. This suggests the presence of autoregressive conditional heteroskedasticity, i.e., volatility clustering, which can be properly specified by the ARCH or GARCH models. | Table 3: Distribution Properties of INR Spot, Forward and NDF Rates | | Variable | Mean | SD | Skewness | Kurtosis | J-B statistics | LB Q(10) | LBQ2(10) | | DSPOT | 0.005 | 0.23 | 0.01 | 6.8 | 1085.4 (0.00) | 33.7
(0.00) | 222.8 (0.00) | | DFWD | 0.005 | 0.32 | -0.16 | 20.0 | 2141.0 (0.00) | 22.6
(0.01) | 356.6 (0.00) | | DNDF | 0.005 | 0.23 | -0.02 | 7.0 | 1176.0 (0.00) | 38.0
(0.00) | 235.6 (0.00) | | P-values are in parentheses rejecting the null hypothesis that most serial correlations up to lag 10 are jointly zero. | Further studying the dynamics of mean and volatility spill-over effect across markets, the augmented GARCH (1,1) model between the onshore and offshore markets based on the four sub-sample periods is estimated. The augmented GARCH model of the following form was adopted from Hamao et al (1990), Park (2001) and Cadarajat and Lubis (2012): 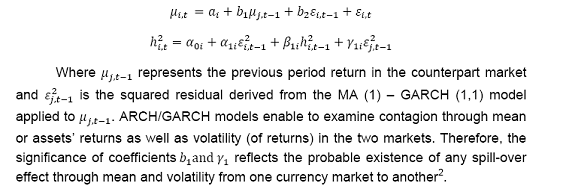 GARCH models also suggest bidirectional spillovers, either through mean or volatility or both, between onshore and offshore markets during sub-periods 1 and 3. However for sub-period representing the period of global financial crisis (Sub-period 2) and post-August 2011 (sub-period 4) when rupee came under downward pressure , there is an evidence of unidirectional volatility spill-over from NDF to onshore market while the same from spot to NDF is not found to be statistically significant (Table 4 and 5). To sum up, during the period of depreciation in foreign exchange market, shock originated in the NDF market seems to carry more information which gets reflected in onshore segments of market through mean and volatility spillovers. The GARCH (1,1) specification seems appropriate for the conditional variance equation, as the coefficients satisfy the required restrictions. It may be noted that the volatility persistence exists in all segments of INR market (i.e., spot, NDF and forward) for all sub-periods. | Table 4: Mean and Volatility Spillover between Spot and NDF Market for INR | | Period | Variables | ARCH/GARCH (1, 1) Model | | Mean Equation | Variance equation | | Dependent | Independent | b1 | γ1 | | Sub period 1: | µi =Spot | µj=NDF | 0.29
(6.0)* | 0.03
(2.9)* | | µi =NDF | µj=Spot | 0.14
(2.5)* | 0.04
(0.4) | | Sub-period 2: | µii = Spot | µj=NDF | 0.20
(2.6)* | 0.17
(3.6)* | | µii =NDF | µj=Spot | 0.25
(1.9) | 0.07
(1.2) | | Sub-period 3: | µii = Spot | µj=NDF | 0.59
(10.9)* | 0.07
(3.9)* | | µii =NDF | µj=Spot | 0.14
(1.8) | 0.05
(2.0)* | | Sub-period 4: | µii = Spot | µj=NDF | 0.63
(9.0)* | 0.05
(2.5)* | | µii =NDF | µj=Spot | 0.01
(0.1) | 0.08
(0.9) | | * Statistically significant at least at 5 per cent. |
Table 5: Mean and Volatility Spillovers between Onshore Forward
and NDF Market for INR | | Period | Variables | ARCH/GARCH (1, 1) Model | | Mean Equation | Variance equation | | Dependent | Independent | b1 | γ1 | | Sub period 1: | µi =FW | µj=NDF | 0.39
(7.6)* | 0.05
(2.4)* | | µi =NDF | µj=FW | 0.14
(3.0)* | 0.09
(0.7) | | Sub-period 2: | µi = FW | µj=NDF | 0.24
(3.2)* | 0.16
(3.4)* | | µi =NDF | µj=FW | 0.21
(1.5) | 0.08
(1.2) | | Sub-period 3: | µi = FW | µj=NDF | 0.61
(12.6)* | 0.05
(2.6)* | | µi =NDF | µj=FW | 0.19
(2.5)* | 0.04)
(0.9) | | Sub-period 4: | µi = FW | µj=NDF | 0.59
(8.0)* | 0.05
(3.1)* | | µi =NDF | µj=FW | 0.06
(0.6) | 0.11
(1.5) | | * : Statistically significant at least at 5 per cent. | IV. Concluding Observations In the study, dynamics of transmission between onshore and offshore rupee markets was examined using VECM and ARCH/GARCH models. Since co-integration analysis suggests that there exists a long term relationship between spot/forward and NDF markets for INR, it can be inferred that these markets co-move in the long-run. However, there is considerable difference in terms of direction of relationship within the full sample period. Differential behaviour is discernible in terms of adjustment behaviour exhibited by both markets depending on extant market conditions. During the period of rupee depreciation, only spot and forward markets seem to be responding to deviation from long-term equilibrium while in the period of rupee appreciation, both onshore as well as offshore markets show adjustment towards long-term equilibrium. Bidirectional relationship between onshore and offshore markets during period of rupee appreciation, in terms of mean and volatility transmission, is also corroborated by ARCH/GARCH models. However, mean and volatility spillover are observed to be broadly unidirectional from NDF to spot and forward market for INR during phase of depreciation. Such asymmetric behaviour of spot/forward and NDF markets could be attributed to the fact that during period of rupee depreciation when markets are relatively more volatile, the Reserve Bank tries to contain volatility in foreign exchange market by undertaking certain measures. For instance, in December 2011, when rupee came under considerable stress, the Reserve Bank, under contracted exposures, forward contracts, involving the Rupee as one of the currencies, withdrew the facility of cancellation and rebooking of forward contracts by residents. However, in July 2012, exporters were allowed to cancel and rebook forward contracts to the extent of 25 percent of the contracts booked in a financial year. Similarly, eligibility limit under probable exposures based on past performance reduced to 25 per cent of past 3 years’ average exports/imports or previous year’s actual export/import, whichever is higher (from average of past 3 years or actual, w.e.h). It was also decided that all forward contracts booked by the FIIs to hedge currency risk, once cancelled, cannot be rebooked. Earlier they were allowed to the extent of 10 per cent of the market value of the portfolio as at the beginning of the financial year. Such measures constrain ability of market players to undertake forward contracts in domestic forex market and might be leading domestic entities to take on such forward contracts in overseas markets thereby resulting in higher volume in NDF market. Thus, with increasing depth of NDF market, rupee is likely to become more prone to shocks emanating from overseas markets as results indicate.
References: Behera, Harendra Kumar (2011), “Onshore and offshore market for Indian rupee: recent evidence on volatility and shock spillover”, Macroeconomics and Finance in Emerging Market Economies, Vol. 4, No. 1, March 2011, pp. 43–55 Bollerslev, T. (1986), “Generalised Autoregressive Conditional Heteroskedasticity”, Journal of Econometrics, 31, 307 - 327. Cadarajat, Yayat and Lubis, Alexander (2012), “Offshore And Onshore IDR Market: An Evidence On Information Spillover”, Bulletin of Monetary Economics and Banking, April 2012. Colavecchio Roberta and Funke Michael (2006), “Volatility transmissions between renminbi and Asia-Pacific onshore and offshore U.S. dollar futures”, BOFIT Discussion Papers, Bank of Finland, Institute for Economies in Transition, No.16 Darbha, Gangadhar (2012), “A Tale of One Asset and Two Markets – Analysis of Dynamic Interactions between On- and - Off Shore Markets”, macrofinance.nipfp.org.in/PDF/13-11sl_Darbha_NDFNimrana.pdf. Engle, Robert (2001), “GARCH 101: The Use of ARCH/GARCH Models in Applied Econometrics”. Journal of Economic Perspectives, Vol. 15, No. 4, pp. 157–168. Guru, Anuradha (2009), “Non-Deliverable Forwards Market for Indian Rupee: An Empirical Study”, Indian Journal of Economics and Business, Vol. 8, No. 2, pp. 245-260. Hamao, Yasushi; Ronald W. Masulis and Victor Ng (1990), “Correlations in Price Changes and Volatility across International Stock Markets” Review of Financial Studies, Vol. 3, No. 2, pp. 281-307. Hutchison, Michael; Jake Kendall, Gurnain Pasricha, Nirvikar Singh (2009), “Indian Capital Control Liberalisation: Evidence from NDF Markets” NIPFP Working Paper No. 2009/60. Lipscomb, Laura (2005), “An Overview of Non-Deliverable Foreign Exchange Forward Markets”, Federal Reserve Bank of New York, May. London School of Economics (2012), BRIC currencies trading in London, Special Interest Paper, prepared for the City of London Corporation by London School of Economics and Political Science, December. Ma, Guonan, Corrinne Ho and Robert N McCauley (2004), “The markets for non-deliverable forwards in Asian currencies” BIS Quarterly Review, June. Misra, Sangita and Behera, Harendra (2006), “Non Deliverable Foreign Exchange Forward Market: An Overview”, RBI Occasional Papers, Vol 27, No.3. Okongwu,Chudozie and Esther Bruegger (2012), “At A Glance: Non-Deliverable Forward Foreign Exchange Contracts”, NERA Economic Consulting, available at http://www.nera.com/nera-files/AAG_NDFs_0213.pdf. Park, Jinwoo (2001), “Information flows between non-deliverable forwards (NDF)/and spot markets: Evidence from Korean currency”, Pacific Basin Finance Journal, Vol. 9 (4), pp.363-377. Taylor, S. (1986), Modelling Financial Time Series, John Wiley & Sons, New York. Wang Kai-Li, Fawson Christopher and Chen Mei-Ling (2007), “Information Flows among Exchange Rate Markets: What Do We Learn From Non-Deliverable Forward Markets in Asia?” Chaoyang University of Technology, October, available at http://www.cyut.edu.tw/~finance/docs/1030-2.pdf.
Annexure | Table A1: Augmented Dickey Fuller test results in level | | Null Hypothesis | t-Statistic | Prob.* | | LINSP has a unit root | -0.498829 | 0.8890 | | LNDF has a unit root | -0.901715 | 0.7882 | | LINFWD has a unit root | -0.464743 | 0.8954 | | *MacKinnon (1996) one-sided p-values. |
| Table A2: Augmented Dickey Fuller test results in first difference | | Null Hypothesis | t-Statistic | Prob.* | | DLSP has a unit root | -39.51982 | 0.0000 | | DLNDF has a unit root | -45.74828 | 0.0001 | | DLFWD has a unit root | -39.44568 | 0.0000 | | *MacKinnon (1996) one-sided p-values. | |