Against the backdrop of a slowdown in the domestic economy and tepid global recovery, the growth of the Indian banking sector slowed down for the second consecutive year in 2012-13. There was also a decline in the growth of profits of scheduled commercial banks (SCBs) as credit off-take slowed down and interest rates softened. The asset quality also deteriorated, more perceptibly for public sector banks. On the positive side, capital positions of Indian banks, including public sector banks, remained strong and above the stipulated minimum to face any unforeseen losses. There was also a significant expansion in the outreach of banking in unbanked rural centres, as financial inclusion plans completed three years. In the short-term, the Indian banking sector needs to lend support to productive sectors facilitating economic recovery, while remaining vigilant about asset quality. In the medium to long-term, sustained improvements in efficiency and inclusiveness remain key areas of concern.
1. Introduction
4.1 The Indian financial landscape is dominated by the banking sector with banking flows accounting for over half of the total financial flows in the economy1. Banks play a major role in not just purveying credit to the productive sectors of the economy but also as facilitators of financial inclusion. Although the Indian banking sector exhibited considerable resilience in the immediate aftermath of the global financial crisis, it has been impacted by the global and domestic economic slowdown over the last two years. The year 2011-12, against the backdrop of a muted domestic growth, witnessed a slowdown in the overall growth of the banking sector coupled with a deterioration in asset quality and lower profitability2. The performance of the banking sector in 2012-13 too was conditioned by a further slowdown of the domestic economy, although there was some respite from inflationary pressures leading to an environment of lower interest rates.
4.2 Against this backdrop, this chapter discusses developments in the Indian banking sector in 2012-13 in a comparative perspective with the earlier year/s to bring out trends in balance sheets, profitability, and financial soundness of the sector taking data on 89 scheduled commercial banks (SCBs)3. The chapter also spells out key issues relating to other aspects of operations of SCBs, viz., sectoral distribution of credit, financial inclusion, customer services, technological developments, and their overseas operations apart from separately analysing the trends in two segments closely related to the SCB sector, namely regional rural banks (RRBs) and local area banks (LABs).
2. Balance Sheet Operations of Scheduled Commercial Banks
Moderation in balance sheet growth for the second consecutive year, led by a slowing down of credit growth
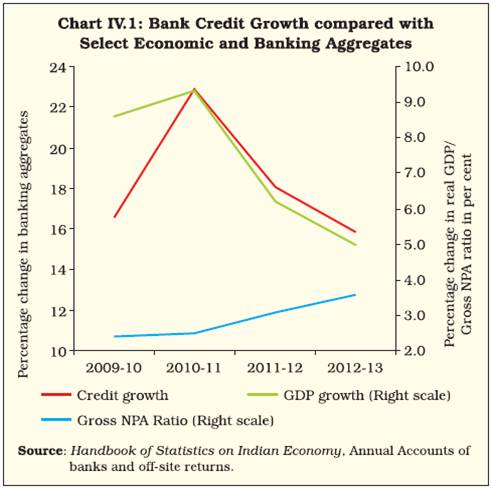
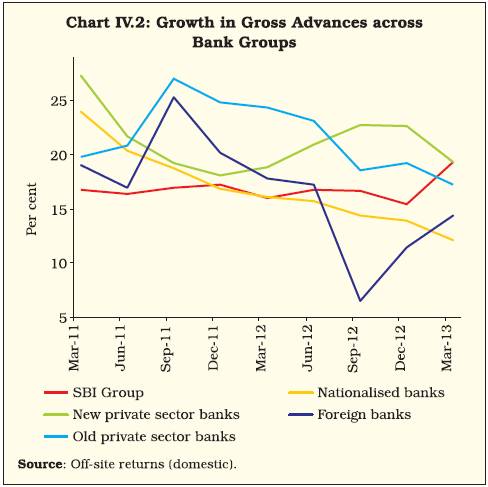
4.3 In continuation with the trend during 2011-12, the overall growth in balance sheet of banks moderated further in 2012-13 (Table IV.1; Appendix Table IV.1). The major source of this moderation was bank credit. The moderation in credit growth was partly reflective of the slowdown in real economic activity coupled with increasing risk aversion by banks (Chart IV.1). The slowdown in credit growth in March 2013 over March 2012 could be seen across all bank groups except the SBI Group (Chart IV.2)4.
Table IV.1: Growth in Balance Sheet of Scheduled Commercial Banks |
(Per cent) |
Item |
Public sector banks |
Private sector banks |
Old private sector banks |
New private sector banks |
Foreign banks |
All scheduled commercial banks |
2011-12 |
2012-13 |
2011-12 |
2012-13 |
2011-12 |
2012-13 |
2011-12 |
2012-13 |
2011-12 |
2012-13 |
2011-12 |
2012-13 |
1 |
2 |
3 |
4 |
5 |
6 |
7 |
8 |
9 |
10 |
11 |
12 |
13 |
1. Capital |
-4.2 |
4.3 |
- |
4.5 |
-4.2 |
6.1 |
1.7 |
3.9 |
15.6 |
13.9 |
8.0 |
10.4 |
2. Reserves and Surplus |
24.4 |
15.5 |
15.5 |
21.6 |
18.5 |
18.9 |
14.9 |
22.2 |
15.6 |
15.2 |
20.8 |
17.2 |
3. Deposits |
14.4 |
14.9 |
17.1 |
18.8 |
19.6 |
18.4 |
16.3 |
19.0 |
15.1 |
4.0 |
14.9 |
15.1 |
3.1. Demand Deposits |
-6.3 |
16.8 |
4.4 |
15.4 |
6.5 |
15.6 |
4.0 |
15.4 |
9.9 |
-7.8 |
-1.8 |
13.3 |
3.2. Savings Bank Deposits |
12.1 |
14.4 |
19.1 |
19.3 |
16.3 |
14.9 |
19.9 |
20.5 |
5.6 |
2.9 |
13.1 |
15.0 |
3.3. Term Deposits |
18.2 |
14.8 |
19.7 |
19.4 |
22.1 |
19.5 |
18.6 |
19.4 |
21.0 |
10.4 |
18.6 |
15.4 |
4. Borrowings |
17.2 |
19.8 |
38.9 |
16.1 |
80.3 |
28.3 |
36.4 |
15.1 |
29.7 |
27.4 |
24.9 |
19.8 |
5. Other Liabilities and Provisions |
-7.5 |
15.4 |
42.1 |
0.2 |
12.5 |
9.6 |
47.1 |
-1.0 |
26.9 |
-25.1 |
8.6 |
2.2 |
Total Liabilities/Assets |
14.1 |
15.3 |
21.1 |
17.5 |
21.3 |
18.6 |
21.0 |
17.2 |
19.8 |
5.7 |
15.8 |
15.1 |
1. Cash and Balances with RBI |
-20.5 |
-0.2 |
-18.1 |
5.4 |
-7.9 |
-0.2 |
-20.8 |
7.1 |
14.2 |
-7.4 |
-18.5 |
0.4 |
2. Balances with Banks and Money at Call and Short Notice |
40.7 |
38.0 |
15.6 |
57.9 |
80.4 |
52.6 |
6.5 |
59.2 |
13.7 |
10.7 |
32.4 |
37.5 |
3. Investments |
12.8 |
16.7 |
24.6 |
19.0 |
18.0 |
23.0 |
26.5 |
18.0 |
21.2 |
13.7 |
16.1 |
17.0 |
3.1 Government Securities |
16.5 |
13.5 |
32.0 |
17.8 |
21.5 |
23.8 |
35.4 |
16.1 |
23.0 |
21.5 |
19.8 |
15.0 |
3.2 Other Approved Securities |
-65.1 |
-26.2 |
-78.8 |
-63.1 |
-65.0 |
-61.2 |
-97.6 |
-100.0 |
-100.0 |
- |
-65.6 |
2.9 |
3.3 Non-Approved Securities |
-2.1 |
33.3 |
12.5 |
21.4 |
10.0 |
21.2 |
13.0 |
21.4 |
17.7 |
-3.8 |
5.2 |
24.1 |
4. Loans and Advances |
17.3 |
15.4 |
21.2 |
18.3 |
24.6 |
17.3 |
20.1 |
18.6 |
17.6 |
14.7 |
18.1 |
15.9 |
4.1 Bills Purchased and Discounted |
25.7 |
20.8 |
8.2 |
7.8 |
14.7 |
-4.0 |
5.4 |
13.3 |
9.6 |
29.2 |
21.8 |
19.9 |
4.2 Cash Credits, Overdrafts, etc. |
17.8 |
16.9 |
28.4 |
28.8 |
33.3 |
25.9 |
25.4 |
30.7 |
19.7 |
14.7 |
19.3 |
18.5 |
4.3 Term Loans |
16.1 |
13.5 |
19.0 |
14.2 |
17.6 |
10.6 |
19.3 |
14.9 |
17.5 |
10.7 |
16.8 |
13.6 |
5. Fixed Assets |
5.9 |
11.2 |
3.0 |
8.3 |
6.9 |
14.9 |
2.1 |
6.6 |
1.2 |
20.4 |
4.8 |
11.3 |
6. Other Assets |
14.9 |
2.8 |
67.5 |
-7.9 |
26.9 |
8.0 |
74.5 |
-9.9 |
26.9 |
-31.0 |
27.9 |
-9.5 |
Source: Balance Sheets of respective banks. |
 Deposits growth was maintained with the help of a revival in the growth of CASA
4.4 Although there was a moderation in the balance sheet of the banking sector, deposits – the largest component on the liabilities side – maintained their growth in 2012-13, primarily with the help of a revival in the growth of current and savings accounts (CASA). Consequently, the share of CASA was maintained at around 33 per cent (Chart IV.3).
Revival in CASA was strong for new private sector banks, partly owing to improved competition in savings deposit rate
4.5 The increase in CASA growth in 2012-13 over 2011-12 was most perceptible for new private sector banks. In 2012-13, growth in CASA for new private sector banks, at 18.5 per cent, was the highest among all bank groups (Chart IV.4). In part, this could be attributed to improved competition among banks in attracting savings deposits following the deregulation of the savings deposit rate. The share of savings deposits for new private sector banks stood at around 25 per cent of their total deposit base and was the highest among all bank groups in 2013 (Chart IV.4).
Outstanding Credit-Deposit (C-D) ratio remained broadly unchanged at the aggregate level
4.6 The C-D ratio for all SCBs, on an outstanding basis, remained broadly unchanged at about 79 per cent (Chart IV.5). At the bank group-level, there was slight moderation in the outstanding C-D ratio for all major bank groups except for the SBI and foreign bank groups (Chart IV.5).
4.7 The incremental C-D ratio of SCBs posted a declining trend over a major part of 2012-13, except for a spurt in the third quarter touching 102.9 per cent in end-December 2012 (Chart IV.6).
International Liabilities and Assets of Scheduled Commercial Banks
Spurt in international liabilities of Indian SCBs in 2012-13
4.8 During 2012-13, there was a complete reversal of past trends in international liabilities and assets; while there was a spurt in international liabilities of banks located in India, international assets of these banks remained almost unchanged (Tables IV.2; IV.3). Going by the sectoral break up of consolidated claims of Indian SCBs, a shift was evident towards the private non-banking sector in 2012-13, reflective of the weak performance of the global banking sector in the recent years (Table IV.4). A shift was also discernible from the US and advanced European economies, such as the UK and Germany, towards South-East Asian economies, such as Hong Kong and Singapore, as also the UAE (Table IV.5). This could have been partly a fallout of the uncertain economic environment prevailing in most advanced economies in the period following the global financial and sovereign debt crises.
Table IV.2: International Liabilities of Banks – By Type |
(` billion) |
Liability Type |
Amount Outstanding (as
at end-March) |
Percentage Variation |
2012 |
2013 |
2011-12 |
2012-13 |
1. Deposits and Loans |
4,472 |
5,274 |
18.2 |
17.9 |
| |
(79.0) |
(77.2) |
|
|
2. Own Issues of Securities/Bonds |
56 |
58 |
23.0 |
3.1 |
| |
(1.0) |
(0.8) |
|
|
3. Other Liabilities |
1,133 |
1,503 |
-18.3 |
32.7 |
| |
(20.0) |
(22.0) |
|
|
of which: |
|
|
|
|
a) ADRs/GDRs |
271 |
393 |
-21.8 |
45.1 |
| |
(4.8) |
(5.8) |
|
|
b) Equities of banks held by non-residents |
536 |
714 |
-26.8 |
33.2 |
| |
(9.5) |
(10.4) |
|
|
c) Capital/remittable profits of foreign banks in India and other unclassified international liabilities |
326 |
396 |
5.8 |
21.4 |
| |
(5.8) |
(5.8) |
|
|
Total International Liabilities |
5,661 |
6,835 |
8.6 |
20.7 |
| |
(100.0) |
(100.0) |
|
|
Notes: 1. Figures in parentheses are percentages to total.
2. Percentage variation could be slightly different as absolute
numbers have
been rounded off to ` billion.
Source: Based on LBS (locational banking statistics) Statements. |
Table IV.3: International Assets of Banks – By Type |
(` billion) |
| |
2012 |
2013 |
2011-12 |
2012-13 |
1. Loans and Deposits |
3,410 |
3,453 |
22.3 |
1.3 |
| |
(97.3) |
(97.5) |
|
|
of which |
|
|
|
|
a) Loans to Non-Residents* |
156 |
163 |
8.1 |
4.9 |
| |
(4.4) |
(4.6) |
|
|
b) Foreign Currency Loans to Residents ** |
1,652 |
1,740 |
17.9 |
5.3 |
| |
(47.2) |
(49.1) |
|
|
c) Outstanding Export Bills drawn on Non-Residents by Residents |
725 |
791 |
18.3 |
9.1 |
| |
(20.7) |
(22.3) |
|
|
d) Nostro Balances@ |
865 |
745 |
38.7 |
-13.8 |
| |
(24.7) |
(21.0) |
|
|
2. Holdings of Debt Securities |
0.0 |
5.2 |
-100.0 |
- |
| |
(0.0) |
(0.1) |
|
|
3. Other Assets @@ |
94 |
85 |
2.9 |
-9.5 |
| |
(2.7) |
(2.4) |
|
|
Total International Assets |
3,504 |
3,544 |
21.6 |
1.1 |
| |
(100.0) |
(100.0) |
|
|
* Includes Rupee loans and foreign currency (FC) loans out of nonresident
deposits.
** Includes loans out of FCNR(B) deposits, PCFC’s, FC lending to and FC
deposits with banks in India, etc.
@ Includes placements made abroad and balances in term deposits with
non-resident banks.
@@ Capital supplied to and receivable profits from foreign
branches/
subsidiaries of Indian banks and other unclassified international
assets.
Notes: 1. Figures in parentheses are percentages to total.
2. Percentage variation could be slightly different as absolute numbers have
been rounded off to ` billion.
Source: Based on LBS (locational banking statistics) Statements. |
Table IV.4: Maturity (Residual) and Sector Classification of Consolidated International Claims of Banks |
(` billion) |
Residual Maturity/Sector |
Amount Outstanding |
Percentage Variation |
2012 |
2013 |
2011-12 |
2012-13 |
1 |
2 |
3 |
4 |
5 |
Total Consolidated International Claims |
2,809 |
3,312 |
14.0 |
17.9 |
| |
(100.0) |
(100.0) |
|
|
a) Maturity-wise |
|
|
|
|
1. Short-term (residual maturity of less than one year) |
1,832 |
2,153 |
19.0 |
17.5 |
| |
(65.2) |
(65.0) |
|
|
2. Long-term (residual maturity of one year and above) |
924 |
1,100 |
5.9 |
19.1 |
| |
(32.9) |
(33.2) |
|
|
3. Unallocated |
54 |
59 |
1.7 |
10.1 |
| |
(1.9) |
(1.8) |
|
|
b) Sector-wise |
|
|
|
|
1. Bank |
1,286 |
1,383 |
17.8 |
7.6 |
| |
(45.8) |
(41.8) |
|
|
2. Non-Bank Public |
19 |
31 |
114.1 |
66.2 |
| |
(0.7) |
(0.9) |
|
|
3. Non-Bank Private |
1,505 |
1,898 |
10.3 |
26.1 |
| |
(53.6) |
(57.3) |
|
|
Notes: 1. Figures in parentheses are percentages to total.
2. Unallocated residual maturity comprises maturity not applicable (e.g., for equities) and maturity information not available from reporting bank branches.
3. The “Bank” sector includes official monetary institutions (e.g., IFC, ECB, etc.) and central banks.
4. Prior to the quarter ended March 2005, non-bank public sector comprised of companies/institutions other than banks in which shareholding of State/Central Governments was at least 51 per cent, including State/Central Government and its departments. From the March 2005 quarter, the “Non-bank public” sector comprises only State/Central Government and its departments and, accordingly, all other entities excluding banks are classified under “Non-bank private sector”.
5. Percentage variation could be slightly different as absolute numbers have been rounded off to ` billion.
Source: Based on CBS (consolidated banking statistics) Statements -
Immediate country risk basis. |
Table IV.5: Consolidated International Claims of Banks on
Countries other than India |
(` billion) |
Country |
Amount Outstanding |
Percentage Variation |
2012 |
2013 |
2011-12 |
2012-13 |
1 |
2 |
3 |
4 |
5 |
Total Consolidated |
2,809 |
3,312 |
14.0 |
17.9 |
International Claims |
(100.0) |
(100.0) |
|
|
Of which |
|
|
|
|
1. United States of America |
643 |
676 |
17.2 |
5.2 |
| |
(22.9) |
(20.4) |
|
|
2. United Kingdom |
364 |
431 |
6.0 |
18.3 |
| |
(13.0) |
(13.0) |
|
|
3. Hong Kong |
220 |
266 |
19.5 |
20.9 |
| |
(7.8) |
(8.0) |
|
|
4. Singapore |
216 |
279 |
16.3 |
29.4 |
| |
(7.7) |
(8.4) |
|
|
5. United Arab Emirates |
221 |
277 |
42.8 |
25.1 |
| |
(7.9) |
(8.4) |
|
|
6. Germany |
118 |
136 |
-16.6 |
15.1 |
| |
(4.2) |
(4.1) |
|
|
Notes: 1. Percentage variation could be slightly different as absolute numbers have been rounded off to ` billion.
2. Figures in brackets indicate percentage share in total.
Source: Based on CBS (consolidated banking statistics) Statements - Immediate country risk basis. |
Maturity Profile of Assets and Liabilities
Gap between liabilities and assets widest in the shortest maturity bucket
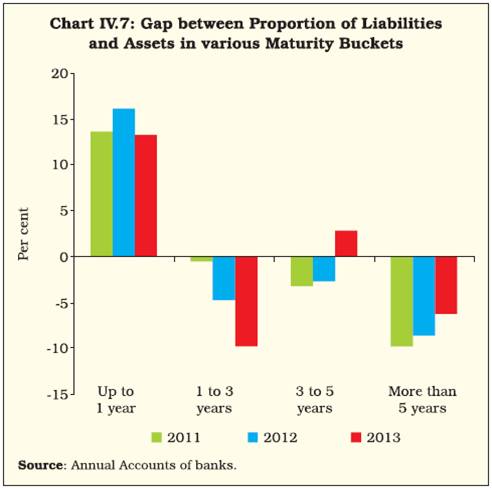
4.9 Maturity mismatch has often been highlighted as a concern for the Indian banking sector given the sector’s increased exposure to long-term infrastructural loans financed primarily from deposits of shorter maturities5. Such a mismatch can put strain on liquidity, earnings and even at times, solvency of the bank.
4.10 An aggregated analysis of the maturity profile of liabilities and assets of SCBs suggested a positive gap (liabilities-assets) in the shortest maturity bucket of up to 1 year. It was the widest when compared with other maturity buckets. This indicated greater reliance on short-term liabilities, outpacing the corresponding creation of shortterm assets. The gap was generally found to be negative for the remaining three maturity buckets, viz., 1 to 3 years, 3 to 5 years and more than 5 years. This suggested greater creation of medium/ long-term assets, which outpaced the proportion of medium/long-term liabilities (Table IV.6; Chart IV.7).
Table IV.6: Bank Group-wise Maturity Profile of Select Liabilities/Assets (As at end-March) |
(Per cent to total under each item) |
Liabilities/assets |
Public sector
banks |
Private sector
Banks |
Old private
sector banks |
New private
sector banks |
Foreign banks |
All SCBs |
2012 |
2013 |
2012 |
2013 |
2012 |
2013 |
2012 |
2013 |
2012 |
2013 |
2012 |
2013 |
1 |
2 |
3 |
4 |
5 |
6 |
7 |
8 |
9 |
10 |
11 |
12 |
13 |
I. |
Deposits |
|
|
|
|
|
|
|
|
|
|
|
|
| |
a) |
Up to 1 year |
49.6 |
33.9 |
48.7 |
46.0 |
48.1 |
48.5 |
48.9 |
45.1 |
61.9 |
62.0 |
50.0 |
35.6 |
| |
b) |
Over 1 year and up to 3 years |
25.3 |
31.3 |
30.0 |
27.4 |
39.2 |
37.5 |
26.6 |
23.7 |
29.8 |
28.9 |
26.3 |
30.9 |
| |
c) |
Over 3 years and up to 5 years |
8.5 |
15.9 |
5.7 |
9.1 |
6.9 |
7.4 |
5.2 |
9.7 |
8.3 |
9.0 |
8.0 |
15.1 |
| |
d) |
Over 5 years |
16.6 |
18.9 |
15.7 |
17.5 |
5.8 |
6.6 |
19.3 |
21.5 |
0.1 |
0.1 |
15.7 |
18.4 |
II. |
Borrowings |
|
|
|
|
|
|
|
|
|
|
|
|
| |
a) |
Up to 1 year |
45.4 |
55.6 |
50.3 |
45.9 |
63.7 |
66.2 |
49.2 |
44.0 |
84.5 |
89.5 |
52.6 |
57.0 |
| |
b) |
Over 1 year and up to 3 years |
12.2 |
11.8 |
11.8 |
14.4 |
13.4 |
14.5 |
11.7 |
14.4 |
9.2 |
6.0 |
11.7 |
11.8 |
| |
c) |
Over 3 years and up to 5 years |
15.2 |
9.8 |
12.5 |
14.0 |
7.8 |
8.6 |
12.9 |
14.5 |
2.7 |
2.7 |
12.5 |
9.9 |
| |
d) |
Over 5 years |
27.2 |
22.9 |
25.4 |
25.7 |
15.1 |
10.6 |
26.2 |
27.0 |
3.5 |
1.8 |
23.2 |
21.3 |
III. |
Loans and Advances |
|
|
|
|
|
|
|
|
|
|
|
|
| |
a) |
Up to 1 year |
34.3 |
23.8 |
35.2 |
35.0 |
44.0 |
45.8 |
32.4 |
31.7 |
67.2 |
65.1 |
35.9 |
25.8 |
| |
b) |
Over 1 year and up to 3 years |
37.4 |
49.8 |
37.1 |
36.8 |
36.1 |
34.2 |
37.4 |
37.7 |
15.5 |
17.7 |
36.3 |
47.8 |
| |
c) |
Over 3 years and up to 5 years |
11.0 |
8.2 |
11.3 |
11.7 |
9.1 |
9.6 |
12.0 |
12.3 |
4.8 |
6.3 |
10.8 |
8.5 |
| |
d) |
Over 5 years |
17.3 |
18.1 |
16.4 |
16.5 |
10.8 |
10.4 |
18.2 |
18.4 |
12.5 |
10.8 |
17.0 |
17.8 |
IV. |
Investments |
|
|
|
|
|
|
|
|
|
|
|
|
| |
a) |
Up to 1 year |
20.1 |
16.6 |
42.6 |
41.8 |
30.3 |
38.5 |
45.9 |
42.7 |
76.7 |
77.9 |
30.4 |
23.1 |
| |
b) |
Over 1 year and up to 3 years |
12.6 |
17.2 |
17.3 |
18.2 |
12.2 |
16.3 |
18.6 |
18.8 |
12.9 |
11.0 |
13.7 |
17.1 |
| |
c) |
Over 3 years and up to 5 years |
14.2 |
20.9 |
9.1 |
9.9 |
13.0 |
11.1 |
8.1 |
9.5 |
5.2 |
3.5 |
12.2 |
18.5 |
| |
d) |
Over 5 years |
53.1 |
45.2 |
31.0 |
30.1 |
44.4 |
34.1 |
27.4 |
29.0 |
5.2 |
7.5 |
43.6 |
41.3 |
Source: Balance Sheets of respective banks. |
 Off-Balance Sheet Operations of SCBs
Slowdown in off-balance sheet operations of banks in 2012-13
4.11 In 2012-13, not just balance sheet but also off-balance sheet items showed a slowdown, although moderation in the latter was more prominent. The co-movement in the growth of both these items during the recent past suggests a certain degree of complimentarity between them (Appendix Table IV.2; Chart IV.8).
3. Financial Performance of Scheduled Commercial Banks
Slower growth in profits with low credit offtake impacting interest earnings
4.12 In 2012-13, interest earnings were adversely affected with credit growth slowing down. This was also a period when interest rates, which had hardened during earlier years, started softening (Table IV.7; Chart IV.9). Interest expended also grew at a slower pace during the year but its growth was higher than that of interest earned, thereby putting a downward pressure on the growth in both operating and net profits of banks.
Table IV.7: Trends in Income and Expenditure of Scheduled
Commercial Banks |
(Amount in ` billion) |
Item |
2011-12 |
2012-13 |
Amount |
Percentage
Variation |
Amount |
Percentage
Variation |
1 |
2 |
3 |
4 |
5 |
1. Income |
7,416 |
29.8 |
8,614 |
16.2 |
a) Interest Income |
6,553 |
33.4 |
7,636 |
16.5 |
b) Other Income |
863 |
8.1 |
978 |
13.3 |
2. Expenditure |
6,600 |
31.8 |
7,702 |
16.7 |
a) Interest Expended |
4,304 |
44.0 |
5,138 |
19.4 |
b) Operating Expenses |
1,376 |
11.7 |
1,566 |
13.8 |
of which : Wage Bill |
780 |
7.3 |
873 |
11.9 |
c) Provisions and |
920 |
16.8 |
998 |
8.5 |
Contingencies |
|
|
|
|
3. Operating Profit |
1,737 |
16.5 |
1,910 |
10.0 |
4. Net Profit |
817 |
16.1 |
912 |
11.6 |
5. Net Interest Income (NII) (1a-2a) |
2,249 |
16.9 |
2,498 |
11.1 |
Net Interest Margin (NII as percentage of average assets) |
2.9 |
|
2.8 |
|
Source: Annual Accounts of respective banks. |
In continuation with the past trend, RoA witnessed a further contraction in 2012-13
4.13 Return on assets (RoA), the most commonly used indicator of profitability, showed a further reduction by about 5 basis points in 2012-13 (Table IV.8). This reduction was discernible in the case of public sector banks in general, and nationalised banks in particular.
Table IV.8: Return on Assets and Return on Equity of SCBs –
Bank Group-wise |
(Per cent) |
Sr. no. |
Bank group/year |
Return on Assets |
Return on Equity |
2011-12 |
2012-13 |
2011-12 |
2012-13 |
1 |
2 |
3 |
4 |
5 |
1 |
Public sector banks |
0.88 |
0.78 |
15.33 |
13.24 |
| |
1.1 Nationalised banks* |
0.88 |
0.74 |
15.05 |
12.34 |
| |
1.2 SBI Group |
0.89 |
0.88 |
16.00 |
15.29 |
2 |
Private sector banks |
1.53 |
1.63 |
15.25 |
16.46 |
| |
2.1 Old private sector banks |
1.20 |
1.26 |
15.18 |
16.22 |
| |
2.2 New private sector banks |
1.63 |
1.74 |
15.27 |
16.51 |
3 |
Foreign banks |
1.76 |
1.94 |
10.79 |
11.52 |
| |
All SCBs |
1.08 |
1.03 |
14.60 |
13.84 |
Notes: 1. Return on Assets = Net profit/Average total assets.
2. Return on Equity = Net profit/Average total equity.
3. * Nationalised banks include IDBI Bank Ltd.
Source: Annual Accounts of respective banks. |
New private/foreign banks improved profitability through a reduction in the growth of operating expenses
4.14 New private sector banks and foreign banks reported an increase in RoA in 2012-13 as against nationalised banks and SBI Group. The growth of profits of new private sector/foreign banks did not show a sharp fall in 2012-13, as was the case with nationalised banks and SBI Group. Although the interest income of new private/foreign banks posted a lower growth during the year, they could manage to maintain their profits growth through a reduction in the growth of their operating expenses, particularly wage bill (Chart IV.10).
Both NIM and spread narrowed in 2012-13
4.15 Following a trend in the recent years, there was a fall in both net interest margin (NIM) and spread (difference between return and cost of funds) at the aggregate level suggesting some improvement in operating efficiency of SCBs (Tables IV.7; IV.9). An analysis of the standard accounting measures showed an improvement in the efficiency in the banking sector over recent decades (Box IV.1).
Table IV.9: Cost of Funds and Return on Funds - Bank Group-wise |
(Per cent) |
Sr.
no. |
Bank group/year |
Cost of
Deposits |
Cost of
Borrowings |
Cost of
Funds |
Return on
Advances |
Return on
Investments |
Return on
Funds |
Spread |
1 |
2 |
3 |
4 |
5 |
6 |
7 |
8 |
9= (8-5) |
1 |
Public sector banks |
|
|
|
|
|
|
|
| |
2011-12 |
6.36 |
2.80 |
6.06 |
10.31 |
7.54 |
9.52 |
3.46 |
| |
2012-13 |
6.63 |
2.45 |
6.27 |
10.08 |
7.60 |
9.38 |
3.11 |
| |
1.1 Nationalised banks* |
|
|
|
|
|
|
|
| |
2011-12 |
6.51 |
2.77 |
6.22 |
10.32 |
7.43 |
9.49 |
3.27 |
| |
2012-13 |
6.74 |
2.37 |
6.39 |
10.16 |
7.42 |
9.36 |
2.97 |
| |
1.2 SBI Group |
|
|
|
|
|
|
|
| |
2011-12 |
5.97 |
2.85 |
5.66 |
10.27 |
7.80 |
9.60 |
3.94 |
| |
2012-13 |
6.37 |
2.58 |
5.96 |
9.90 |
8.08 |
9.42 |
3.46 |
2 |
Private sector banks |
|
|
|
|
|
|
|
| |
2011-12 |
6.43 |
2.92 |
5.84 |
11.06 |
7.26 |
9.73 |
3.89 |
| |
2012-13 |
6.72 |
3.33 |
6.12 |
11.52 |
7.28 |
10.02 |
3.91 |
| |
2.1 Old private sector banks |
|
|
|
|
|
|
|
| |
2011-12 |
7.24 |
4.34 |
7.10 |
11.98 |
7.37 |
10.47 |
3.37 |
| |
2012-13 |
7.46 |
4.33 |
7.27 |
12.15 |
7.49 |
10.62 |
3.35 |
| |
2.2 New private sector banks |
|
|
|
|
|
|
|
| |
2011-12 |
6.14 |
2.81 |
5.45 |
10.77 |
7.23 |
9.51 |
4.06 |
| |
2012-13 |
6.45 |
3.24 |
5.77 |
11.33 |
7.22 |
9.85 |
4.08 |
3 |
Foreign banks |
|
|
|
|
|
|
|
| |
2011-12 |
4.34 |
2.78 |
3.88 |
9.61 |
8.02 |
8.87 |
4.99 |
| |
2012-13 |
4.67 |
2.78 |
4.05 |
9.55 |
8.13 |
8.89 |
4.84 |
4 |
All SCBs |
|
|
|
|
|
|
|
| |
2011-12 |
6.28 |
2.83 |
5.90 |
10.42 |
7.52 |
9.53 |
3.63 |
| |
2012-13 |
6.57 |
2.76 |
6.12 |
10.33 |
7.57 |
9.49 |
3.36 |
Notes : • Cost of Deposits = Interest Paid on Deposits/Average of current and previous year’s deposits.
• Cost of Borrowings = Interest Paid on Borrowings/Average of current and previous year’s borrowings.
• Cost of Funds = (Interest Paid on Deposits + Interest Paid on Borrowings)/(Average of current and previous year’s deposits plus borrowings).
• Return on Advances = Interest Earned on Advances /Average of current and previous year’s advances.
• Return on Investments = Interest Earned on Investments /Average of current and previous year’s investments.
• Return on Funds = (Interest Earned on Advances + Interest Earned on Investments) / (Average of current and previous year’s advances plus investments).
* Includes IDBI Bank Ltd.
Source: Calculated from balance sheets of respective banks. |
Box IV.1:
Analysis of Efficiency in the Indian Banking Sector – A Ratio Approach
Sustained improvements in efficiency of the banking sector are desirable as they contribute towards (a) higher economic growth – an efficient banking sector can render its basic function of mobilisation and allocation of resources more effectively aiding economic growth (Mohan, 2005); (b) mitigation of risks – the more efficient the banking system, the more is the likelihood that it can withstand and absorb shocks. This link essentially stems from the ability of the banking sector to channel improvements in efficiency towards creating more capital buffers. In fact, studies find a negative and significant relationship between cost efficiency and the risk of a bank failure (Podpiera and Podpiera, 2005); (c) improved financial inclusion – the more efficient the banking system, the more it can aid financial inclusion, particularly because it can make the delivery of banking services cost-effective and can thereby ensure that improved access to banking services results in improved usage (Chakrabarty, 2013).
Theoretically, there exists a finer distinction between efficiency and productivity/profitability. While productivity resulting in profitability gains is the ability of a bank to produce the maximum possible output with given inputs and technology, efficiency measures the performance of a bank in a normative sense by comparing it with the industry leader (RBI, 2008). Empirically, there are two ways of measuring efficiency of the banking sector: (a) through standard accounting measures of productivity/profitability and (b) through data envelopment techniques that estimate a best practice frontier representing an optimal level of resource utilisation, and the efficiency of an individual bank is measured relative to that frontier.
Some of the commonly used accounting measures/ratios for an analysis of efficiency/profitability are cost-to-income ratio (CI), net interest margin (NIM), and return on assets (RoA). CI captures costs incurred to mobilise one unit of revenue/ income by the banking sector reflecting cost efficiency. The lower the ratio, the more efficient are the operations of the banking sector. NIM captures the intermediation efficiency of the sector in deploying their deposits and borrowed funds to generate income from credit and investment operations. The lower the ratio, the more efficient are the operations of the banking sector. RoA reflects the efficiency with which banks deploy their assets. The higher the ratio, the more efficient are the operations of the banking sector.
In a global perspective, India ranks above the advanced economies and other BRICS economies except China in terms of cost efficiency measured through CI. In terms of efficiency captured through NIM, India appears at par with BRICS economies but still lags behind most advanced economies. It compares favourably with other BRICS and advanced economies in terms of profitability measured through RoA (Table).
One of the major objectives of banking sector reforms initiated since the early 1990s has been to improve the operating efficiency and profitability of banks. A plot of CI, NIM and RoA indicates that there has been a decline in CI and NIM for the system as a whole over this period, and also an improvement in RoA, albeit with some variations. As per the Basel II norms, banks should strive to achieve a cost to income ratio of 40 per cent, while RoA of banks should be more than 1 per cent (RBI, 2008). In the decade of 2000s, India’s performance compares favourably with these two benchmarks (Chart). Thus, the standard accounting measures/ratios suggest a trend of improvement in the efficiency of the Indian banking sector over recent years.
References:
Chakrabarty, K. C. (2013), “Productivity Trends in Indian Banking in the Post Reform Period – Experience, Issues and Future Challenges” Address at the FIBAC, August.
Table: Indicators of Profitability and Efficiency, across Select Countries |
(Per cent) |
Country |
Cost-to-income ratio |
NIM |
RoA |
Select advanced countries |
|
|
|
USA |
60.59 |
3.64 |
0.83 |
Japan |
61.65 |
1.01 |
0.28 |
UK |
67.79 |
1.09 |
0.16 |
Denmark |
70.32 |
1.12 |
0.07 |
France |
75.37 |
0.90 |
0.11 |
Germany |
83.62 |
0.78 |
0.02 |
Italy |
89.63 |
1.37 |
-1.10 |
BRICS |
|
|
|
China |
38.48 |
2.74 |
0.77 |
India |
44.53 |
3.02 |
0.95 |
Brazil |
57.28 |
4.97 |
1.21 |
South Africa |
57.34 |
2.76 |
1.10 |
Russia |
90.03 |
3.93 |
1.27 |
Note: Countries are ranked on the basis of cost-to-income ratio. Data relate to 2011. Data for India are given as reported by the World Bank to maintain comparability with other countries in terms of definitions.
Source: Bankscope, Financial Structure Database, World Bank. |
Mohan, Rakesh (2005), “Indian Economy in Global Setting”, RBI Bulletin, October.
Podpiera, A., and J. Podpiera (2005), “Deteriorating Cost Efficiency in Commercial Banks Signals an Increasing Risk of Failure” CNB Working Paper Series, December.
Reserve Bank of India (2008), Report on Currency and Finance – 2006-08, Mumbai.
4.16 Apart from standard accounting measures, another commonly used technique to determine efficiency of the banking sector is the Data Envelopment Analysis (DEA). As per the estimates arrived at using the DEA too, there was a trend of improvement in the efficiency of the Indian banking sector during recent years (Box IV.2).
Box IV.2:
Analysis of Efficiency in the Indian Banking Sector using the Data Envelopment Analysis
The trend of improvement in efficiency in the Indian banking sector, as shown in Box IV.1 using standard accounting measures, is also corroborated by the efficiency estimates arrived at using the Data Envelopment Analysis (DEA) (Chart). Here, the DEA is based on an “intermediation” approach. Under this approach, banks are regarded as financial intermediaries that use a certain set of inputs to create a set of outputs6. Accordingly, inputs have been taken as deposits, borrowings and operating expenses to produce earning assets (comprising loans and investments) as outputs. The period of analysis is from 2000 to 2013 capturing the high growth phase and current phase of slowdown in macroeconomic and banking sector activity7. The DEA follows an input-oriented model that captures the extent of reduction in costs that is essential for achieving a given level of output8.
For public sector banks, which account for the largest share in the Indian banking sector, the average efficiency scores were above that of private sector banks over a major part of the period under consideration. However, they lagged slightly behind the scores of private sector banks after 2010, a period that witnessed a slowdown in the growth and profitability of public sector banks. Importantly, there was much less variation across public sector banks in terms of efficiency levels as compared to private sector banks (Table). Within public sector banks, the SBI Group generally showed greater efficiency than nationalised banks. However, there were signs of convergence in the average efficiency levels of these two bank groups after 2010 (Chart).
References:
Berger, Allen N. and David Humphrey (1997), “Efficiency of Financial Institutions: International Survey and Directions for Future Research”, European Journal of Operational Research, 98(2).
Das, Abhiman, Ashok Nag and Subhash C. Ray (2005), “Liberalisation, Ownership and Efficiency in Indian Banking: A Nonparametric Analysis”, Economic and Political Weekly, 40(12).
Reserve Bank of India (2008), Report on Currency and Finance – 2006-08, Mumbai.
Table: Trends in Variation in Efficiency Levels |
2000 |
2001 |
2002 |
2003 |
2004 |
2005 |
2006 |
2007 |
2008 |
2009 |
2010 |
2011 |
2012 |
2013 |
Coefficient of variation (%) among public sector banks |
5.9 |
5.8 |
4.9 |
8.0 |
7.8 |
6.8 |
4.2 |
2.7 |
1.9 |
2.6 |
3.0 |
2.4 |
2.0 |
2.2 |
Coefficient of variation (%) among private sector banks |
18.0 |
10.4 |
59.6 |
14.0 |
12.3 |
8.7 |
10.2 |
7.3 |
7.6 |
6.1 |
6.1 |
10.0 |
5.6 |
7.3 |
4. Soundness Indicators
Capital Adequacy
CRAR under both Basel I and II remained above the stipulated norm
4.17 Continuing with past trend, the capital to risk-weighted assets ratio (CRAR) remained above the stipulated 9 per cent norm both at the system and bank group levels in 2012-13 but showed a declining trend (Table IV.10). The core CRAR (Tier I) under Basel II too showed a moderate decline (Table IV.11). The decline in capital positions at the aggregate level, however, was on account of deterioration in the capital positions of public sector banks.
Table IV.10: Capital to Risk-Weighted Assets Ratio under Basel I and II – Bank Group-wise (As at end-March) |
(Per cent) |
Item/ Bank Group |
Basel I |
Basel II |
2012 |
2013 |
2012 |
2013 |
1 |
2 |
3 |
4 |
5 |
Public sector banks |
11.88 |
11.31 |
13.23 |
12.38 |
Nationalised banks* |
11.84 |
11.39 |
13.03 |
12.26 |
SBI Group |
11.97 |
11.14 |
13.70 |
12.67 |
Private sector banks |
14.47 |
15.10 |
16.21 |
16.84 |
Old private sector banks |
12.47 |
12.33 |
14.12 |
13.73 |
New private sector banks |
14.90 |
15.71 |
16.66 |
17.52 |
Foreign banks |
17.30 |
18.76 |
16.75 |
17.87 |
Scheduled commercial banks |
12.94 |
12.77 |
14.24 |
13.88 |
Note: *: Includes IDBI Bank Ltd.
Source: Based on off-site returns. |
Table IV.11: Component-wise Capital Adequacy of SCBs (As at end-March) |
(Amount in ` billion) |
Item |
Basel I |
Basel II |
2012 |
2013 |
2012 |
2013 |
1. Capital funds (i+ii) |
7,810 |
8,906 |
7,780 |
8,879 |
i) Tier I capital |
5,686 |
6,595 |
5,672 |
6,580 |
ii) Tier II capital |
2,124 |
2,311 |
2,109 |
2,299 |
2. Risk-weighted assets |
60,376 |
69,742 |
54,621 |
63,969 |
3. CRAR (1 as % of 2) |
12.94 |
12.77 |
14.24 |
13.88 |
of which: Tier I |
9.42 |
9.46 |
10.38 |
10.29 |
Tier II |
3.52 |
3.31 |
3.86 |
3.59 |
Source: Based on off-site returns. |
4.18 Deteriorating capital positions of public sector banks is a matter of concern given the fiscal implications of capital infusion in these banks (Table IV.12). Public sector banks remain above the statutory norm for CRAR. However, as they migrate to the advanced Basel III framework, both the quantity and quality (common equity) of capital will need to be improved, while meeting the growing credit needs of the economy and maintaining the floor for public ownership.
Table IV.12: Amount of Expenditure on Recapitalisation
of Public Sector Banks |
Year |
Recapitalisation amount
(in ` billion) |
2000-01 |
- |
2001-02 |
13 |
2002-03 |
8 |
2003-04 |
- |
2004-05 |
- |
2005-06 |
5 |
2006-07 |
- |
2007-08 |
100 |
2008-09 |
19 |
2009-10 |
12 |
2010-11 |
201 |
2011-12 |
120 |
2012-13 |
125 |
2013-14 |
140 |
- Not available/nil.
Source: Compiled from the Ministry of Finance, Union Budget documents and Report on Currency and Finance, 2006-08. |
Non-Performing Assets
NPAs remained a pressure point for the banking sector
4.19 The gross NPA ratio at the aggregate level stood at 3.6 per cent at end-March 2013 up from 3.1 per cent at end-March 2012 (Table IV.13). The deterioration in asset quality was most perceptible for the SBI Group with its NPA ratio reaching a high of 5 per cent at end-March 2013. With the gross NPA ratio reaching about 3.6 per cent by end-March 2013, the nationalised banks were positioned next to the SBI Group.
Table IV.13: Trends in Non-performing Assets - Bank Group-wise |
(Amount in ` billion) |
Item |
Public
sector
banks |
National-ised
banks* |
SBI
Group |
Private
sector
banks |
Old
private
sector
banks |
New
private
sector
banks |
Foreign
banks |
Scheduled
commercial
banks |
1 |
2 |
3 |
4 |
5 |
6 |
7 |
8 |
9 |
Gross NPAs |
|
|
|
|
|
|
|
|
Closing balance for 2011-12 |
1,178 |
696 |
482 |
187 |
42 |
145 |
62 |
1,429 |
Opening balance for 2012-13 |
1,178 |
696 |
482 |
187 |
42 |
145 |
62 |
1,429 |
Addition during 2012-13 |
1,198 |
772 |
425 |
128 |
41 |
87 |
41 |
1,368 |
Recovered during 2012-13 |
648 |
429 |
219 |
63 |
30 |
33 |
24 |
736 |
Written off during 2012-13 |
78 |
17 |
60 |
42 |
1 |
40 |
0 |
120 |
Closing balance for 2012-13 |
1,650 |
1,022 |
627 |
210 |
52 |
158 |
79 |
1,940 |
Gross NPAs as per cent of Gross Advances** |
|
|
|
|
|
|
|
|
2011-12 |
3.3 |
2.8 |
4.6 |
2.1 |
1.8 |
2.2 |
2.6 |
3.1 |
2012-13 |
4.1 |
3.6 |
5.0 |
2.0 |
1.9 |
2.0 |
2.9 |
3.6 |
Net NPAs |
|
|
|
|
|
|
|
|
Closing balance for 2011-12 |
593 |
391 |
202 |
44 |
13 |
30 |
14 |
652 |
Closing balance for 2012-13 |
900 |
619 |
281 |
59 |
20 |
39 |
26 |
986 |
Net NPAs as per cent of Net Advances |
|
|
|
|
|
|
|
|
2011-12 |
1.5 |
1.4 |
1.8 |
0.5 |
0.6 |
0.4 |
0.6 |
1.3 |
2012-13 |
2.0 |
2.0 |
2.0 |
0.5 |
0.8 |
0.4 |
1.0 |
1.7 |
Notes: 1. *: Includes IDBI Bank Ltd.
2. **: Calculated taking gross NPAs from annual accounts of respective banks and gross advances from off-site returns.
Source: Annual Accounts of banks and off-site returns. |
4.20 There were also signs of a deepening deterioration within NPAs with an increase in the proportion of “doubtful” loan assets (Table IV.14).
Table IV.14: Classification of Loan Assets - Bank Group-wise (As at end-March) |
(` billion) |
Sr. No. |
Bank group |
Year |
Standard assets |
Sub-standard assets |
Doubtful assets |
Loss assets |
Amount |
Per cent* |
Amount |
Per cent* |
Amount |
Per cent* |
Amount |
Per cent* |
1 |
2 |
3 |
4 |
5 |
6 |
7 |
8 |
9 |
10 |
11 |
1 |
Public sector banks |
2012 |
38,255 |
97.0 |
623 |
1.6 |
490 |
1.2 |
60 |
0.1 |
| |
|
2013 |
43,957 |
96.4 |
815 |
1.8 |
761 |
1.7 |
68 |
0.1 |
1.1 |
Nationalised banks** |
2012 |
26,909 |
97.5 |
402 |
1.5 |
268 |
1.0 |
21 |
0.1 |
| |
|
2013 |
30,396 |
96.8 |
558 |
1.8 |
424 |
1.3 |
35 |
0.1 |
1.2 |
SBI Group |
2012 |
11,345 |
95.9 |
221 |
1.9 |
222 |
1.9 |
39 |
0.3 |
| |
|
2013 |
13,561 |
95.6 |
258 |
1.8 |
337 |
2.4 |
33 |
0.2 |
2 |
Private sector banks |
2012 |
9,629 |
98.1 |
52 |
0.5 |
104 |
1.1 |
29 |
0.3 |
| |
|
2013 |
11,384 |
98.2 |
64 |
0.6 |
112 |
1.0 |
32 |
0.3 |
2.1 |
Old private sector banks |
2012 |
2,287 |
98.2 |
18 |
0.8 |
17 |
0.7 |
7 |
0.3 |
| |
|
2013 |
2,679 |
98.1 |
23 |
0.9 |
23 |
0.8 |
6 |
0.2 |
2.2 |
New private sector banks |
2012 |
7,342 |
98.1 |
34 |
0.4 |
87 |
1.2 |
22 |
0.3 |
| |
|
2013 |
8,705 |
98.2 |
41 |
0.5 |
89 |
1.0 |
25 |
0.3 |
3 |
Foreign banks |
2012 |
2,284 |
97.3 |
21 |
0.9 |
22 |
0.9 |
20 |
0.8 |
| |
|
2013 |
2,610 |
97.0 |
29 |
1.1 |
27 |
1.0 |
23 |
0.9 |
| |
Scheduled commercial banks |
2012 |
50,168 |
97.2 |
695 |
1.3 |
617 |
1.2 |
109 |
0.2 |
| |
|
2013 |
57,951 |
96.8 |
909 |
1.5 |
900 |
1.5 |
123 |
0.2 |
Notes: 1. Constituent items may not add up to the total due to rounding off.
2. *: As per cent to gross advances.
3. **: Includes IDBI Bank Ltd.
Source: Off-site returns. |
The increased shift of loan assets towards the “doubtful” category was most prominent for the SBI Group and nationalised banks.
4.21 The slippage ratio, defined as additions to NPAs during the year as per cent of standard advances at the beginning of the year, also showed an increase during 2012-13 (Chart IV.11).
4.22 At the aggregate level, the ratio of restructured standard advances to gross advances stood at 5.8 per cent at end-March 2013. It was the highest for nationalised banks (at 8.3 per cent) followed by the SBI Group (at 4.7 per cent) (Chart IV.12).
Steep rise in the growth of restructured debt under the corporate debt restructuring (CDR) mechanism
4.23 There was a steep rise in the growth of restructured debt under the CDR mechanism in 2012-13. The CDR mechanism covers only multiple banking accounts and syndication/ consortium accounts where all banking institutions together have an outstanding exposure of `100 million and above. In 2012-13, there was a growth of about 37 per cent in the total number of cases approved for restructuring under this mechanism and the debt thus restructured posted a growth of 52 per cent, marking a sharp increase over its corresponding growth in 2011-12 (Table IV.15). The growth in the number of cases and amount of debt receded marginally in the first quarter of 2013-14.
Table IV.15: Trends in Debt Restructured under
the CDR Mechanism |
End-Period |
No. of cases approved |
Aggregate debt (` billion) |
March 2012 |
292 |
1,505 |
| |
(20.7) |
(35.7) |
March 2013 |
401 |
2,290 |
| |
(37.3) |
(52.2) |
June 2013 |
415 |
2,503 |
| |
(34.3) |
(48.6) |
Note: Figures in brackets indicate percentage change over the corresponding period during the previous year.
Source: CDR Cell. |
4.24 The sectors that witnessed the maximum distress were iron and steel, and infrastructure. At end-March 2013, iron and steel accounted for 23 per cent of the total restructured debt, while infrastructure (including power and telecommunications) held an almost comparable share of 22.7 per cent in the total restructured debt9.
Non-priority sector – the major contributor to rise in NPAs
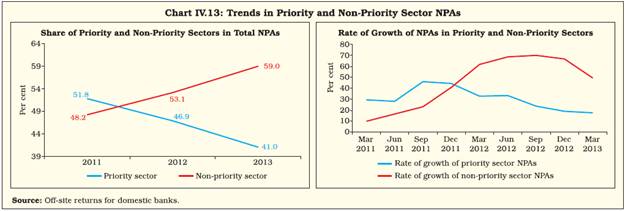
4.25 Although the NPA ratio in the priority sector was consistently higher than the NPA ratio in the non-priority sector, deterioration in asset quality in 2012-13 was primarily on account of the non-priority sector (Table IV.16; Chart IV.13).
Table IV.16: Sector-wise NPAs of Domestic Banks* |
(Amount in ` billion) |
Bank group |
Priority sector |
Of which |
Non-priority sector |
Total NPAs |
Agriculture |
Micro and Small
Enterprises |
Others |
Amt. |
Per cent |
Amt. |
Per cent |
Amt. |
Per cent |
Amt. |
Per cent |
Amt. |
Per cent |
Amt. |
Per cent |
Public sector banks |
|
|
|
|
|
|
|
|
|
|
|
|
2012 |
562 |
50.0 |
227 |
20.2 |
174 |
15.5 |
161 |
14.3 |
563 |
50.0 |
1,125 |
100.0 |
| 2013 |
669 |
42.9 |
280 |
18.0 |
284 |
18.2 |
105 |
6.7 |
890 |
57.1 |
1,559 |
100.0 |
Nationalised banks** |
|
|
|
|
|
|
|
|
|
|
|
|
2012 |
323 |
48.4 |
129 |
19.3 |
134 |
20.0 |
60 |
9.1 |
345 |
51.6 |
668 |
100.0 |
2013 |
405 |
42.2 |
156 |
16.3 |
178 |
18.6 |
70 |
7.3 |
554 |
57.8 |
959 |
100.0 |
| SBI Group |
|
|
|
|
|
|
|
|
|
|
|
|
2012 |
239 |
52.3 |
98 |
21.4 |
41 |
9.0 |
100 |
22.0 |
218 |
47.7 |
457 |
100.0 |
2013 |
264 |
44.1 |
124 |
20.7 |
106 |
17.6 |
35 |
5.8 |
335 |
55.9 |
599 |
100.0 |
Private sector banks |
|
|
|
|
|
|
|
|
|
|
|
|
2012 |
51 |
27.9 |
22 |
11.8 |
17 |
9.4 |
12 |
6.7 |
132 |
72.1 |
183 |
100.0 |
2013 |
52 |
26.0 |
22 |
10.9 |
20 |
9.9 |
11 |
5.3 |
148 |
74.0 |
200 |
100.0 |
| Old private sector banks |
|
|
|
|
|
|
|
|
|
|
|
|
2012 |
18 |
42.9 |
6 |
13.4 |
7 |
16.8 |
5 |
12.8 |
24 |
57.1 |
42 |
100.0 |
2013 |
19 |
36.8 |
6 |
12.2 |
7 |
13.9 |
6 |
10.7 |
33 |
63.2 |
52 |
100.0 |
| New private sector banks |
|
|
|
|
|
|
|
|
|
|
|
|
2012 |
33 |
23.4 |
16 |
11.3 |
10 |
7.2 |
7 |
4.9 |
108 |
76.6 |
141 |
100.0 |
2013 |
33 |
22.2 |
15 |
10.4 |
12 |
8.5 |
5 |
3.3 |
115 |
77.8 |
148 |
100.0 |
All SCBs |
|
|
|
|
|
|
|
|
|
|
|
|
2012 |
613 |
46.9 |
249 |
19.0 |
191 |
14.7 |
173 |
13.2 |
695 |
53.1 |
1,308 |
100.0 |
2013 |
721 |
41.0 |
302 |
17.2 |
304 |
17.3 |
116 |
6.5 |
1,038 |
59.0 |
1,759 |
100.0 |
Notes: 1. * : Excluding foreign banks.
2. Amt. – Amount; Per cent – Per cent of total NPAs.
3. **- Includes IDBI Bank Ltd.
4. Constituent items may not add up to the total due to rounding off.
Source: Based on off-site returns (domestic). |
 4.26 Industry, which accounts for a little less than half the total credit of domestic banks, has shown a steady deterioration in asset quality in the recent years, particularly in 2012-1310. The NPA ratio for the infrastructural sector, which accounted for about one-third of the total industrial credit, showed a rising trend during this period (Chart IV.14). By contrast, there was a falling trend in the NPA ratio for the retail sector.
SARFAESI Act remained the most important channel for NPA recovery
4.27 In 2012-13, among the three channels for NPA recovery, viz., Securitisation and Reconstruction of Financial Assets and Enforcement of Security Interest Act (SARFAESI Act), Debt Recovery Tribunals (DRT) and Lok Adalats, the largest amount was recovered through the SARFAESI Act. NPAs recovered through this Act accounted for about 80 per cent of the total amount of NPAs. However, in terms of the total number of cases referred, Lok Adalats dominated with a share of 80 per cent; this was because these courts dealt with a large number of cases involving smaller amounts having an individual ceiling of `20,00,000 (Table IV.17).
Table IV.17: NPAs of SCBs Recovered through Various Channels |
(Amount in ` billion) |
Recovery channel |
2011-12 |
2012-13 |
No. of cases
referred |
Amount
involved |
Amount
recovered* |
Col. (4) as %
of Col. (3) |
No. of cases
referred |
Amount
involved |
Amount
recovered* |
Col.(8) as %
of Col.(7) |
1 |
2 |
3 |
4 |
5 |
6 |
7 |
8 |
9 |
i) Lok Adalats |
4,76,073 |
17 |
2 |
11.8 |
8,40,691 |
66 |
4 |
6.1 |
ii) DRTs |
13,365 |
241 |
41 |
17.0 |
13,408 |
310 |
44 |
14.0 |
iii) SARFAESI Act |
1,40,991 |
353 |
101 |
28.6 |
1,90,537 |
681 |
185 |
27.1 |
Total |
6,30,429 |
611 |
144 |
23.6 |
10,44,636 |
1,058 |
232 |
21.9 |
Notes: 1. *: Refers to amount recovered during the given year, which could be with reference to cases referred during the given year as well as during earlier years.
2. DRTs- Debt Recovery Tribunals. |
Banks remained the most important subscribers of securitised assets of SCs/RCs but their share was on a decline
4.28 Of the total amount of assets securitised by Securitisation/Reconstruction Companies (SCs/RCs), the largest amount was subscribed to by banks. However, their share has been on a continued decline in recent years (Table IV.18; Chart IV.15).
Table IV.18: Details of Financial Assets Securitised by SCs/RCs |
(Amount in ` billion) |
Item |
End-June
2012 |
End-June
2013 |
1 |
2 |
3 |
1 |
Book value of assets acquired |
805 |
885 |
2 |
Security Receipts issued by SCs/RCs |
167 |
189 |
3 |
Security Receipts subscribed to by |
|
|
| |
(a) Banks |
116 |
126 |
| |
(b) SCs/RCs |
36 |
45 |
| |
(c) FIIs |
1 |
1 |
| |
(d) Others (Qualified Institutional Buyers) |
15 |
17 |
4 |
Amount of Security Receipts completely redeemed |
82 |
101 |
Source: Quarterly Statement submitted by Securitisation Companies/Reconstruction Companies (SCs/RCs). |
Provisioning
Marginal decline in the provisioning coverage ratio at the aggregate level
4.29 Although there was a rise in the gross NPA ratio in 2012-13, the provisioning coverage ratio (PCR), defined as provisions for credit loss as per cent of gross NPAs, showed a marginal decline during the year at the aggregate level. The decline was most perceptible for nationalised banks (Chart IV.16). As regards SBI Group, however, there has been a steady improvement in PCR since 2011. This can be regarded as a positive development for this bank group against the backdrop of its rising NPA ratio during this period.
5. Sectoral Distribution of Bank Credit
Deceleration in growth of credit to all productive sectors
4.30 The year 2012-13 was marked by a slowdown in the growth of credit to all productive sectors, viz., agriculture, industry and services (Table IV.19). The slowdown was the sharpest for agriculture and allied activities. There was a slowdown in the growth of credit to the infrastructural sector within industry. The slowdown in credit to NBFCs – accounting for about one-fifth of the total credit to the services sector – was an important reason behind an overall slowdown in the growth of services sector credit (Chart IV.17). By contrast, retail loans was the only segment, which maintained its growth in 2012-13.
Table IV.19: Sectoral Deployment of Gross Bank Credit |
(Amount in ` billion) |
Sr
No. |
Sector |
Outstanding as on |
Percentage Variation |
March 2012 |
March 2013 |
2011-12 |
2012-13 |
1 |
Agriculture and Allied Activities |
5,484 |
5,899 |
14.1 |
7.6 |
2 |
Industry, of which |
19,374 |
22,302 |
20.7 |
15.1 |
| |
2.1 Infrastructure |
6,300 |
7,297 |
20.8 |
15.8 |
| |
2.2 Micro and Small Industries |
2,363 |
2,843 |
12.4 |
20.3 |
3 |
Services, of which |
10,166 |
11,486 |
14.5 |
13.0 |
| |
3.1 Trade |
2,245 |
2,760 |
21.3 |
22.9 |
| |
3.2 Commercial Real Estate |
1,126 |
1,261 |
15.7 |
12.0 |
| |
3.3 Tourism, Hotels & Restaurants |
323 |
354 |
16.7 |
9.9 |
| |
3.4 Computer Software |
143 |
169 |
3.0 |
18.4 |
| |
3.5 Non-Banking Financial Companies (NBFCs) |
2,278 |
2,570 |
24.0 |
12.8 |
4 |
Personal Loans, of which |
7,873 |
9,009 |
13.4 |
14.4 |
| |
4.1 Credit Card Outstanding |
204 |
249 |
12.9 |
21.9 |
| |
4.2 Education |
498 |
550 |
16.6 |
10.4 |
| |
4.3 Housing (Including Priority Sector Housing) |
4,013 |
4,600 |
12.6 |
14.6 |
| |
4.4 Advances against Fixed Deposits (Including FCNR(B), NRNR Deposits etc.) |
569 |
611 |
15.4 |
7.3 |
5 |
Non-food Credit (1 to 4) |
42,897 |
48,696 |
17.0 |
13.5 |
6 |
Gross Bank Credit |
43,714 |
49,642 |
17.1 |
13.6 |
Note: Percentage variation could be slightly different as absolute numbers have been rounded off to ` billion.
Source: Sectoral and Industrial Deployment of Bank Credit Return (Monthly). |
 Priority Sector Credit
Rise in growth of priority sector credit in 2012-13
4.31 There was a rise in the growth of priority sector credit in 2012-13 against a drop in overall credit growth during the year. The growth in priority sector credit, however, remained lower than the growth in overall credit (Chart IV.18)11.
At the aggregate level, share of credit to priority sectors was lower than the target
4.32 In 2012-13, credit to priority sectors by public and private sector banks was 36.3 per cent and 37.5 per cent (of Adjusted Net Bank Credit/ Credit equivalent of Off-Balance Sheet Exposure, whichever is higher) respectively, indicating a shortfall against the overall target of 40 per cent (Table IV.20).
Table IV.20: Priority Sector Lending by Banks (As on March 31, 2013) |
(Amount in ` billion) |
Item |
Public Sector Banks |
Private Sector Banks |
Foreign Banks |
Amount Outstanding |
Per cent of ANBC/OBE |
Amount Outstanding |
Per cent of ANBC/OBE |
Amount Outstanding |
Per cent of ANBC/OBE |
1 |
2 |
3 |
4 |
5 |
6 |
7 |
Total Priority Sector Advances |
12,836 |
36.3 |
3,274 |
37.5 |
1,033 |
35.2 |
of which |
|
|
|
|
|
|
Agriculture |
5,306 |
15.0 |
1,119 |
12.8 |
72 |
2.4 |
Weaker Sections |
3,473 |
9.8 |
505 |
5.7 |
55 |
1.9 |
Micro and Small Enterprises |
4,784 |
13.5 |
1,417 |
16.2 |
283 |
9.6 |
Notes: 1. Data are provisional.
2. As on March 31, 2013, priority sector lending targets for domestic scheduled commercial banks/foreign banks with 20 branches or more is set at 40 per cent of Adjusted Net Bank Credit (ANBC) or credit equivalent amount of off-balance sheet exposure (OBE), whichever is higher as on March 31 of the preceding year. The target of 40 per cent for foreign banks with 20 branches or more is to be achieved by March 2018. For foreign banks having less than 20 branches, the target is set at 32 per cent of ANBC or OBE, whichever is higher, as on March 31 of the preceding year. |
Banks played a lead role in the distribution of Kisan Credit Cards (KCCs)
4.33 With a share of about 63 per cent in the total KCCs issued at end-March 2013, commercial banks were leading in the distribution of these cards. Co-operatives had a share of about 21 per cent in the total cards issued, with RRBs accounting for the remaining 16 per cent (Chart IV.19; Appendix Table IV.3). Over the years, the shares of commercial banks and RRBs have witnessed an increase, while the share of co-operatives has concomitantly declined.
Retail Loans
Retail loans maintained their growth even in a period of slowdown in overall credit growth
4.34 In 2012-13, the retail loans portfolio continued to grow in double digits as in the previous year (Table IV.21). It is noteworthy that even in a period of overall slowdown in credit growth, retail credit maintained its growth.
Table IV.21: Retail Loan Portfolio of Banks |
(Amount in ` billion) |
Sr.
No. |
Item |
Amount Outstanding |
Percentage Variation |
2012 |
2013 |
2011-12 | 2012-13 |
| |
1 |
2 |
3 |
4 |
5 |
1 |
Housing Loans |
4,118 |
4,754 |
14.2 |
15.4 |
2 |
Consumer Durables |
27 |
34 |
-41.0 |
25.3 |
3 |
Credit Card Receivables |
223 |
268 |
19.6 |
20.1 |
4 |
Auto Loans |
1,162 |
1,421 |
16.0 |
22.3 |
5 |
Other Personal Loans |
3,069 |
3,618 |
24.3 |
17.9 |
| |
Total Retail Loans (1 to 5) |
8,599 |
10,095 |
17.6 |
17.4 |
| |
|
(18.4) |
(18.8) |
|
|
Notes: 1. Figures in parentheses represent percentage share of retail loans in total loans and advances. The amount of total loans and advances are as provided in the off-site returns (domestic) of SCBs.
2. Percentage variation could be slightly different as absolute numbers have been rounded off to ` billion.
Source: Based on off-site returns (domestic). |
4.35 Growth in retail loans was maintained in 2012-13 on account of a sustained double digit growth in housing loans – the largest segment of retail loans, and a rising growth in auto loans – the third major segment of retail loans. The increase in the growth in credit card receivables too contributed to the overall growth in retail loans, although their share in total retail loans was less than 4 per cent.
Credit to Sensitive Sectors
Credit to sensitive sectors picked up even in a period of slowdown in overall credit growth
4.36 In the past, growth in credit to sensitive sectors – namely, real estate, capital market and commodities – generally followed a pattern similar to the growth in overall credit (Appendix Table IV.4). However, in 2012-13, growth in credit to sensitive sectors almost doubled primarily on account of credit to real estate. This expansion needs to be seen in light of the steep rise in housing prices in all Tier I cities and several Tier II cities in 2012-1312.
6. Operations of Scheduled Commercial Banks in the Capital Market
Resources raised by banks through public issues remained subdued in 2012-13
4.37 Reflecting a subdued performance of the secondary market and a lower credit off-take, banks raised only about `3 billion through public issues in 2012-13 (Table IV.22).
Table IV.22: Public Issues by the Banking Sector |
(` billion) |
Year |
Public Sector Banks |
Private Sector Banks |
Total |
Grand Total |
Equity |
Debt |
Equity |
Debt |
Equity |
Debt |
1 |
2 |
3 |
4 |
5 |
6 |
7 |
8=(6+7) |
2011-12 |
- |
- |
- |
- |
- |
- |
- |
2012-13 |
- |
- |
3 |
- |
3 |
- |
3 |
-: Nil/Negligible.
Source: SEBI. |
4.38 Banks tend to raise a much larger amount through private placements than public issues; 2012-13 was no exception to this trend (Table IV.23). On account of continued uncertainty in global financial markets, banks did not mobilise resources through American/Global Depository Receipts (ADR/GDR) issues in 2012-13.
Table IV.23: Resources Raised by Banks through Private Placements |
(Amount in ` billion) |
Category |
2011-12 |
2012-13 |
No. of Issues |
Amount Raised |
No. of Issues |
Amount Raised |
1 |
2 |
3 |
4 |
5 |
Private Sector Banks |
11 |
62 |
21 |
171 |
Public Sector Banks |
9 |
44 |
12 |
91 |
Total |
20 |
106 |
33 |
262 |
Note: Data for 2012-13 are provisional.
Source: Merchant Bankers and Financial Institutions. |
BSE Bankex outperformed BSE Sensex over a major part of 2012-13
4.39 As in the past, BSE Bankex outperformed BSE Sensex in 2012-13 reflecting a relatively better performance of bank stocks. There was a steady increase in Bankex over a major part of the year except during the first quarter, partly reflecting strong FII inflows and the use of unconventional monetary policies by the central banks in major advanced economies (Chart IV.20). However, in the last quarter of the year, there was a downtrend in Bankex resulting in its convergence with the BSE Sensex owing to increased uncertainties in global financial markets and a slowing down of the domestic economy.
4.40 The buoyancy in bank stocks during 2012- 13 was primarily attributable to the stocks of private sector banks as compared to the stocks of public sector banks (Appendix Table IV.5; Chart IV.21).
4.41 Along with the return on Bankex, its variation was also much higher than that of BSE Sensex in 2012-13. This reflected higher returns but greater risks associated with trading of bank stocks (Table IV.24).
Table IV.24: Risk-Return Performance, Turnover and Capitalisation
of Bank Stocks |
Item |
2010-11 |
2011-12 |
2012-13 |
2013-14# |
1 |
2 |
3 |
4 |
5 |
1. Return* |
|
|
|
|
BSE Bankex |
24.9 |
-11.6 |
10.9 |
-15.9 |
BSE Sensex |
10.9 |
-10.5 |
8.2 |
2.9 |
2. Volatility@ |
|
|
|
|
BSE Bankex |
10.3 |
9.7 |
9.3 |
11.0 |
BSE Sensex |
6.3 |
6.2 |
6.4 |
3.3 |
3. Share of turnover of bank stocks in total turnover |
9.5 |
11.4 |
13.3 |
13.0$ |
4. Share of capitalisation of bank stocks in total market capitalisation ** |
11.9 |
11.5 |
12.2 |
12.2$ |
Notes: 1. * : Percentage variations in indices on a point-to-point basis.
2. @ : Defined as coefficient of variation.
3. **: As at end-period.
4. #: April-September 2013; $: April-June 2013.
Source: Bloomberg and BSE. |
7. Ownership Pattern in Scheduled Commercial Banks
Banking sector predominantly public in nature
4.42 The public sector accounted for about 73 per cent of the total assets in the Indian banking sector at end-March 2013. In fact, there has been a trend of increase in the share of public sector banks in total assets of the banking sector over recent years (Chart IV.22).
The degree of concentration in the banking sector remains low
4.43 Notwithstanding the predominance of public ownership, the Indian banking sector is marked by a fairly low degree of concentration unlike what is observed in certain other countries which have a dominant public banking system like China. Moreover, the extent of concentration has been on a steady fall in recent years (Box IV.3).
Box IV.3:
Asset Concentration within the Indian Banking Sector
Competition in any sector, among other factors such as entry/ exit barriers, and price/product differentiation, also depends on the degree of concentration in the sector. Literature and associated empirical evidence illustrates both advantages and disadvantages of concentration in the banking industry13. As regards advantages, it is argued that (a) the impact of systemic crisis is expected to be less on more concentrated banking sectors; (b) it is often easier to supervise few large players than a large number of small players. However, on the flip side, (a) high concentration is often associated with higher interest rates resulting from a collusion among lenders; (b) the risks of too-big-to-fail are more acute in a highly concentrated banking sector; (c) it is observed that more competitive the banking sector, the less is the probability that the country will suffer from a systemic banking crisis (ibid.).
Banking sectors in most advanced economies except the US are marked by a high degree of concentration (Table 1). It is interesting to note that the Chinese banking sector, known to be predominantly public in nature, is marked by a relatively high degree of concentration. By contrast, despite the predominance of public ownership, the degree of concentration in the Indian banking sector has been at a fairly low level.
Table 1: Degree of Concentration in the Banking Sector |
Country |
Concentration
measure |
Country |
Concentration
measure |
Germany |
78.1 |
China |
51.5 |
South Africa |
77.8 |
Japan |
44.6 |
Australia |
69.0 |
Argentina |
35.6 |
France |
62.7 |
USA |
35.4 |
Brazil |
62.6 |
Russia |
31.7 |
UK |
57.8 |
India |
29.4 |
Note: Concentration measure refers to the share of top three banks in total banking assets. Countries are ranked in a descending order according to the measure. Data relate to 2011.
Source: Financial Structure Database, World Bank. |
An analysis of the mergers and acquisitions within the Indian banking sector since the initiation of economic reforms suggests that consolidation gained momentum in the decade of 2000s. Of the 28 mergers that took place since 1989-90, 16 mergers took place during the 2000s14.
However, the extent of concentration in the Indian banking sector, which has been moderate, was in fact on a decline during this decade (Table 2). This implies that the period of increased consolidation in the Indian banking sector did not witness a rise in the concentration of banking sector assets.
Reference:
Beck, T., Asli Demirgüç-Kunt and Ross Levine (2003), “Bank Concentration and Crises”, NBER Working Paper No. 9921.
Bikker, J.A. and K. Haaf (2000), “Measures of Competition and Concentration in the Banking Industry: A Review of Literature”, De Nederlandsche Bank, Research Series Supervision No. 7.
Within public sector banks, gradual shift towards greater public shareholding
4.44 Within public sector banks, there has been a gradual shift towards greater public shareholding in recent years. Between 2011 and 2013, there was a fall in the percentage of banks having shares close to the statutory floor of 51 per cent. By contrast, there was a rise in the share of public sector banks having public shareholding far above the statutory floor (ranging above 81 per cent) (Table IV.25 read with Appendix Table IV.6). As discussed earlier, the government provided increased capital support to public sector banks in recent years (read Table IV.12).
Table IV.25: Number of Public Sector Banks classified by Percentage of Public Shareholding |
Class of shareholding |
2011 |
2012 |
2013 |
1 |
2 |
3 |
4 |
More than 51 and up to |
10 |
9 |
9 |
61 per cent |
(47.6) |
(42.9) |
(42.9) |
More than 61 and up to |
6 |
7 |
5 |
71 per cent |
(28.6) |
(33.3) |
(23.8) |
More than 71 and up to |
3 |
4 |
4 |
81 per cent |
(14.3) |
(19.0) |
(19.0) |
More than 81 per cent |
2 |
1 |
3 |
| |
(9.5) |
(4.8) |
(14.3) |
Total |
21 |
21 |
21 |
| |
(100.0) |
(100.0) |
(100.0) |
Notes: 1. Figures in brackets indicate percentage share in total.
2. Including 19 nationalised banks, SBI and IDBI Bank Ltd. |
8. Foreign Banks’ Operations in India and Overseas Operations of Indian Banks
Growth of Indian banks abroad outpacing the growth of foreign banks in India
4.45 While the number of branches of foreign banks operating in India exceeds the number of Indian bank branches abroad, the growth in the latter has been more than the former in the recent years. As at end-March 2013, there were 43 foreign banks operating in India with 331 branches. As against this, there were 24 Indian banks with 171 branches abroad (Table IV.26; Chart IV.23).
Table IV.26: Overseas Operations of Indian Banks (As at end-March) |
Name of the Bank |
Branch |
Subsidiary |
Representative Office |
Joint Venture Bank |
Other Offices* |
Total |
2012 |
2013 |
2012 |
2013 |
2012 |
2013 |
2012 |
2013 |
2012 |
2013 |
2012 |
2013 |
1 |
2 |
3 |
4 |
5 |
6 |
7 |
8 |
9 |
10 |
11 |
12 |
13 |
I. |
Public Sector Banks |
150 |
155 |
21 |
20 |
38 |
36 |
6 |
7 |
22 |
29 |
237 |
247 |
| |
1 Allahabad Bank |
1 |
1 |
0 |
0 |
1 |
1 |
0 |
0 |
0 |
0 |
2 |
2 |
| |
2 Andhra Bank |
0 |
0 |
0 |
0 |
2 |
2 |
0 |
0 |
0 |
0 |
2 |
2 |
| |
3 Bank of Baroda |
47 |
51 |
9 |
9 |
2 |
1 |
1 |
2 |
8 |
9 |
67 |
72 |
| |
4 Bank of India |
24 |
25 |
4 |
4 |
5 |
4 |
0 |
0 |
0 |
0 |
33 |
33 |
| |
5 Canara Bank |
5 |
5 |
0 |
0 |
1 |
1 |
0 |
0 |
0 |
0 |
6 |
6 |
| |
6 Central Bank of India |
0 |
0 |
0 |
0 |
0 |
1 |
0 |
0 |
0 |
0 |
0 |
1 |
| |
7 Corporation Bank |
0 |
0 |
0 |
0 |
2 |
2 |
0 |
0 |
0 |
0 |
2 |
2 |
| |
8 Indian Bank |
4 |
4 |
0 |
0 |
0 |
0 |
0 |
0 |
0 |
0 |
4 |
4 |
| |
9 Indian Overseas Bank |
6 |
6 |
0 |
0 |
3 |
3 |
0 |
0 |
3 |
3 |
12 |
12 |
| |
10 IDBI Bank Ltd. |
1 |
1 |
0 |
0 |
0 |
0 |
0 |
0 |
0 |
0 |
1 |
1 |
| |
11 Punjab National Bank |
4 |
4 |
3 |
3 |
5 |
5 |
1 |
1 |
0 |
0 |
13 |
13 |
| |
12 State Bank of India |
52 |
51 |
5 |
4 |
8 |
7 |
4 |
4 |
11 |
17 |
80 |
83 |
| |
13 State Bank of Travancore |
0 |
0 |
0 |
0 |
1 |
1 |
0 |
0 |
0 |
0 |
1 |
1 |
| |
14 Syndicate Bank |
1 |
1 |
0 |
0 |
0 |
0 |
0 |
0 |
0 |
0 |
1 |
1 |
| |
15 UCO Bank |
4 |
4 |
0 |
0 |
1 |
0 |
0 |
0 |
0 |
0 |
5 |
4 |
| |
16 Union Bank |
1 |
2 |
0 |
0 |
5 |
5 |
0 |
0 |
0 |
0 |
6 |
7 |
| |
17 United Bank of India |
0 |
0 |
0 |
0 |
1 |
2 |
0 |
0 |
0 |
0 |
1 |
2 |
| |
18 Oriental Bank of Commerce |
0 |
0 |
0 |
0 |
1 |
1 |
0 |
0 |
0 |
0 |
1 |
1 |
II. |
Private Sector Banks |
15 |
16 |
3 |
3 |
17 |
18 |
0 |
0 |
0 |
0 |
35 |
37 |
| |
19 Axis Bank |
4 |
4 |
0 |
0 |
3 |
3 |
0 |
0 |
0 |
0 |
7 |
7 |
| |
20 HDFC Bank Ltd. |
2 |
2 |
0 |
0 |
2 |
3 |
0 |
0 |
0 |
0 |
4 |
5 |
| |
21 ICICI Bank Ltd. |
9 |
10 |
3 |
3 |
8 |
8 |
0 |
0 |
0 |
0 |
20 |
21 |
| |
22 IndusInd Bank Ltd. |
0 |
0 |
0 |
0 |
2 |
2 |
0 |
0 |
0 |
0 |
2 |
2 |
| |
23 Federal Bank Ltd. |
0 |
0 |
0 |
0 |
1 |
1 |
0 |
0 |
0 |
0 |
1 |
1 |
| |
24 Kotak Mahindra Bank Ltd. |
0 |
0 |
0 |
0 |
1 |
1 |
0 |
0 |
0 |
0 |
1 |
1 |
All Banks |
165 |
171 |
24 |
23 |
55 |
54 |
6 |
7 |
22 |
29 |
272 |
284 |
* Other Offices include marketing/sub-office, remittance centres, etc. Source: Reserve Bank. |
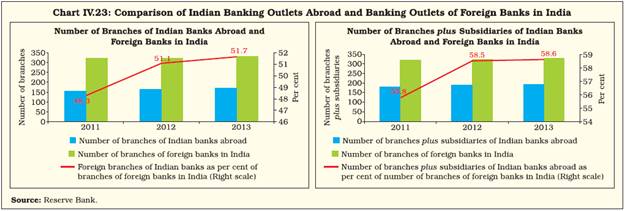 4.46 Although Indian banks had a subsidiarised presence abroad, foreign banks operated only as branches with no subsidiaries as at end-March 2013. Taking into account the number of branches plus subsidiaries, the presence of Indian banks in foreign markets has been growing at a much faster pace than the presence of foreign banks in India (Chart IV.23). Moreover, the expansion of overseas operations of Indian private sector banks has been relatively faster (Chart IV.24).
9. Technological Developments in Scheduled Commercial Banks
Double digit growth in ATMs driven mainly by private sector banks
4.47 The penetration of ATMs across the country increased in 2012-13 with the total number of ATMs crossing 1,00,000, clocking a double digit growth during the year (Table IV.27; Chart IV.25). This growth was driven primarily by private sector banks, with their share in total ATMs picking up rapidly to about 38 per cent.
Table IV.27: ATMs of Scheduled Commercial Banks
(As at end-March 2013) |
Sr. No |
Bank group |
On-site ATMs |
Off-site ATMs |
Total number of ATMs |
1 |
2 |
3 |
4 |
5 |
I |
Public sector banks |
40,241 |
29,411 |
69,652 |
| |
1.1 Nationalised banks* |
20,658 |
14,701 |
35,359 |
| |
1.2 SBI Group |
18,708 |
13,883 |
32,591 |
II |
Private sector banks |
15,236 |
27,865 |
43,101 |
| |
2.1 Old private sector banks |
4,054 |
3,512 |
7,566 |
| |
2.2 New private sector banks |
11,182 |
24,353 |
35,535 |
III |
Foreign banks |
283 |
978 |
1,261 |
IV |
All SCBs (I+II+III) |
55,760 |
58,254 |
1,14,014 |
Note: *: Excluding IDBI Bank Ltd. |
Faster rise in off-site ATMs, more spurt expected as White Label ATMs take off
4.48 While ATMs are an innovative means to provide basic banking services to customers in a much faster and cost-efficient manner, within these, off-site ATMs are particularly more costefficient since they operate without the paraphernalia of a bank branch. Over the years, the relative growth in off-site ATMs has been much more than that of on-site ATMs. As a result, by 2012-13, off-site ATMs accounted for more than half the total ATMs in the country (Appendix Table IV.7; Chart IV.26).
4.49 With the policy initiative to enable nonbank entities to set up and operate ATMs – White Label ATMs (WLAs) – the proportion of off-site ATMs is likely to grow further. So far, of the 18 entities that have approached the Reserve Bank for setting up WLAs, 12 have been granted inprinciple authorisation and of these, one has also been issued the Certificate of Authorisation. Accordingly, the first WLA became operational in Chandrapada (Tier V town) in Thane district, Maharashtra in June 2013.
Increased efficiency of cheque-based transactions under the Cheque Truncation System
4.50 The Cheque Truncation System (CTS) is a step towards improving the pace of clearance without involving end-to-end physical movement of cheques. Following the introduction of this system, there has been a quantum jump in the number of cheques processed through this system, particularly at New Delhi and Chennai, reflecting the growing acceptability of the system (Table IV.28). As the coverage of CTS is further widened by bringing more centres/areas under its umbrella, the volumes will grow further spreading the benefits of this system to a larger number of customers.
Table IV.28: Progress under Cheque Truncation System |
Volume (in million) |
Value (in ` billion) |
2011-12 |
2012-13 |
2011-12 |
2012-13 |
180 |
275 |
15,104 |
21,732 |
| |
(52.6) |
|
(43.9) |
Note: Figures in brackets indicate percentage change over the previous year. |
Debit cards are a more popular mode of electronic money than credit cards
4.51 So far, debit cards have been a more popular mode of electronic money than credit cards in India (Table IV.29; Chart IV.27). While public sector banks have been frontrunners in issuing debit cards, new private sector banks continue to lead in the number of credit cards issued.
Table IV.29: Credit and Debit Cards Issued by Scheduled
Commercial Banks (As at end-March) |
(in million) |
Sr. No |
Bank group |
Outstanding Number
of Credit Cards |
Outstanding Number
of Debit Cards |
2012 |
2013 |
2012 |
2013 |
| |
1 |
2 |
3 |
4 |
5 |
I |
Public sector banks |
3.1 |
3.5 |
214.6 |
260.6 |
| |
1.1 Nationalised banks* |
0.8 |
0.9 |
97.7 |
118.6 |
| |
1.2 SBI Group |
2.2 |
2.6 |
112.0 |
136.4 |
II |
Private sector banks |
9.7 |
11.1 |
60.0 |
67.3 |
| |
2.1 Old private sector banks |
0.04 |
0.04 |
13.9 |
15.4 |
| |
2.2 New private sector banks |
9.6 |
11.1 |
46.0 |
51.9 |
III |
Foreign banks |
4.9 |
5.0 |
3.8 |
3.3 |
IV |
All SCBs (I+II+III) |
17.7 |
19.5 |
278.4 |
331.2 |
Notes: 1. *: Excluding IDBI Bank Ltd.
2. Figures may not add up to the total due to rounding off. |
Sustained growth in electronic clearance and payments
4.52 There has been sustained growth in both the volume and value of all types of electronic transactions of SCBs in general and debit transactions in particular in recent years, a trend that continued in 2012-13 (Table IV.30). Both RTGS (meant for large value payments system, processing both customer and inter-bank transactions of `2,00,000 and above) and NEFT (a retail system) consistently posted double digit growth in terms of the volume of transactions routed through these systems.
Table IV.30: Volume and Value of Electronic Transactions by SCBs |
(Volume in million, Value in ` billion) |
Type of transaction |
Volume |
% change |
Value |
% change |
2011-12 |
2012-13 |
2012-13 |
2011-12 |
2012-13 |
2012-13 |
ECS Credit |
121.5 |
122.2 |
0.6 |
1,838 |
1,771 |
-3.6 |
ECS Debit |
165 |
177 |
7.2 |
834 |
1,083 |
29.9 |
Credit cards |
320 |
397 |
23.9 |
966 |
1,230 |
27.3 |
Debit cards |
328 |
469 |
43.2 |
534 |
743 |
39.1 |
NEFT |
226 |
394 |
74.3 |
17,904 |
29,022 |
62.1 |
RTGS |
55 |
69 |
24.5 |
5,39,308 |
6,76,841 |
25.5 |
Note: Percentage change could be slightly different as absolute numbers
have been rounded off to million or ` billion. |
Notwithstanding progress, there is scope for further improvement in the usage of electronic modes of payment
4.53 Notwithstanding the growth of various electronic modes of payment in India, it still has a long way to go in terms of achieving the high levels of penetration of such modes across the world, particularly in high income countries. It is noteworthy, however, that India stands out globally in terms of usage of mobile phones as a mode of payment (Table IV.31).
Table IV.31: Penetration of Electronic Modes of Payment |
Percentage of population of 15 years and above using |
World |
High Income |
Upper Middle Income |
Middle Income |
India |
Lower Middle Income |
Low Income |
Credit card |
14.8 |
49.8 |
11.8 |
7.1 |
1.8 |
2.2 |
1.9 |
Debit card |
30.4 |
61.4 |
38.6 |
24.8 |
8.4 |
10.1 |
7.4 |
Electronic mode to make payments (wire and online transfers) |
14.5 |
55.2 |
8.2 |
5.3 |
2.0 |
2.3 |
1.9 |
Mobile phone to pay bills |
2.0 |
- |
1.7 |
1.8 |
2.2 |
2.0 |
2.6 |
Note: Data relate to 2011.
Source: Global Findex (Global Financial Inclusion Database), World Bank. |
4.54 The usage of electronic modes of payments/ transfers can help in reducing the costs of operation for banks, the benefit of which can be transferred to customers (Box IV.4).
Further progress in data transfer from banks to the regulator under Automated Data Flow Project
4.55 The Automated Data Flow (ADF) Project was initiated by the Reserve Bank to automate flow of data from banks’ internal systems to a centralised environment and then to the regulator in an accurate and timely manner without manual intervention. There is continued progress under ADF and as at end-June 2013, about 80 per cent of the returns of a majority of the banks had been brought under this system. Further, banks have initiated the setting up of a Returns Governance Group (RGG), comprising officials from compliance, business and technology.
Box IV.4:
Banking Technology and Cost Reduction: A Perspective
Studies reveal that technological advancement is commonly accompanied by real cost reduction in the production process15. The two major advantages of technological adoption are: (a) reduction in banks’ operational costs (the cost advantage); (b) facilitating more efficient transactions among customers within the same network (the network effect). Eyadat and Kozak (2005) showed a positive correlation between the level of implemented technology and profitability/cost savings between 1992 and 2003 for the US banking sector. Berger (2003) also showed improvements in bank performance and consolidation of the banking industry in the US by deployment of new technologies. The study for the Indian banking sector for the period 2005-06 to 2009-10 too suggested efficiency gains resulting from technological innovations and investment in IT (Rajput and Gupta, 2011).
Globally, there has been a rapid advancement in Information and Communication Technology (ICT), which has reflected in banks’ business strategies, customer services and organisational structures, among others. Innovative adoption in the form of internet banking, ATMs and mobile applications have created a profound impact on the delivery channels of banking services. Also, a number of innovative developments in retail payments have emerged, which affect the retail payment market by influencing users in their choice of payment instruments and by significantly reshaping the payment processes.
The Report of the Working Group on Innovations in Retail Payments (May 2012) set up by the Committee on Payment and Settlement Systems (CPSS) provides an overview of innovative retail payment activities in CPSS and other select countries over the past decade. Based on the trends observed, the Report identified a number of exogenous and endogenous factors that serve as drivers for retail payment innovations or as barriers to them. The Report categorised the purposes of innovation across countries into two main groups, namely “improved efficiency” and “improved security”. The former was divided into several subcategories, such as reduced cash usage, lower processing costs, improved convenience and inclusion of the unbanked/under-banked. In this regard, an important trend identified by the Report was that financial inclusion served as a driving force for innovations in many countries, either under a government mandate or because of the new business opportunities opened up by the untapped market.
Developing countries with an under-developed payment infrastructure have higher potential for introducing innovative payment solutions, and thereby even leapfrogging some of the advanced countries in terms of the usual steps for developing retail payment instruments/infrastructure. M-PESA, which was launched in 2007 in Kenya, is an example of such a technological innovation. M-PESA users can use their mobile phones to transfer money to another mobile phone user. The system provides a safe, secure and fast money transfer facility at a very low cost. There has been wide acceptance of the system in view of the benefits derived. As per a study, M-banking has dramatically reduced the cost of delivering financial services16. About 85 per cent of M-banking customers in the survey registered lower transaction costs. It is also observed that M-banking reduced the cost of basic banking services to customers by about 60 per cent from the costs incurred through traditional channels.
M-Pesa has been so successful in Kenya mainly due to the large demand for financial services which has not been met adequately by the Kenyan banking sector. In India, on the other hand, the reach of the banking sector has been wider and the focus has been on the bank-led model for financial inclusion. Further, mobile-led banking can take care of only remittance products as against a bouquet of products, viz., deposit product and overdraft/emergency credit product, which are being provided as part of the financial inclusion policy in India. However, efforts are being made to leverage the reach of mobile phones by allowing banks to appoint Business Correspondents (BCs) for financial inclusion.
References:
Berger, A.N. (2003), “The Economic Effects of Technological Progress: Evidence from the Banking Industry”, Journal of Money, Credit and Banking, 35.
BIS (2012), Innovations in Retail Payments – A Report, CPSS, Basel.
Eyadat, M. and S. Kozak (2005), “The Role of Information Technology in the Profit and Cost Efficiency Improvements of the Banking Sector”, Journal of Academy of Business and Economics.
Musara, M. and M. Fatoki (2010), “Has Technological Innovations resulted in Increased Efficiency and Cost Savings for Banks’ Customers?”, African Journal of Business Management, 4(9).
Njenga, A. K. (2009), “Mobile Phone Banking: Usage Experiences in Kenya”, <www.w3.org>.
Rajput, N. and M. Gupta (2011), “Impact of IT on Indian Commercial Banking Industry: DEA Analysis”, Global Journal of Enterprise Information System, 3(1).
10. Customer Service
Rising share of Tier II cities in total complaints about SCBs, indicating growing awareness among customers
4.56 The Banking Ombudsman offices in Tier I cities (New Delhi, Mumbai, Chennai, Kolkata, Bengaluru and Hyderabad) account for more than half the total complaints received by all 15 offices. However, the increasing share of complaints received by Banking Ombudsman offices in Tier II cities in recent period suggests the growing awareness about this grievance redressal mechanism among customers from smaller towns (Table IV.32; Chart IV.28).
Table IV.32: Region-wise Complaints received at Banking
Ombudsman Offices |
BO office |
Number of Complaints |
Percentage Variation |
2011-12 |
2012-13 |
2012-13 |
Ahmedabad |
4,590 |
4,838 |
5.4 |
Bengaluru |
3,486 |
3,318 |
-4.8 |
Bhopal |
5,953 |
4,920 |
-17.4 |
Bhubaneswar |
1,826 |
1,523 |
-16.6 |
Chandigarh |
3,521 |
3,094 |
-12.1 |
Chennai |
6,614 |
7,255 |
9.7 |
Guwahati |
708 |
807 |
14.0 |
Hyderabad |
5,167 |
4,303 |
-16.7 |
Jaipur |
4,209 |
4,099 |
-2.6 |
Kanpur |
9,633 |
9,012 |
-6.4 |
Kolkata |
4,838 |
4,388 |
-9.3 |
Mumbai |
7,905 |
8,607 |
8.9 |
New Delhi |
9,180 |
9,444 |
2.9 |
Patna |
2,718 |
2,785 |
2.5 |
Thiruvananthapuram |
2,541 |
2,148 |
-15.5 |
Total |
72,889 |
70,541 |
-3.2 |
Note: Includes SCBs, RRBs and UCBs.
Source: Various Regional Offices of Banking Ombudsman. |
Importance of complaints relating to Fair Practices Code and BCSBI Code too indicates improved awareness among customers
4.57 Although complaints about ATM/credit/ debit cards continued to dominate, accounting for about one-fourth of the total number of complaints in 2012-13, complaints relating to non-adherence to the Fair Practices Code and non-adherence of the codes laid down by the Banking Codes and Standards Board of India (BCSBI) came next in line (Appendix Table IV.8; Chart IV.29). The share of complaints relating to these codes has been on a rising trend in recent years, again indicating the improved level of awareness among customers about these codes and their adherence by banks.
Greater number of complaints about foreign and private sector banks per bank branch/ account
4.58 Although public sector banks accounted for a larger share in the total number of complaints, when normalised by the number of bank branches and accounts (deposit + loan accounts), the number of complaints about foreign banks worked out to be the highest followed by private sector banks (Chart IV.30). In 2012-13, there were 1,543 complaints per 100 bank branches of foreign banks, highest among all bank groups.
11. Financial Inclusion
Considerable progress after the completion of the three-year Financial Inclusion Plans
4.59 In 2010, SCBs adopted Board-approved Financial Inclusion Plans (FIPs) containing self-set targets for financial inclusion for a span of three years. In 2013, banks completed three years under these plans. Taking stock of the developments over the last three years indicates considerable progress with regard to financial inclusion; the major findings can be listed as follows (Table IV.33):
-
Almost all identified unbanked villages with a population of more than 2,000 have been covered with a banking outlet;
-
Greater attention is now being given to unbanked villages with a population of less than 2,000; there has been a steep rise in the number of villages with a population of less than 2,000, which were provided with banking outlets between 2012 and 2013 (Chart IV.31).
-
Dominance of BCs in the provision of banking services to villages as well as urban locations – The villages with a population of more/less than 2,000 are being provided with a banking outlet through branch, BCs and other (ICT-based) modes. Among these three, there is a dominance of BCs in the provision of banking services over opening bank branches. BCs have also been an important means of providing banking services to urban locations.
Table IV.33: Progress under Financial Inclusion Plans, All SCBs including RRBs |
No. |
Variable |
Mar-10 |
Mar-11 |
Mar-12 |
Mar-13 |
Absolute change (2010-2013) |
Percentage change (2010-2013) |
1 |
Banking Outlets in Villages >2,000 |
37,949 |
66,605 |
1,12,288 |
1,19,453 |
81,504 |
214.8 |
2 |
Banking Outlets in Villages <2,000 |
29,745 |
49,603 |
69,465 |
1,49,001 |
1,19,256 |
400.9 |
3 |
Banking Outlets in Villages - Branches |
33,378 |
34,811 |
37,471 |
40,837 |
7,459 |
22.3 |
4 |
Banking Outlets in Villages - BCs |
34,174 |
80,802 |
1,41,136 |
2,21,341 |
1,87,167 |
547.7 |
5 |
Banking Outlets in Villages - Other Modes |
142 |
595 |
3,146 |
6,276 |
6,134 |
4,319.7 |
6 |
Banking Outlets in Villages - Total |
67,694 |
1,16,208 |
1,81,753 |
2,68,454 |
2,00,760 |
296.6 |
7 |
Urban Locations covered through BCs |
447 |
3,771 |
5,891 |
27,143 |
26,696 |
5,972.3 |
8 |
Basic Savings Bank Deposit Account (BSBDA) through branches (No. in million) |
60 |
73 |
81 |
101 |
41 |
67.5 |
9 |
Basic Savings Bank Deposit Account (BSBDA) through branches (Amt. in ` billion) |
44 |
58 |
110 |
165 |
120 |
271.5 |
10 |
Basic Savings Bank Deposit Account (BSBDA) through BCs (No. in million) |
13 |
32 |
57 |
81 |
68 |
512.4 |
11 |
Basic Savings Bank Deposit Account (BSBDA) through BCs (Amt. in ` billion) |
11 |
18 |
11 |
18 |
8 |
70.4 |
12 |
BSBDA Total (in million) |
73 |
105 |
139 |
182 |
109 |
147.9 |
13 |
BSBDA Total (Amt. in ` billion) |
55 |
76 |
120 |
183 |
128 |
232.5 |
14 |
OD facility availed in Basic Savings Bank Deposit Account (No. in million) |
0.2 |
1 |
3 |
4 |
4 |
2,094.4 |
15 |
OD facility availed in Basic Savings Bank Deposit Account (Amt. in ` billion) |
0.1 |
0.3 |
1 |
2 |
1.5 |
1,450.0 |
16 |
KCCs Total (No. in million) |
24 |
27 |
30 |
34 |
9 |
39.0 |
17 |
KCCs Total (Amt. in ` billion) |
1,240 |
1,600 |
2,068 |
2,623 |
1,383 |
111.5 |
18 |
GCCs Total (No. in million) |
1 |
2 |
2 |
4 |
2 |
161.2 |
19 |
GCCs Total (Amt. in ` billion) |
35 |
35 |
42 |
76 |
41 |
117.4 |
20 |
ICT A/Cs-BC Total Transactions (No. in million) |
27 |
84 |
156 |
250 |
224 |
844.4 |
21 |
ICT A/Cs-BC Total Transactions (Amt. in ` billion) |
7 |
58 |
97 |
234 |
227 |
3,279.8 |
Note: Absolute and percentage variation could be slightly different as numbers have been rounded off to million/billion.
Source: Reserve Bank. |
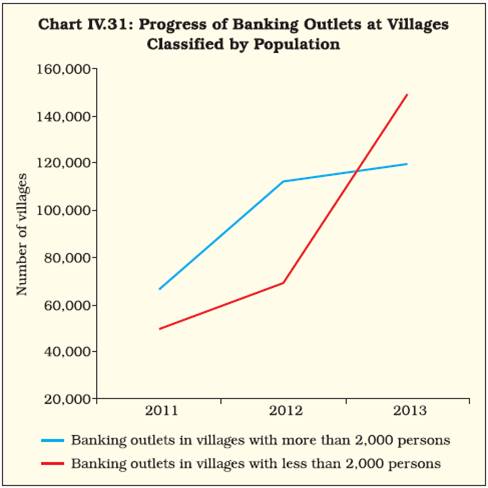 4.60 Apart from these data-based findings, certain useful insights were also provided by the surveys undertaken by the Reserve Bank across all regions in the country about the financial inclusion initiatives (Box IV.5).
Box IV.5:
A Survey-based Analysis of Financial Inclusion
Financial inclusion has been embedded as an objective of economic policy in India since independence. However, since 2005, it has been an explicit policy endeavour of the Reserve Bank. Various policy initiatives have been undertaken by both the Reserve Bank as well as the Government of India to ensure universal financial access especially post-2005. Against this backdrop, there is an often-felt dearth of information about the extent of both demand for banking services and impact that the policy of financial inclusion has had at the ground level. In order to address this gap, the surveys in 14 select villages of Madhya Pradesh, Odisha, Andhra Pradesh and Rajasthan belonging to four geographical regions of the country, were conducted by the concerned regional offices of the Reserve Bank. The surveys were conducted using structured questionnaires and covered 8,246 households and a total population of 34,149.
Agriculture was the main occupation in a majority of the villages. The distance from the banking outlet in the case of these villages was on an average 10 kms. Men and women were in an almost equal proportion in the survey sample.
Key findings of the survey are set out in the Table below.
Several interesting conclusions emerge from the study, which provide important policy inputs. The study shows that there is financial awareness and demand for banking services in rural areas. Hence, if access can be provided, usage of banking services will improve. Major factors hindering access are the non-availability of banking outlets and long distance of existing banking outlets. The usage of basic banking products, viz., deposits and credit is widespread but usage of overdraft and EBT is low due to insufficient awareness about the availability of such facilities. Greater inclusion will involve
-
Making banking outlets available or closer to the villagers.
-
Creating product-specific awareness to ensure greater usage of these products.
-
Creating greater awareness about banking services among women and among rural households with relatively low incomes.
-
Formulation of products linked to income status of the borrowers thereby providing them opportunities for using banking products and services.
Table: Major Findings from the Study |
Parameters |
Findings |
1 |
Degree of financial awareness – Awareness about the availability of banking products and services |
Reasonable degree of awareness – 76 per cent of the villagers were aware of the services offered by banks.
Gender – The awareness was proportionately more among men.
Age – There was no definite relation between age and the extent of financial awareness. About 91 per cent from the age group 18-25 years were financially aware. In the age group 26-60 years, only 74 per cent were aware but in the age group 60 years and above, 82 per cent were financially aware.
Income – There was no definite relation between income and extent of financial awareness. Of the villagers with an annual income of up to `50,000, 89 per cent were financially aware. In the income group `0.1-0.3 million, 42 per cent were aware, whereas in the income group `0.3 million and above, all were financially aware. |
2 |
Usage of banking products |
|
| |
a. Savings account |
Usage of savings accounts was the highest – About 74 per cent of the villagers had a savings account. |
| |
b. Credit products |
Usage of credit products was second – About 34 per cent of the villagers were availing of loan facilities (including KCC/GCC). |
| |
c. Remittance |
Remittance facilities were the next – About 24 per cent of the villagers were availing of the remittance facility. |
| |
d. OD in savings account |
Usage of OD was most limited among villagers – Only 12 per cent of the villagers were availing of the OD facility in the savings bank account. |
| |
e. Electronic Benefit Transfer (EBT) |
Usage of EBT was also limited – Only 15 per cent of villagers were availing of the EBT facility. |
Source: Reserve Bank. |
Rise in the number of newly opened branches at Tier 5 and 6 /rural centres
4.61 During the last three years, there was a rise in the number of newly opened branches in Tier 5 and 6 centres. In 2012-13, of the total newly opened branches, around 41 per cent were opened in these two centres taken together. These two centres together refer to centres having a population of less than 10,000 persons, indicating “rural” centres in the country (Table IV.34).
Table IV.34: Tier-wise Break up of Newly
Opened Bank Branches |
Tier |
2010-11 |
2011-12 |
2012-13P |
Tier 1 |
1,942 |
2,235 |
1,752 |
Tier 2 |
449 |
642 |
791 |
Tier 3 |
1,167 |
1,241 |
1,006 |
Tier 4 |
663 |
823 |
727 |
Tier 5 |
580 |
979 |
1,114 |
Tier 6 |
877 |
1,553 |
1,823 |
Total |
5,678 |
7,473 |
7,213 |
P: Provisional.
Source: Reserve Bank. |
Growing proportion of newly opened branches at unbanked centres across all regions
4.62 Of the total number of newly opened branches in 2012-13, 25 per cent were opened in unbanked centres; the remaining 75 per cent were opened in centres that were already banked. However, it is noteworthy that the proportion of branches opened in unbanked centres has witnessed a consistent increase in recent years (Chart IV.32). This rise could be seen across all regions in the country.
Signs of narrowing of regional gap in terms of banking penetration
4.63 On account of the increased penetration of branches, the major beneficiaries have been the under-banked regions, viz., the north-eastern, eastern and central regions. Consequently, the regional gap in terms of banking penetration has narrowed over recent years as shown by a steady decline in the range (maximum-minimum) in the population per bank branch (Chart IV.33).
Rising share of ATMs opened in rural and semi-urban centres
4.64 Although urban and metropolitan centres account for over 65 per cent of the total number of ATMs in the country, there has been a rising trend in the share of ATMs located in rural and semi-urban centres in the recent years (Table IV.35; Chart IV.34).
Table IV.35: Number of ATMs of SCBs at Various Centres
(At end-March 2013) |
Bank group |
Rural |
Semi-urban |
Urban |
Metro-politan |
Total |
1 |
2 |
3 |
4 |
5 |
6 |
Public Sector Banks |
8,552 |
18,445 |
22,518 |
20,137 |
69,652 |
| |
(12.3) |
(26.5) |
(32.3) |
(28.9) |
(100.0) |
Nationalised Banks* |
4,406 |
8,283 |
10,873 |
11,797 |
35,359 |
| |
(12.5) |
(23.4) |
(30.8) |
(33.4) |
(100.0) |
SBI Group |
4,053 |
9,847 |
10,912 |
7,779 |
32,591 |
| |
(12.4) |
(30.2) |
(33.5) |
(23.9) |
(100.0) |
Private Sector Banks |
2,982 |
9,244 |
13,349 |
17,526 |
43,101 |
| |
(6.9) |
(21.4) |
(31.0) |
(40.7) |
(100.0) |
Old Private Sector Banks |
768 |
2,760 |
2,354 |
1,684 |
7,566 |
| |
(10.2) |
(36.5) |
(31.1) |
(22.3) |
(100.0) |
New Private Sector Banks |
2,214 |
6,484 |
10,995 |
15,842 |
35,535 |
| |
(6.2) |
(18.2) |
(30.9) |
(44.6) |
(100.0) |
Foreign Banks |
30 |
21 |
244 |
966 |
1,261 |
| |
(2.4) |
(1.7) |
(19.3) |
(76.6) |
(100.0) |
Total |
11,564 |
27,710 |
36,111 |
38,629 |
1,14,014 |
| |
(10.1) |
(24.3) |
(31.7) |
(33.9) |
(100.0) |
Growth over previous year |
33.9 |
22.2 |
16.5 |
15.8 |
19.2 |
Note: Figures in parentheses indicate percentage share of total ATMs
under each bank group.
*Excludes IDBI Bank Ltd. |
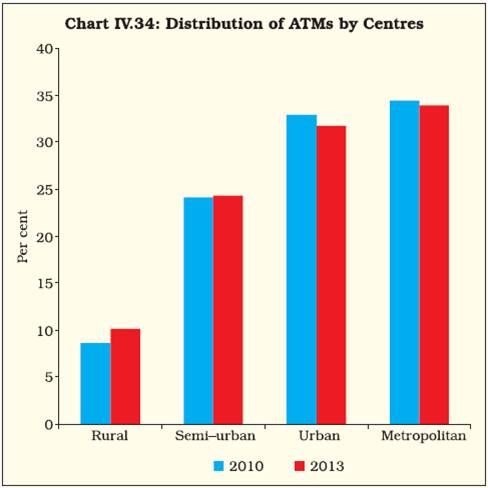 Steady progress in the delivery of microfinance through the dual arrangement of SHGs and JLGs
4.65 As in the past, there was a steady progress in the delivery of microfinance through self-help groups (SHGs). Joint liability groups (JLGs) too have emerged as successful non-collateralised credit instruments for financing livelihood activities for small farmers in general and tenant cultivators in particular. The SHG-bank linkage continues to be a more dominant mode of microfinance with banks financing over 1 million SHGs in 2012-13 (Table IV.36).
Table IV.36: Progress of Microfinance Programmes (As at end-March) |
Item |
Self-Help Groups |
Number (in million) |
Amount (` billion) |
2009-10 |
2010-11 |
2011-12 |
2012-13P |
2009-10 |
2010-11 |
2011-12 |
2012-13P |
Loans disbursed by banks |
1.6 |
1.2 |
1.2 |
1.2 |
145 |
145 |
165 |
206 |
| |
(0.3) |
(0.2) |
(0.2) |
(0.2) |
(22) |
(25) |
(26) |
(22) |
Loans outstanding with banks |
4.9 |
4.8 |
4.4 |
4.5 |
280 |
312 |
363 |
394 |
| |
(1.3) |
(1.3) |
(1.2) |
(1.2) |
(63) |
(78) |
(81) |
(86) |
Savings with banks |
7.0 |
7.5 |
8.0 |
7.3 |
62 |
70 |
66 |
82 |
| |
(1.7) |
(2.0) |
(2.1) |
(2.1) |
(13) |
(18) |
(14) |
(18) |
| |
Microfinance Institutions |
Number |
Amount (` billion) |
Loans disbursed by banks |
691 |
469 |
465 |
426 |
81 |
76 |
53 |
78 |
Loans outstanding with banks |
1,513 |
2,176 |
1,960 |
2,042 |
101 |
107 |
115 |
144 |
| |
Joint Liability Groups |
Number (in million) |
Amount (` billion) |
| |
- |
0.09 |
0.19 |
0.20 |
- |
7 |
17 |
18 |
Note: Figures in brackets indicate the details about SHGs covered under Swarnajayanti Gram Swarozgar Yojana (SGSY).
P: Provisional.
Source: NABARD. |
A decline in the number of MFIs financed by banks
4.66 By contrast, in recent years, there has been a decline in the number of microfinance institutions (MFIs) financed by banks. In part, this could be attributed to concerns about the operations of certain MFIs in Andhra Pradesh and the regulatory initiatives in response to these concerns in the recent past (Table IV.36).
12. Local Area Banks
LABs remain profitable
4.67 The profitability of LABs at the aggregate level measured by RoA has been fairly higher than that of SCBs (Table IV.37 read with Table IV.8). However, in terms of efficiency, measured by NIM, LABs tend to lag behind SCBs.
Table IV.37: Financial Performance of Local Area Banks |
(Amount in ` billion) |
| |
Amount |
Percentage Variation |
2011-12 |
2012-13 |
2011-12 |
2012-13 |
1 |
2 |
3 |
4 |
5 |
1. |
Income (i+ii) |
1.5 |
1.8 |
0.3 |
18.7 |
| |
i) Interest income |
1.4 |
1.6 |
0.3 |
19.9 |
| |
ii) Other income |
0.2 |
0.2 |
0.0 |
8.7 |
2. |
Expenditure (i+ii+iii) |
1.3 |
1.6 |
0.2 |
17.4 |
| |
i) Interest expended |
0.8 |
1.0 |
0.2 |
25.2 |
| |
ii) Provisions and contingencies |
0.1 |
0.1 |
0.0 |
-20.3 |
| |
iii) Operating expenses |
0.4 |
0.5 |
0.1 |
15.9 |
| |
of which : Wage Bill |
0.2 |
0.3 |
0.0 |
23.8 |
3. |
Profit |
|
|
|
|
| |
i) Operating Profit/Loss |
0.3 |
0.4 |
0.0 |
7.1 |
| |
ii) Net Profit/Loss |
0.2 |
0.2 |
0.1 |
27.7 |
4. |
Net Interest Income |
0.6 |
0.7 |
0.1 |
13.2 |
5. |
Total Assets |
13.6 |
15.8 |
2.1 |
15.6 |
6. |
Financial Ratios @ |
|
|
|
|
| |
i) Operating Profit |
2.6 |
2.4 |
- |
- |
| |
ii) Net Profit |
1.5 |
1.6 |
- |
- |
| |
iii) Income |
12.3 |
12.3 |
- |
- |
| |
iv) Interest Income |
11.0 |
11.1 |
- |
- |
| |
v) Other Income |
1.3 |
1.2 |
- |
- |
| |
vi) Expenditure |
10.8 |
10.7 |
- |
- |
| |
vii) Interest Expended |
6.2 |
6.5 |
- |
- |
| |
viii) Operating Expenses |
3.6 |
3.5 |
- |
- |
| |
ix) Wage Bill |
1.7 |
1.7 |
- |
- |
| |
x) Provisions and Contingencies |
1.1 |
0.8 |
- |
- |
| |
xi) Net Interest Income |
4.9 |
4.6 |
- |
- |
Note: Percentage variation and ratios could be slightly different as absolute numbers have been rounded off to ` billion.
@ Ratios to Total Average Assets.
Source: Based on off-site returns. |
Operations and future expansion of LABs: Need for review
4.68 Notwithstanding their better profitability, there are few issues about the operations of LABs and their future expansion. First, LABs remain a miniscule portion of the entire banking system (0.02 per cent of the asset size of SCBs), with considerable concentration of the banking business in one LAB of the four LABs, Capital Local Area Bank (accounting for 72 per cent of the total assets of all four LABs) (Table IV.38). Second, contrary to the recommendations of the Review Group of 2002 which looked into the working of LABs, no LAB except the Capital Local Area Bank could step up its net worth to `250 million to improve financial soundness. Notwithstanding these constraints, these institutions show promise of small-scale banking institutions that can be experimented with on a larger scale in future. The Reserve Bank Discussion Paper “Banking Structure in India: The Way Forward” has hence recommended the creation of more number of smaller banks in the private sector with the objective of achieving financial inclusion at the local level. Such banks pose less threat to systemic stability given their limited-area operations with little financial interconnectedness. However, smaller banks should be promoted only after putting in place adequate safeguards in the form of corporate governance and a stronger resolution framework to handle the possibility of higher mortality.
Table IV.38: Profile of Local Area Banks (As at end-March) |
(Amount in ` billion) |
Bank |
Assets |
Deposits |
Gross Advances |
2012 |
2013 |
2012 |
2013 |
2012 |
2013 |
1 |
2 |
3 |
4 |
5 |
6 |
7 |
Capital Local Area Bank Ltd. |
9.67 |
11.40 |
8.20 |
9.78 |
5.18 |
6.06 |
| |
(71.0) |
(72.3) |
(73.8) |
(74.8) |
(67.2) |
(67.1) |
Coastal Local Area Bank Ltd. |
1.93 |
2.21 |
1.51 |
1.74 |
1.26 |
1.56 |
| |
(14.2) |
(14.0) |
(13.6) |
(13.3) |
(16.4) |
(17.3) |
Krishna Bhima Samruddhi Local Area Bank Ltd. |
1.35 |
1.44 |
1.00 |
1.15 |
0.84 |
0.96 |
| |
(9.9) |
(9.1) |
(9.0) |
(8.8) |
(10.9) |
(10.6) |
Subhadra Local Area Bank Ltd. |
0.68 |
0.72 |
0.39 |
0.41 |
0.43 |
0.45 |
| |
(5.0) |
(4.5) |
(3.5) |
(3.1) |
(5.6) |
(5.0) |
All LABs |
13.63 |
15.76 |
11.10 |
13.07 |
7.71 |
9.03 |
| |
(100.0) |
(100.0) |
(100.0) |
(100.0) |
(100.0) |
(100.0) |
Note: Figures in parentheses indicate percentage share in total.
Source: Based on off-site returns (domestic). |
13. Regional Rural Banks
Recapitalisation of RRBs is in progress to enable them to achieve a CRAR of 9 per cent
4.69 Following the recommendations of the Committee (Chairman: Dr. K. C. Chakrabarty) to improve the capital base of RRBs enabling them to achieve a CRAR of 9 per cent by March 2012, the recapitalisation of these institutions has been in progress. As per the Committee’s assessment, 40 RRBs will require capital infusion to the extent of `22 billion in order to achieve this norm.
4.70 As at end-March 2013, out of 40 RRBs earmarked for recapitalisation, 35 RRBs were recapitalised fully and 2 RRBs were recapitalised partially. The process of recapitalisation had not started in the remaining three RRBs. The period for completion of the entire process has been extended up to March 2014 by the Government of India.
A new phase in the amalgamation of RRBs has begun
4.71 So far, there have been two broad phases in the amalgamation of RRBs. In the first phase (September 2005-March 2010), RRBs of the same sponsor banks within a State were amalgamated bringing down their number to 82 from 196. In the second and ongoing phase, starting from October 2012, geographically contiguous RRBs within a State under different sponsor banks would be amalgamated to have just one RRB in medium-sized States and two/three RRBs in large States. In the current phase, 31 RRBs have been amalgamated into 13 new RRBs within 9 States to bring down their effective number to 64. These States include Uttar Pradesh, Madhya Pradesh, Uttarakhand, Odisha, Bihar, Karnataka, Rajasthan, Himachal Pradesh and Maharashtra.
A higher growth in the balance sheets of RRBs
4.72 In the year when the balance sheets of SCBs showed signs of contraction, there was an expansion in the balance sheet growth of RRBs (Table IV.39). However, both credit – the largest component on the assets side, and deposits – the largest component on the liabilities side posted a slower growth during the year (Tables IV.39; IV.40). Despite the lower growth in credit off-take, RRBs could maintain their RoA at the previous year’s level (Table IV.41).
Table IV.39: Consolidated Balance Sheet of Regional Rural Banks |
(Amount in ` billion) |
Sr. No. |
Item |
At end-March |
Percentage Variation |
2012 |
2013P |
2011-12 |
2012-13P |
1 |
Share Capital |
2 |
2 |
0.0 |
0.0 |
2 |
Reserves |
113 |
132 |
17.7 |
17.0 |
3 |
Share Capital Deposits |
50 |
57 |
22.7 |
14.6 |
4 |
Deposits |
1,863 |
2,085 |
12.1 |
11.9 |
| |
4.1 Current |
104 |
115 |
12.8 |
11.2 |
| |
4.2 Savings |
986 |
1,069 |
8.2 |
8.4 |
| |
4.3 Term |
774 |
900 |
17.4 |
16.3 |
5 |
Borrowings |
303 |
379 |
14.3 |
25.1 |
| |
5.1 from NABARD |
211 |
297 |
31.7 |
40.9 |
| |
5.2 Sponsor Bank |
88 |
74 |
-10.4 |
-16.0 |
| |
5.3 Others |
4 |
8 |
-199.4 |
97.6 |
6 |
Other Liabilities |
94 |
103 |
7.4 |
9.0 |
| |
Total Liabilities/Assets |
2,425 |
2,758 |
12.6 |
13.7 |
7 |
Cash in Hand |
23 |
22 |
6.3 |
-2.3 |
8 |
Balances with RBI |
88 |
83 |
-10.2 |
-6.7 |
9 |
Other Bank Balances |
478 |
619 |
5.9 |
29.3 |
10 |
Investments |
602 |
620 |
11.2 |
3.0 |
11 |
Loans and Advances (net) |
1,130 |
1,309 |
19.3 |
15.8 |
12 |
Fixed Assets |
6.7 |
7.3 |
46.4 |
9.4 |
13 |
Other Assets # |
96 |
98 |
8.9 |
1.5 |
Notes: 1. #: Includes accumulated losses.
2. Percentage variation could be slightly different as absolute numbers have been rounded off to ` billion.
3. P – Provisional.
Source: NABARD. |
Table IV.40: Purpose-wise Outstanding Advances by RRBs |
(Amount in ` billion) |
Sr. No |
Purpose/End-March |
2012 |
2013P |
1 |
2 |
3 |
4 |
I |
Agriculture (i to iii) |
638 |
752 |
| |
Per cent to total loans outstanding |
54.8 |
53.8 |
| |
i Short-term credit (crop loans) |
466 |
551 |
| |
ii Term loans (for agriculture and allied activities) |
172 |
201 |
| |
iii Indirect advances |
- |
- |
II |
Non-agriculture (i to iv) |
526 |
645 |
| |
Per cent to total loans outstanding |
45.2 |
46.2 |
i |
Rural artisans, etc. |
10 |
11 |
ii |
Other industries |
37 |
42 |
iii |
Retail trade, etc. |
58 |
62 |
iv |
Other purposes |
420 |
530 |
| |
Total (I+II) |
1,164 |
1,397 |
| |
Memo item : |
|
|
(a) |
Priority sector |
955 |
1,143 |
(b) |
Non-Priority sector |
208 |
253 |
| |
Share of priority sector (per cent to total) |
82.1 |
81.8 |
P: Provisional.
Source: NABARD. |
Table IV.41: Financial Performance of Regional Rural Banks |
(Amount in ` billion) |
Sr. No. |
Item |
Amount |
Percentage Variation |
2011-12 (82) |
2012-13* (64) |
2011-12 |
2012-13* |
1 |
2 |
3 |
4 |
5 |
6 |
A |
Income (i + ii) |
200 |
208 |
23.6 |
3.7 |
| |
i Interest income |
189 |
196 |
24.3 |
3.3 |
| |
ii Other income |
11 |
12 |
12.3 |
11.0 |
B |
Expenditure (i+ii+iii) |
182 |
186 |
24.7 |
2.3 |
| |
i Interest expended |
112 |
118 |
30.5 |
4.8 |
| |
ii Operating expenses |
55 |
54 |
12.3 |
-2.1 |
| |
of which, Wage bill |
40 |
39 |
4.0 |
-2.6 |
| |
iii Provisions and contingencies |
14.5 |
14.3 |
35.2 |
-1.0 |
C |
Profit |
|
|
|
|
| |
i Operating profit |
33 |
36 |
21.7 |
9.8 |
| |
ii Net profit |
19 |
22 |
14.4 |
17.2 |
D |
Total assets |
2,425 |
2,758 |
12.6 |
13.7 |
E |
Financial ratios # |
|
|
|
|
| |
i Operating profit |
1.4 |
1.4 |
|
|
| |
ii Net profit |
0.8 |
0.8 |
|
|
| |
iii Income (a + b) |
8.8 |
8.0 |
|
|
| |
(a) Interest income |
8.3 |
7.5 |
|
|
| |
(b) Other income |
0.5 |
0.5 |
|
|
| |
iv Expenditure (a+b+c) |
7.9 |
7.2 |
|
|
| |
(a) Interest expended |
4.9 |
4.5 |
|
|
| |
(b) Operating expenses |
2.4 |
2.1 |
|
|
| |
of which, Wage Bill |
1.7 |
1.5 |
|
|
| |
(c) Provisions and contingencies |
0.6 |
0.6 |
|
|
*: Provisional data (excluding Tripura GB) as audited data for the year
were not finalised.
Notes: 1. #: Financial ratios are percentages with respect to average total assets.
2. Percentage variation could be slightly different as absolute numbers have been rounded off to ` billion.
Source: NABARD and Reserve Bank. |
14. Overall Assessment
4.73 The operations and performance of the Indian banking sector in 2012-13 were broadly conditioned by (i) persistent slowdown of the domestic economy coupled with a tepid global recovery; (ii) moderation in interest rates; and (iii) high FII inflows leading to a general buoyancy in the Indian capital markets. Apart from these macro-economic developments, several policy measures initiated during the recent past, including provisioning requirements for restructured advances, changes in priority sector definitions and targets, among others, as discussed in Chapter III, also influenced the operations of the Indian banking sector. The salient features of the operations of SCBs in 2012-13 can be summarised as follows:
Slowdown in the overall growth of the banking sector, particularly bank credit
4.74 Both balance sheet and off-balance sheet operations of Indian banks slowed down in 2012- 13 for the second consecutive year. There was an overall slowdown in credit growth though retail credit remained buoyant. The slowdown was widespread across all bank groups except the SBI Group.
Slowdown in profitability with low credit offtake affecting interest earnings
4.75 The lower credit off-take despite the softening of interest rates affected the profits of SCBs with all major indicators of profitability, viz., return on assets (RoA) and return on equity (RoE) showing a decline during the year. New private sector banks and foreign banks, however, could improve their RoA with the help of reduced operational costs.
Pressures with regard to asset quality persisted
4.76 The NPA ratio increased further during 2012-13. There was a rise in the slippage ratio as well as the ratio of restructured advances to gross advances. Also, the increasing shift of loan assets into the “doubtful” category reflected a deepening deterioration within NPAs. The increased stress in asset quality during the year was primarily on account of industrial and infrastructural sectors.
Capital adequacy positions remained strong
4.77 The capital adequacy positions of SCBs remained above the stipulated norm at the aggregate and bank group-levels. However, there was a trend of deterioration in the capital positions of public sector banks.
Signs of considerable progress in inclusive banking
4.78 With the completion of three years of financial inclusion plans, there were signs of considerable progress in terms of expanding the outreach of banking through both branch and non-branch means. There was a steady rise in the number of newly opened branches in Tier 5/6 centres with a population of less than 10,000 during 2010-13. While banking outlets were provided in almost all identified unbanked villages with a population of more than 2,000, the process of bringing in unbanked villages with a population of less than 2,000 was in progress during the year. The share of ATMs in rural and semi-urban centres was on a rise, and as the process of setting up of White Label ATMs gains momentum, the penetration of off-site ATMs in these centres may get a further boost. However, the default among public and private sector banks in meeting priority sector lending targets remained a matter of continued concern having implications for financial inclusion.
4.79 Looking ahead over the short-term horizon, the Indian banking sector needs to lend support to the productive sectors to boost economic recovery, but remain vigilant about asset quality. Over the medium to long-term, the sector needs to demonstrate sustained improvements in efficiency and inclusiveness.
|