The fiscal position of states witnessed consolidation in terms of deficit indicators in 2010-11. The year 2011-12
(RE) recorded a marginal improvement in revenue surplus, while fiscal deficit was higher due to an increase in
capital outlay. However, state governments are budgeted to further strengthen their fiscal position in 2012-13,
which would be primarily contributed by higher surplus in their revenue accounts during the year. A comparison
with the Thirteenth Finance Commission’s (FC-XIII) targets for deficits indicates that the states have by and
large achieved the envisaged revenue balance in 2011-12, but the GFD-GSDP target was not met by 12 states.
During 2012-13 (BE), most states expect to meet both the deficit targets. The majority of the states budgeted
a higher capital outlay and also show an increase in their revenue surplus during 2012-13, thereby indicating
that the quality of expenditure is not being compromised to achieve the deficit targets.
1. Introduction
4.1 The fiscal consolidation process of the
states, which had resumed in 2010-11 after a
setback in 2008-09 and 2009-10, was somewhat
hampered by a slowdown in economic activities in
2011-12. As a result, the consolidated gross fiscal
deficit as a ratio to GDP, which had declined
significantly in 2010-11, increased marginally in
2011-12 (RE), although revenue account at the
consolidated level continued to remain in surplus.
However, most states have indicated a reduction
in their fiscal deficit-GSDP ratio during 2012-13 (BE) through generation of increased surplus in
their revenue accounts, which is expected to
improve their overall fiscal balance at the
consolidated level (Tables IV.1 and IV.3).
4.2 Non-special category (NSC) states and
special category (SC) states at the consolidated
level witnessed improvement in their key deficit
indicators during 2010-11. While revenue account
recorded improvement across the majority of
states, GFD-GSDP ratios were lower due to a
decline in capital outlay. However, the fiscal
imbalances of consolidated NSC and SC states widened in 2011-12 (RE) due to higher capital
outlays across the majority of states. In 2012-13,
finances of consolidated NSC and SC states are
budgeted to improve due to an increase in revenue
surpluses in the majority of states. It is pertinent to
note that reduction in the revenue deficit of West
Bengal and the increase in revenue surplus of
Bihar in 2012-13 contributed substantially to the
budgeted improvement in the consolidated
revenue account of NSC states (Tables IV.2 and IV.3).
Table IV.1: Major Deficit Indicators of State Governments |
(Amount in ` billion) |
Item |
1990-98 |
1998-2004 |
2004-08 |
2008-10 |
2010-11 |
2011-12
(BE) |
2011-12
(RE) |
2012-13
(BE) |
Averages |
1 |
2 |
3 |
4 |
5 |
6 |
7 |
8 |
9 |
Gross Fiscal Deficit |
|
|
|
1,617.0 |
1,614.6 |
1,977.2 |
2,078.8 |
2,152.7 |
|
(2.7) |
(4.1) |
(2.3) |
(2.7) |
(2.1) |
(2.2) |
(2.3) |
(2.1) |
Revenue Deficit |
|
|
|
91.7 |
-30.5 |
-197.0 |
-60.9 |
-425.7 |
|
(0.8) |
(2.5) |
(0.0) |
(0.1) |
(-0.0) |
(-0.2) |
(-0.1) |
(-0.4) |
Primary Deficit |
|
|
|
538.2 |
366.4 |
575.9 |
685.5 |
598.3 |
|
(0.9) |
(1.7) |
(0.0) |
(0.9) |
(0.5) |
(0.7) |
(0.8) |
(0.6) |
BE: Budget Estimates. RE: Revised Estimates.
Note: 1. Negative (-) sign indicates surplus.
2. Figures in parentheses are percentages to GDP.
3. The ratios to GDP at current market prices are based on CSO's National Accounts 2004-05 series.
Source: Budget Documents of the state governments. |
4.3 On the receipts side, the average
aggregate receipts-GDP ratio, which had
moderated in the post global financial crisis
period, has revived to its high growth phase level
of 16.1 per cent during 2011-12 to 2012-13. A
phase-wise analysis shows that the increase in
the average of revenue receipts-GDP ratio of the
states during the fiscal consolidation phase, i.e., 2004-08 over that in 1998-2004 period, was
largely attributable to an increase in central
transfers, although the states’ own revenues also
increased over the same period. During 2008-10,
the average revenue receipts-GDP ratio further
increased, with the increase in central transfers
more than offsetting the decline in states’ own
revenues. During 2010-11 to 2012-13 (BE), the
revenue receipts-GDP ratio shows a gradual
increase on account of improvement in both
states’ own tax revenues (OTR) and central
transfers. The states’ OTR as a ratio to GDP has
been steadily increasing from an average of 5.1
per cent during 1990-98 to 6.3 per cent in 2012-13
(BE) (Table IV. 4).
4.4 The average aggregate expenditure-GDP
ratio during 2004-08 was lower than that in 1998-
04 due to a sharp decline in revenue expenditure,
even though there was an increase in the capital outlay. During the crisis years, i.e., 2008-10, the
average aggregate expenditure-GDP ratio
remained unchanged at 15.7 per cent as the
increase in revenue expenditure was offset by a decline in capital expenditure. Although the
aggregate expenditure-GDP ratio had declined in
2010-11, it increased by 1.1 percentage points in
2011-12 (RE), mainly on account of an increase in revenue expenditure. For 2012-13, the aggregate
expenditure-GDP ratio is expected to be marginally
lower on account of a decline in revenue
expenditure (Table IV.5).
Table IV.2: Fiscal Imbalances in Non-Special and Special Category States |
|
2004-08
(Avg.) |
2008-10
(Avg.) |
2010-11 |
2011-12 (RE) |
2012-13 (BE) |
Per cent to
GSDP |
Per cent to
GSDP |
Per cent
to GSDP |
Deterioration
in No. of
States |
Per cent
to GSDP |
Deterioration
in No. of
States |
Per cent
to GSDP |
Deterioration
in No. of
States |
1 |
2 |
3 |
5 |
6 |
7 |
8 |
9 |
10 |
Revenue Deficit |
|
|
|
|
|
|
|
|
Non-Special Category States |
0.2 |
0.3 |
0.1 |
3 |
0.1 |
9 |
-0.3 |
4 |
Special Category States |
-2.8 |
-3.1 |
-2.3 |
5 |
-2.5 |
4 |
-3.7 |
2 |
All States Consolidated* |
0.0 |
0.1 |
-0.0 |
8 |
-0.1 |
13 |
-0.4 |
6 |
Gross Fiscal Deficit |
|
|
|
|
|
|
|
|
Non-Special Category States |
2.7 |
3.1 |
2.5 |
3 |
2.7 |
10 |
2.5 |
8 |
Special Category States |
3.1 |
3.6 |
2.9 |
4 |
4.5 |
8 |
3.1 |
2 |
All States Consolidated* |
2.3 |
2.7 |
2.1 |
7 |
2.3 |
18 |
2.1 |
10 |
Primary Deficit |
|
|
|
|
|
|
|
|
Non-Special Category States |
0.0 |
1.0 |
0.6 |
3 |
0.9 |
11 |
0.7 |
8 |
Special Category States |
-0.5 |
0.6 |
0.1 |
4 |
1.8 |
8 |
0.5 |
3 |
All States Consolidated* |
0.0 |
0.9 |
0.5 |
7 |
0.8 |
19 |
0.6 |
11 |
Primary Revenue Balance |
|
|
|
|
|
|
|
|
Non-Special Category States |
-2.5 |
-1.7 |
-1.8 |
4 |
-1.8 |
9 |
-2.1 |
5 |
Special Category States |
-6.4 |
-6.0 |
-5.0 |
6 |
-5.1 |
4 |
-6.3 |
2 |
All States Consolidated* |
-2.3 |
-1.7 |
-1.7 |
10 |
-1.6 |
13 |
-1.9 |
7 |
* : As a ratio to GDP. RE: Revised Estimates BE: Budget Estimates
Source: Budget documents of the state governments.
Note : Negative (-) sign indicates surplus |
Table IV.3: Deficit Indicators of State Governments |
(Per cent) |
State |
2004-08 (Avg.)* |
2010-11 |
2011-12 (RE) |
2012-13 (BE) |
RD/
GSDP |
GFD/
GSDP |
PD/
GSDP |
PRB/
GSDP |
RD/
GSDP |
GFD/
GSDP |
PD/
GSDP |
PRB/
GSDP |
RD/
GSDP |
GFD/
GSDP |
PD/
GSDP |
PRB/
GSDP |
RD/
GSDP |
GFD/
GSDP |
PD/
GSDP |
PRB/
GSDP |
1 |
3 |
2 |
4 |
5 |
7 |
6 |
8 |
9 |
10 |
11 |
12 |
13 |
14 |
15 |
16 |
17 |
I. Non-Special Category |
0.2 |
2.7 |
0.0 |
-2.5 |
0.1 |
2.5 |
0.6 |
-1.8 |
0.1 |
2.7 |
0.9 |
-1.8 |
-0.3 |
2.5 |
0.7 |
-2.1 |
1. Andhra Pradesh |
0.0 |
2.8 |
0.2 |
-2.6 |
-0.4 |
2.0 |
0.4 |
-2.1 |
-0.1 |
2.6 |
1.0 |
-1.7 |
-0.6 |
2.6 |
1.0 |
-2.2 |
2. Bihar |
-2.0 |
2.6 |
-1.2 |
-5.8 |
-3.0 |
1.9 |
-0.2 |
-5.0 |
-0.3 |
5.4 |
3.4 |
-2.3 |
-2.7 |
2.9 |
0.9 |
-4.7 |
3. Chhattisgarh |
-2.7 |
0.9 |
-0.9 |
-4.4 |
-2.9 |
-0.3 |
-1.4 |
-3.9 |
-1.6 |
2.8 |
1.9 |
-2.5 |
-1.8 |
2.8 |
2.0 |
-2.6 |
4. Goa |
-0.1 |
3.6 |
1.0 |
-2.7 |
-2.0 |
1.7 |
-0.3 |
-4.0 |
0.3 |
4.1 |
2.6 |
-1.3 |
0.2 |
3.8 |
2.4 |
-1.3 |
5. Gujarat |
0.2 |
2.6 |
0.0 |
-2.3 |
1.0 |
2.9 |
1.1 |
-0.9 |
-0.3 |
2.2 |
0.3 |
-2.2 |
-0.5 |
2.6 |
0.8 |
-2.4 |
6. Haryana |
-0.9 |
0.4 |
-1.5 |
-2.8 |
1.0 |
2.7 |
1.5 |
-0.2 |
0.8 |
2.5 |
1.1 |
-0.6 |
0.7 |
2.1 |
0.6 |
-0.8 |
7. Jharkhand |
2.0 |
7.4 |
5.9 |
0.5 |
0.1 |
4.4 |
2.4 |
-1.8 |
-0.5 |
3.2 |
1.3 |
-2.4 |
-3.3 |
2.1 |
0.3 |
-5.1 |
8. Karnataka |
-1.3 |
2.0 |
0.1 |
-3.3 |
-1.1 |
2.8 |
1.3 |
-2.6 |
-0.7 |
2.9 |
1.5 |
-2.1 |
-0.2 |
2.9 |
1.5 |
-1.6 |
9. Kerala |
2.3 |
3.2 |
0.4 |
-0.4 |
1.3 |
2.8 |
0.7 |
-0.7 |
1.7 |
3.5 |
1.5 |
-0.3 |
0.9 |
2.7 |
0.9 |
-1.0 |
10. Madhya Pradesh |
-1.8 |
3.3 |
0.4 |
-4.6 |
-2.5 |
1.9 |
0.1 |
-4.4 |
-2.6 |
2.6 |
0.7 |
-4.5 |
-1.9 |
3.0 |
1.1 |
-3.8 |
11. Maharashtra |
0.2 |
2.4 |
0.5 |
-1.8 |
0.1 |
1.8 |
0.3 |
-1.4 |
0.2 |
1.7 |
0.3 |
-1.3 |
0.0 |
1.7 |
0.3 |
-1.4 |
12. Odisha |
-1.4 |
0.1 |
-3.5 |
-5.0 |
-2.0 |
0.3 |
-1.2 |
-3.6 |
-1.4 |
0.9 |
-0.9 |
-3.2 |
-0.9 |
1.8 |
0.1 |
-2.7 |
13. Punjab |
2.1 |
3.3 |
-0.2 |
-1.3 |
2.4 |
3.2 |
0.7 |
-0.1 |
2.2 |
3.8 |
1.3 |
-0.3 |
1.1 |
3.1 |
0.8 |
-1.2 |
14. Rajasthan |
0.2 |
3.1 |
-0.4 |
-3.3 |
-0.3 |
1.3 |
-1.0 |
-2.6 |
-0.1 |
2.1 |
-0.1 |
-2.3 |
-0.2 |
2.1 |
0.1 |
-2.3 |
15. Tamil Nadu |
-0.6 |
1.4 |
-0.4 |
-2.5 |
0.5 |
3.2 |
1.7 |
-1.0 |
-0.1 |
2.9 |
1.4 |
-1.6 |
-0.3 |
2.9 |
1.4 |
-1.8 |
16. Uttar Pradesh |
0.2 |
3.7 |
0.3 |
-3.2 |
-0.6 |
3.0 |
0.5 |
-3.1 |
-1.3 |
2.9 |
0.6 |
-3.6 |
-0.8 |
3.0 |
0.7 |
-3.1 |
17. West Bengal |
3.3 |
4.4 |
0.2 |
-0.9 |
3.6 |
4.1 |
1.2 |
0.7 |
3.1 |
3.9 |
1.0 |
0.2 |
1.1 |
2.5 |
-0.3 |
-1.8 |
II. Special Category |
-2.8 |
3.1 |
-0.5 |
-6.4 |
-2.3 |
2.9 |
0.1 |
-5.0 |
-2.5 |
4.5 |
1.8 |
-5.1 |
-3.7 |
3.1 |
0.5 |
-6.3 |
1. Arunachal Pradesh |
-9.3 |
3.7 |
-0.3 |
-13.3 |
-20.4 |
-0.1 |
-5.0 |
-25.2 |
-19.7 |
16.9 |
13.5 |
-23.1 |
-23.1 |
3.2 |
-0.2 |
-26.5 |
2. Assam |
-2.3 |
0.3 |
-2.1 |
-4.7 |
-0.1 |
1.9 |
0.1 |
-1.9 |
-0.3 |
3.9 |
2.1 |
-2.1 |
-1.1 |
3.0 |
1.4 |
-2.7 |
3. Himachal Pradesh |
0.3 |
3.7 |
-2.1 |
-5.4 |
1.0 |
3.4 |
-0.2 |
-2.6 |
-0.8 |
2.9 |
-0.5 |
-4.2 |
-0.6 |
2.9 |
-0.5 |
-3.9 |
4. Jammu and Kashmir |
-6.0 |
5.3 |
0.7 |
-10.6 |
-6.9 |
4.3 |
0.2 |
-11.1 |
-4.9 |
6.1 |
2.0 |
-9.0 |
-7.6 |
2.9 |
-0.9 |
-11.4 |
5. Manipur |
-8.5 |
4.9 |
0.3 |
-13.1 |
-14.1 |
5.9 |
2.1 |
-17.9 |
-3.4 |
15.5 |
11.9 |
-7.0 |
-14.2 |
4.2 |
0.5 |
-17.9 |
6. Meghalaya |
-1.2 |
2.6 |
0.2 |
-3.6 |
-1.8 |
2.4 |
0.6 |
-3.6 |
-4.0 |
2.6 |
0.8 |
-5.8 |
-5.5 |
2.1 |
0.2 |
-7.3 |
7. Mizoram |
-4.3 |
9.5 |
3.2 |
-10.7 |
0.4 |
10.6 |
6.5 |
-3.7 |
-2.8 |
7.0 |
3.1 |
-6.7 |
-7.8 |
3.3 |
0.3 |
-10.8 |
8. Nagaland |
-4.7 |
3.9 |
0.0 |
-8.5 |
-7.3 |
2.8 |
-0.7 |
-10.8 |
-6.0 |
5.8 |
2.2 |
-9.6 |
-9.9 |
3.5 |
-0.3 |
-13.6 |
9. Sikkim |
-11.0 |
6.3 |
1.1 |
-16.3 |
-2.5 |
5.6 |
2.3 |
-5.8 |
-13.2 |
4.8 |
1.9 |
-16.0 |
-17.5 |
3.5 |
0.6 |
-20.4 |
10. Tripura |
-6.6 |
0.7 |
-3.0 |
-10.3 |
-4.7 |
1.4 |
-1.1 |
-7.2 |
-7.0 |
2.0 |
-0.6 |
-9.5 |
-5.7 |
2.6 |
0.0 |
-8.2 |
11. Uttarakhand |
0.1 |
5.3 |
2.6 |
-2.7 |
0.0 |
2.4 |
0.5 |
-1.9 |
-0.3 |
3.1 |
1.1 |
-2.3 |
-0.4 |
3.4 |
1.4 |
-2.5 |
All States# |
0.0 |
2.3 |
0.0 |
-2.3 |
-0.0 |
2.1 |
0.5 |
-1.7 |
-0.1 |
2.3 |
0.8 |
-1.6 |
-0.4 |
2.1 |
0.6 |
-1.9 |
Memo Item: |
|
|
|
|
|
|
|
|
|
|
|
|
|
|
|
|
1. NCT Delhi |
-3.3 |
0.7 |
-0.8 |
-4.8 |
-4.0 |
-0.3 |
-1.3 |
-5.0 |
-1.2 |
1.0 |
0.1 |
-2.1 |
-1.6 |
0.7 |
-0.2 |
-2.5 |
2. Puducherry |
0.4 |
4.0 |
1.7 |
-1.9 |
2.6 |
5.5 |
2.9 |
0.1 |
2.0 |
4.9 |
2.0 |
-0.9 |
1.5 |
4.8 |
2.1 |
-1.2 |
Avg.: Average. RE: Revised Estimates. PD: Primary Deficit. PRB: Primary Revenue Balance.
RD: Revenue Deficit. GFD: Gross Fiscal Deficit. GSDP: Gross State Domestic Product.
*: Data for Puducherry pertain to 2006-07.
#: Data for All States are as per cent to GDP.
Note: Negative (-) sign indicates surplus .
Source: Based on Budget Documents of the state governments. |
Table IV.4: Aggregate Receipts of State Governments |
(Amount in ` billion) |
Item |
1990-98 |
1998-2004 |
2004-08 |
2008-10 |
2010-11 |
2011-12
(RE) |
2012-13
(BE) |
Variation (Percent) |
(Average) |
Col.7/6 |
Col.8/7 |
1 |
2 |
3 |
4 |
5 |
6 |
7 |
8 |
9 |
10 |
Aggregate Receipts (1+2) |
1,515.2 |
3,666.2 |
6,496.6 |
9,494.6 |
11,735.7 |
14,259.4 |
16,333.0 |
21.5 |
14.5 |
|
(15.0) |
(15.9) |
(16.1) |
(15.7) |
(15.3) |
(16.1) |
(16.1) |
|
|
1. Revenue Receipts (a+b) |
1,143.5 |
2,400.8 |
4,872.1 |
7,314.0 |
9,353.5 |
11,414.7 |
13,309.8 |
22.0 |
16.6 |
|
(11.3) |
(10.5) |
(11.9) |
(12.1) |
(12.2) |
(12.9) |
(13.1) |
|
|
a. States' Own Revenue (i+ii) |
696.2 |
1,501.2 |
2,921.1 |
4,279.2 |
5,523.6 |
6,578.5 |
7,649.7 |
19.1 |
16.3 |
|
(6.8) |
(6.5) |
(7.2) |
(7.1) |
(7.2) |
(7.4) |
(7.5) |
|
|
i. States' Own Tax |
518.0 |
1,187.8 |
2,333.6 |
3,425.0 |
4,607.1 |
5,514.7 |
6,450.7 |
19.7 |
17.0 |
|
(5.1) |
(5.2) |
(5.7) |
(5.7) |
(6.0) |
(6.2) |
(6.3) |
|
|
ii. States' Own Non-Tax |
178.2 |
313.4 |
587.5 |
854.2 |
916.5 |
1,063.9 |
1,199.0 |
16.1 |
12.7 |
|
(1.7) |
(1.4) |
(1.4) |
(1.4) |
(1.2) |
(1.2) |
(1.2) |
|
|
b. Current Transfers (i+ii) |
447.3 |
899.6 |
1,951.0 |
3,034.8 |
3,829.9 |
4,836.1 |
5,660.1 |
26.3 |
17.0 |
|
(4.5) |
(3.9) |
(4.7) |
(5.0) |
(5.0) |
(5.5) |
(5.6) |
|
|
i. Shareable Taxes |
254.3 |
517.0 |
1,110.7 |
1,630.3 |
2,194.9 |
2,597.3 |
3,021.9 |
18.3 |
16.3 |
|
(2.5) |
(2.3) |
(2.7) |
(2.7) |
(2.9) |
(2.9) |
(3.0) |
|
|
ii. Grants-in Aid |
193.0 |
382.6 |
840.4 |
1,404.5 |
1,635.0 |
2,238.9 |
2,638.2 |
36.9 |
17.8 |
|
(2.0) |
(1.7) |
(2.0) |
(2.3) |
(2.1) |
(2.5) |
(2.6) |
|
|
2. Capital Receipts (a+b) |
371.8 |
1,265.4 |
1,624.5 |
2,180.7 |
2,382.3 |
2,844.7 |
3,023.3 |
19.4 |
6.3 |
|
(3.7) |
(5.4) |
(4.2) |
(3.6) |
(3.1) |
(3.2) |
(3.0) |
|
|
a. Loans from Centre@ |
180.8 |
260.9 |
117.4 |
75.6 |
94.8 |
159.9 |
202.1 |
68.7 |
26.4 |
|
(1.8) |
(1.2) |
(0.3) |
(0.1) |
(0.1) |
(0.2) |
(0.2) |
|
|
b. Other Capital Receipts |
191.0 |
1,004.5 |
1,507.1 |
2,105.1 |
2,287.5 |
2,684.9 |
2,821.1 |
17.4 |
5.1 |
|
(1.9) |
(4.2) |
(3.9) |
(3.5) |
(3.0) |
(3.0) |
(2.8) |
|
|
RE: Revised Estimates. BE: Budget Estimates.
@ With the change in the system of accounting with effect from 1999-2000, states' share in small savings which was included earlier under
loans from centre is included under internal debt and shown as special securities issued to National Small Savings Fund (NSSF) of the
central government. The data for the years prior to 1999-2000 as reported in this Table, however, exclude loans against small savings, for
the purpose of comparability.
Note: 1. The period averages provided in this table refl ect the different fi scal phases of the states.
2. Figures in parentheses are percentages to GDP.
3. Capital receipts include public accounts on a net basis. Also see Notes to Appendices.
Source: Budget Documents of the state governments. |
2. Accounts: 2010-111
4.5 After having implemented an expansionary
fiscal policy to address the slowdown in 2008-09
and 2009-10, the challenge before the state
governments was to revert to the fiscal
consolidation path. The state governments had, in
their budgets for 2010-11, proposed to carry forward their fiscal consolidation, in keeping with
the recommendation of the FC-XIII. The focus
was on expenditure control against the backdrop
of the rollback of fiscal stimulus measures and the
tapering off of the impact of the Sixth Pay
Commission Award. In 2010-11, key deficit-GDP
ratios declined over the previous year, primarily on
account of a boost in revenues led by a
strengthening of the growth momentum. Revenue
account turned to a surplus position in 2010-11
from a deficit in 2009-10, supported by an increase
in the revenue receipts-GDP ratio as also a reduction in the revenue expenditure-GDP ratio.
The improvement in the revenue receipts-GDP
ratio was entirely due to higher tax receipts from
both states’ own tax revenue and share in central
taxes as ratios to GDP. On the expenditure front,
the revenue expenditure-GDP ratio declined,
reflecting a lower development revenue
expenditure-GDP ratio. The surplus in the revenue
account coupled with a decline in the capital
outlay-GDP ratio resulted in a sharp decline in the
consolidated GFD-GDP ratio and the primary
deficit-GDP (PD-GDP) ratio by 0.8 percentage
points and 0.7 percentage points, respectively,
over 2009-10.
Table IV.5: Expenditure Pattern of State Governments |
(Amount in ` billion) |
Item |
1990-98 |
1998-2004 |
2004-08 |
2008-10 |
2010-11 |
2011-12
(RE) |
2012-13
(BE) |
Variation
(Per cent) |
(Average) |
Col.7/6 |
Col.8/7 |
1 |
2 |
3 |
4 |
5 |
6 |
7 |
8 |
9 |
10 |
Aggregate Expenditure |
1,511.4 |
3,670.8 |
6,311.8 |
9,488.3 |
11,587.3 |
14,330.8 |
16,322.9 |
23.7 |
13.9 |
(1+2 = 3+4+5) |
(15.0) |
(15.9) |
(15.7) |
(15.7) |
(15.1) |
(16.2) |
(16.1) |
|
|
1. Revenue Expenditure |
1,230.5 |
2,959.7 |
4,818.0 |
7,405.7 |
9,323.0 |
11,353.8 |
12,884.1 |
21.8 |
13.5 |
of which: |
(12.1) |
(12.9) |
(11.9) |
(12.2) |
(12.1) |
(12.8) |
(12.7) |
|
|
Interest payments |
181.3 |
570.1 |
908.6 |
1,078.8 |
1,248.2 |
1,393.3 |
1,554.4 |
11.6 |
11.6 |
|
(1.7) |
(2.5) |
(2.3) |
(1.8) |
(1.6) |
(1.6) |
(1.5) |
|
|
2. Capital Expenditure |
280.9 |
711.1 |
1,493.8 |
2,082.6 |
2,264.3 |
2,977.1 |
3,438.8 |
31.5 |
15.5 |
of which: |
(2.8) |
(3.0) |
(3.7) |
(3.5) |
(3.0) |
(3.4) |
(3.4) |
|
|
Capital outlay |
146.2 |
328.1 |
886.5 |
1,459.2 |
1,519.3 |
1,952.8 |
2,372.1 |
28.5 |
21.5 |
|
(1.4) |
(1.4) |
(2.2) |
(2.4) |
(2.0) |
(2.2) |
(2.3) |
|
|
3. Development Expenditure |
993.1 |
2,093.6 |
3,682.9 |
6,024.1 |
7,203.5 |
9,208.8 |
10,332.4 |
27.8 |
12.2 |
|
(9.9) |
(9.2) |
(9.1) |
(10.0) |
(9.4) |
(10.4) |
(10.2) |
|
|
4. Non-Development Expenditure |
444.0 |
1,270.1 |
2,050.7 |
2,812.6 |
3,572.9 |
4,132.9 |
4,792.9 |
15.7 |
16.0 |
|
(4.3) |
(5.5) |
(5.1) |
(4.6) |
(4.7) |
(4.7) |
(4.7) |
|
|
5. Others* |
74.3 |
307.1 |
578.2 |
651.6 |
810.9 |
989.2 |
1,197.8 |
22.0 |
21.1 |
|
(0.8) |
(1.3) |
(1.5) |
(1.1) |
(1.1) |
(1.1) |
(1.2) |
|
|
Avg.: Average. RE: Revised Estimates. BE: Budget Estimates.
* : Includes repayment of loans to Centre, discharge of internal debt, grants-in-aid and contributions (compensation and assignments to local bodies).
Note: 1. The period averages provided in this table reflect the different fiscal phases of the States.
2. Figures in parentheses are percent to GDP.
3. Capital Expenditure is given exclusive of Public Accounts. Also see Notes to Appendices.
Source: Budget Documents of the state governments. |
4.6 A comparison of the accounts figures with
the revised estimates for 2010-11 shows that there
was a turnaround in the revenue account from deficit to surplus since the decline in revenue
expenditure was larger than that in revenue
receipts. Together with a cutback in the capital
outlay-GDP ratio, the ratios of consolidated GFDGDP
and PD-GDP were lower than in the revised
estimates.
4.7 Despite an improvement in the revenues
from states’ own taxes and tax devolution from the
centre, revenue receipts in 2010-11 were lower,
reflecting the impact of reduced receipts from
states’ own non-tax revenues, viz., ‘irrigation’,‘power’ and ‘interest receipts’, as also grants from
the centre to the states. Revenue expenditure was
also lower than the revised estimate, largely due to
a decline in development revenue expenditure on‘education, sports, art and culture’, ‘transport and
communication’, ‘relief on account of natural calamities’ and ‘rural development’. Non development
expenditure on ‘administrative services’ and ‘interest payments’ was also lower in
2010-11 (Table IV.6).
Table IV.6: Variation in Major Items - 2010-11 (Accounts) over 2010-11 (RE) |
(Amount in ` billion) |
Item |
2010-11
(RE) |
2010-11
(Accounts) |
Variation |
Share in
variation*
(Per cent) |
Amount |
Per cent |
1 |
2 |
3 |
4 |
5 |
6 |
I. Revenue Receipts (i+ii) |
9,680.7 |
9,353.5 |
-327.2 |
-3.4 |
100.0 |
(i) Tax Revenue (a+b) |
6,734.2 |
6,802.0 |
67.8 |
1.0 |
-20.7 |
(a) Own Tax Revenue |
4,582.7 |
4,607.1 |
24.4 |
0.5 |
-7.4 |
of which: Sales Tax |
2,819.3 |
2,788.4 |
-30.9 |
-1.1 |
9.4 |
(b) Share in Central Taxes |
2,151.5 |
2,194.9 |
43.4 |
2.0 |
-13.3 |
(ii) Non-Tax Revenue |
2,946.5 |
2,551.5 |
-395.0 |
-13.4 |
120.7 |
(a) States' Own Non-Tax Revenue |
979.0 |
916.5 |
-62.5 |
-6.4 |
19.1 |
(b) Grants from Centre |
1,967.5 |
1,635.0 |
-332.6 |
-16.9 |
101.6 |
II. Revenue Expenditure |
9,932.5 |
9,323.0 |
-609.5 |
-6.1 |
100.0 |
of which: |
|
|
|
|
|
(i) Development Expenditure |
6,066.1 |
5,567.0 |
-499.1 |
-8.2 |
81.9 |
of which: |
|
|
|
|
|
Education, Sports, Art and Culture |
1,976.8 |
1,876.2 |
-100.6 |
-5.1 |
16.5 |
Transport and Communication |
239.6 |
220.0 |
-19.6 |
-8.2 |
3.2 |
Power |
369.8 |
366.1 |
-3.7 |
-1.0 |
0.6 |
Relief on account of Natural Calamities |
119.7 |
87.6 |
-32.1 |
-26.8 |
5.3 |
Rural Development |
356.3 |
325.9 |
-30.4 |
-8.5 |
5.0 |
(ii) Non-Development Expenditure |
3,590.8 |
3,502.0 |
-88.9 |
-2.5 |
14.6 |
of which: |
|
|
|
|
|
Administrative Services |
803.9 |
751.6 |
-52.3 |
-6.5 |
8.6 |
Pension |
1,065.7 |
1,082.6 |
16.9 |
1.6 |
-2.8 |
Interest Payments |
1,269.5 |
1,248.2 |
-21.3 |
-1.7 |
3.5 |
III. Capital Receipts |
2,366.0 |
2,382.3 |
16.3 |
0.7 |
100.0 |
of which: |
|
|
|
|
|
Non-Debt Capital Receipts |
9.6 |
12.4 |
2.8 |
29.3 |
17.2 |
IV. Capital Expenditure |
2,431.0 |
2,264.3 |
-166.7 |
-6.9 |
100.0 |
of which: |
|
|
|
|
|
Capital Outlay |
1,704.0 |
1,519.3 |
-184.7 |
-10.8 |
110.8 |
of which: |
|
|
|
|
|
Capital Outlay on Irrigation and Flood Control |
459.7 |
432.5 |
-27.2 |
-5.9 |
16.3 |
Capital Outlay on Energy |
168.4 |
159.1 |
-9.3 |
-5.5 |
5.6 |
Capital Outlay on Transport |
343.7 |
348.6 |
4.9 |
1.4 |
-2.9 |
Memo Item: |
Revenue Deficit |
251.8 |
-30.5 |
-282.3 |
-112.1 |
|
Gross Fiscal Deficit |
2,066.7 |
1,614.6 |
-452.1 |
-21.9 |
|
Primary Deficit |
797.2 |
366.4 |
-430.8 |
-54.0 |
|
RE: Revised Estimates.
* : Denotes percentage share in relevant total.
Note: 1. Negative (-) sign in deficit indicators indicates surplus.
2. Capital receipts include public accounts on a net basis while capital expenditure excludes public accounts.
3. Also see Notes to Appendices.
Source: Budget Documents of the state governments. |
3. Revised Estimates: 2011-122
4.8 The fiscal position at the consolidated
level during 2011-12 (RE) in comparison with
2010-11 (accounts) shows that while the revenue
surplus as a ratio to GDP improved marginally, the
consolidated GFD-GDP ratio was higher due to an
increase in the capital outlay-GDP ratio. The statewise
position in 2011-12 (RE) over 2010-11
reveals that while the revenue defi cit-GSDP ratio
deteriorated in 13 out of 28 states, the fiscal deficit-
GSDP ratios were higher in 18 states (Tables IV.1
and IV.3).
4.9 In terms of the consolidated position of the
state governments for 2011-12 (RE), despite lower
capital outlay-GDP ratio the fiscal deficit and
primary deficit as ratios to GDP were higher than
the budgeted levels. This was on account of lower
revenue surplus at the consolidated level resulting
from higher than budgeted revenue expenditure,
which more than offset the increase in revenue
receipts.
4.10 Higher tax receipts from both states’ OTR
and tax devolution from the centre contributed to
the higher revenue receipts in 2011-12 (RE).
States’ OTR in 2011-12(RE) exceeded the
budgeted level on account of higher collections
from taxes on commodities. However, non-tax
revenues were lower due to grants from the centre,
although states’ own non-tax revenues were
higher in the revised estimates (Table IV.8).
4.11 In 2011-12 (RE), revenue receipts as a
ratio to GSDP increased in 25 states over 2010-11
despite the moderation in economic growth.
States’ own revenues, viz., own tax revenue and
own non-tax revenue as ratios to GSDP, increased
in 24 and 17 states, respectively. During 2011-12,
sharp increases in the prices of petroleum
products helped boost states’ OTR, because
revenue from VAT on petroleum products accounts for around one-third of the total VAT revenue. The
share of VAT on petroleum products in total VAT
revenue increased in 15 states; at the consolidated
level this share increased to 31.3 per cent during
2011-12 (Table IV.7). Within current transfers,
states’ share in central taxes and grants from the
centre increased in 25 and 24 states, respectively
(Table IV.10).
4.12 Performance in terms of VAT-GSDP ratio
of the consolidated NSC and SC states showed a
gradual improvement during 2009-10 to 2011-12 (RE). It may be mentioned that Andhra Pradesh,
Karnataka, Kerala and Tamil Nadu among the
NSC states and Assam, Himachal Pradesh and
Jammu and Kashmir among the SC states
recorded relatively higher VAT-GSDP ratios than
the other states in their respective categories. In
contrast, the VAT-GSDP ratio in Bihar and West Bengal was significantly lower than in other NSC
states during the same period (Chart IV.1).
4.13 On the expenditure side, revenue
expenditure was higher in 2011-12 (RE) with the
entire increase being contributed by higher
development expenditure on social and economic services. Non-development revenue expenditure
was, however, marginally lower in 2011-12(RE)
due to lower than budgeted expenditure on
‘interest payments’, ‘administrative services’ and
‘miscellaneous general services’.
Table IV.7: Contribution of VAT on Petroleum
Products in Total Revenue from VAT |
State/UT |
2010-11 |
2011-12 (RE) |
Non-special Category States |
|
|
Andhra Pradesh |
27.8 |
28.5 |
Bihar |
39.0 |
38.1 |
Chhattisgarh |
34.5 |
32.6 |
Goa |
36.6 |
35.7 |
Gujarat |
42.5 |
43.4 |
Haryana |
28.6 |
28.1 |
Jharkhand |
29.2 |
26.5 |
Karnataka |
24.9 |
26.2 |
Kerala |
22.7 |
21.4 |
Madhya Pradesh |
39.4 |
41.5 |
Maharashtra |
31.6 |
42.6 |
Orissa |
26.0 |
24.9 |
Punjab |
15.0 |
22.7 |
Rajasthan |
34.4 |
34.9 |
Tamil Nadu |
29.1 |
26.6 |
Uttar Pradesh |
33.1 |
30.4 |
West Bengal |
30.0 |
28.6 |
Special Category States |
|
|
Arunachal Pradesh |
18.8 |
74.9 |
Assam |
35.4 |
35.4 |
Himachal Pradesh |
9.7 |
6.8 |
Jammu & Kashmir |
27.0 |
26.3 |
Manipur |
18.3 |
29.4 |
Meghalaya |
11.2 |
1.6 |
Mizoram |
30.4 |
49.7 |
Nagaland |
25.0 |
27.2 |
Sikkim |
27.1 |
47.5 |
Tripura |
20.9 |
22.8 |
Uttarakhand |
24.5 |
31.3 |
All States |
30.2 |
31.3 |
Table IV.8: Variation in Major Items - 2011-12 (RE) over 2011-12 (BE) |
(Amount in ` billion) |
Item |
2011-12 (BE) |
2011-12
(RE) |
Variation |
Share in
variation*
(Per cent) |
Amount |
Per cent |
1 |
2 |
3 |
4 |
5 |
6 |
I. Revenue Receipts (i+ii) |
11,218.4 |
11,414.7 |
196.2 |
1.7 |
100.0 |
(i) Tax Revenue (a+b) |
7,904.8 |
8,111.9 |
207.1 |
2.6 |
105.5 |
(a) Own Tax Revenue |
5,395.8 |
5,514.7 |
118.8 |
2.2 |
60.5 |
of which: Sales Tax |
3,340.3 |
3,419.9 |
79.6 |
2.4 |
40.6 |
(b) Share in Central Taxes |
2,508.9 |
2,597.3 |
88.3 |
3.5 |
45.0 |
(ii) Non-Tax Revenue |
3,313.7 |
3,302.8 |
-10.9 |
-0.3 |
-5.5 |
(a) States' Own Non-Tax Revenue |
1,026.2 |
1,063.9 |
37.7 |
3.7 |
19.2 |
(b) Grants from Centre |
2,287.5 |
2,238.9 |
-48.6 |
-2.1 |
-24.7 |
II. Revenue Expenditure |
11,021.4 |
11,353.8 |
332.3 |
3.0 |
100.0 |
of which: |
|
|
|
|
|
(i) Development Expenditure |
6,680.0 |
7,016.7 |
336.7 |
5.0 |
101.3 |
of which: Education, Sports, Art and Culture |
2,254.4 |
2,309.3 |
54.9 |
2.4 |
16.5 |
Transport and Communication |
259.4 |
281.6 |
22.2 |
8.6 |
6.7 |
Power |
380.2 |
456.6 |
76.4 |
20.1 |
23.0 |
Relief on account of Natural Calamities |
81.3 |
133.5 |
52.2 |
64.2 |
15.7 |
Rural Development |
407.2 |
423.9 |
16.8 |
4.1 |
5.0 |
(ii) Non-Development Expenditure |
4,019.1 |
4,000.8 |
-18.2 |
-0.5 |
-5.5 |
of which: Administrative Services |
965.1 |
927.8 |
-37.3 |
-3.9 |
-11.2 |
Pension |
1,168.8 |
1,217.5 |
48.6 |
4.2 |
14.6 |
Interest Payments |
1,401.3 |
1,393.3 |
-8.0 |
-0.6 |
-2.4 |
III. Capital Receipts |
2,750.8 |
2,844.7 |
94.0 |
3.4 |
100.0 |
of which: Non-Debt Capital Receipts |
20.4 |
2.0 |
-18.4 |
-90.0 |
-19.6 |
IV. Capital Expenditure |
2,876.0 |
2,977.1 |
101.0 |
3.5 |
100.0 |
of which: Capital Outlay |
2,027.5 |
1,952.8 |
-74.7 |
-3.7 |
-73.9 |
of which: Capital Outlay on Irrigation and Flood Control |
583.6 |
505.7 |
-78.0 |
-13.4 |
-77.2 |
Capital Outlay on Energy |
162.7 |
203.2 |
40.4 |
24.8 |
40.0 |
Capital Outlay on Transport |
390.6 |
395.9 |
5.3 |
1.4 |
5.2 |
Memo Item: |
|
|
|
|
|
Revenue Deficit |
-197.0 |
-60.9 |
136.1 |
-69.1 |
|
Gross Fiscal Deficit |
1,977.2 |
2,078.8 |
101.6 |
5.1 |
|
Primary Deficit |
575.9 |
685.5 |
109.5 |
19.0 |
|
BE: Budget Estimates. RE: Revised Estimates.
* : Denotes percentage share in relevant total.
Note: See Notes to Table IV.2.
Source: Budget Documents of the state governments. |
 |
4. Budget Estimates: 2012-133
Key Deficit Indicators
4.14 All the key deficit indicators of states at the
consolidated level are budgeted to improve in
2012-13, indicative of the states’ intent to carry
forward fiscal consolidation as envisaged by FCXIII.
Higher growth in revenue receipts than in
revenue expenditure during 2012-13 is expected
to boost the revenue surplus of states at the
consolidated level to 0.4 per cent of GDP. The
improvement in the revenue account is expected
to reduce GFD and PD by 0.2 percentage points
of GDP each and would also provide resources for
higher capital outlays. With the improvement in the
revenue accounts of 22 states over 2011-12 (RE),
23 states have budgeted for revenue surplus in 2012-13. The GFD and PD as ratios to GSDP are
budgeted to decline in 18 and 17 states,
respectively, in 2012-13 (Tables IV.3 and IV.9).
Revenue Receipts
4.15 Revenue receipts as a ratio to GDP are
placed higher in 2012-13 (BE), with states’ OTR
budgeted to contribute around 50 per cent of the
increase in revenue receipts. States’ own non-tax
revenues are also budgeted to increase in 2012-13; while non-tax revenue from ‘education, sports,
art and culture’ is estimated to increase, lower
revenues are expected from ‘interest receipts’ and‘dividend and profits’ in 2012-13. Current transfers
from the central government in the form of tax
devolution and grants are also budgeted to
increase in 2012-13 (Chart IV.2, Tables IV.4 and
IV.9 and Appendix Table 3).
4.16 Revenue receipts-GSDP ratios are
expected to increase in 16 states during 2012-13
(BE). Within revenue receipts, states’ own
revenues, viz., OTR and ONTR as ratios to GSDP,
are budgeted to increase in 20 and 11 states,respectively, in 2012-13. Current transfers in the
form of tax devolution and grants as a ratio to
GSDP are also budgeted to increase in 19 states
and 15 states, respectively (Table IV.10).
Table IV.9: Variation in Major Items - 2012-13 (BE) over 2011-12 (RE) |
(Amount in ` billion) |
Item |
2011-12
(RE) |
2012-13
(BE) |
Variation |
Share in
variation* (Per cent) |
Amount |
Per cent |
1 |
2 |
3 |
4 |
5 |
6 |
I. Revenue Receipts (i+ii) |
11,414.7 |
13,309.8 |
1,895.1 |
16.6 |
100.0 |
(i) Tax Revenue (a+b) |
8,111.9 |
9,472.6 |
1,360.6 |
16.8 |
71.8 |
(a) Own Tax Revenue |
5,514.7 |
6,450.7 |
936.0 |
17.0 |
49.4 |
of which: Sales Tax |
3,419.9 |
4,034.0 |
614.2 |
18.0 |
32.4 |
(b) Share in Central Taxes |
2,597.3 |
3,021.9 |
424.6 |
16.3 |
22.4 |
(ii) Non-Tax Revenue |
3,302.8 |
3,837.2 |
534.4 |
16.2 |
28.2 |
(a) States' Own Non-Tax Revenue |
1,063.9 |
1,199.0 |
135.1 |
12.7 |
7.1 |
(b) Grants from Centre |
2,238.9 |
2,638.2 |
399.4 |
17.8 |
21.1 |
II. Revenue Expenditure |
11,353.8 |
12,884.1 |
1,530.3 |
13.5 |
100.0 |
of which: |
|
|
|
|
|
(i) Development Expenditure |
7,016.7 |
7,877.6 |
860.8 |
12.3 |
56.3 |
of which: Education, Sports, Art and Culture |
2,309.3 |
2,605.1 |
295.8 |
12.8 |
19.3 |
Transport and Communication |
281.6 |
308.1 |
26.5 |
9.4 |
1.7 |
Power |
456.6 |
507.4 |
50.8 |
11.1 |
3.3 |
Relief on account of Natural Calamities |
133.5 |
79.0 |
-54.6 |
-40.9 |
-3.6 |
Rural Development |
423.9 |
501.8 |
77.9 |
18.4 |
5.1 |
(ii) Non-Development Expenditure |
4,000.8 |
4,614.2 |
613.4 |
15.3 |
40.1 |
of which: Administrative Services |
927.8 |
1,112.0 |
184.1 |
19.8 |
12.0 |
Pension |
1,217.5 |
1,404.4 |
186.9 |
15.4 |
12.2 |
Interest Payments |
1,393.3 |
1,554.4 |
161.1 |
11.6 |
10.5 |
III. Capital Receipts |
2,844.7 |
3,023.3 |
178.5 |
6.3 |
100.0 |
of which: Non-Debt Capital Receipts |
2.0 |
2.2 |
0.2 |
9.6 |
0.1 |
IV. Capital Expenditure |
2,977.1 |
3,438.8 |
461.7 |
15.5 |
100.0 |
of which: Capital Outlay |
1,952.8 |
2,372.1 |
419.2 |
21.5 |
90.8 |
of which: Capital Outlay on Irrigation and Flood Control |
505.7 |
630.8 |
125.1 |
24.7 |
27.1 |
Capital Outlay on Energy |
203.2 |
181.1 |
-22.0 |
-10.8 |
-4.8 |
Capital Outlay on Transport |
395.9 |
475.1 |
79.2 |
20.0 |
17.2 |
Memo Item: |
Revenue Deficit |
-60.9 |
-425.7 |
-364.7 |
598.6 |
|
Gross Fiscal Deficit |
2,078.8 |
2,152.7 |
73.9 |
3.6 |
|
Primary Deficit |
685.5 |
598.3 |
-87.2 |
-12.7 |
|
RE: Revised Estimates. BE: Budget Estimates.
* : Denotes percentage share in relevant total.
Note: See Notes to Table IV.2.
Source: Budget Documents of the state governments. |
4.17 Cost recoveries from certain social and
economic services are important sources of
state’s own non-tax revenues. Cost recovery of
services4 is budgeted to improve for the education, irrigation, power and roads sectors, but would
marginally decline in the health sector in 2012-13.
The cost recovery from the roads and power sectors are also lower than that during the fiscal
consolidation phase of 2004-08, though it shows
improvement in recent years.
Table IV.10: Revenue Receipts of State Governments |
(Per cent) |
State |
2004-08 (Avg.)* |
2010-11 |
2011-12 (RE) |
2012-13 (BE) |
RR/
GSDP |
OTR/
GSDP |
ONTR/
GSDP |
CT/
GSDP |
RR/
GSDP |
OTR/
GSDP |
ONTR/
GSDP |
CT/
GSDP |
RR/
GSDP |
OTR/
GSDP |
ONTR/
GSDP |
CT/
GSDP |
RR/
GSDP |
OTR/
GSDP |
ONTR/
GSDP |
CT/
GSDP |
1 |
2 |
3 |
4 |
5 |
6 |
7 |
8 |
9 |
10 |
11 |
12 |
13 |
14 |
15 |
16 |
17 |
I. Non-Special Category |
13.5 |
7.0 |
1.6 |
4.9 |
13.6 |
7.2 |
1.4 |
5.0 |
14.5 |
7.5 |
1.4 |
5.6 |
14.8 |
7.7 |
1.3 |
5.7 |
1. Andhra Pradesh |
14.0 |
7.6 |
1.9 |
4.4 |
13.8 |
7.7 |
1.8 |
4.3 |
14.4 |
7.9 |
1.8 |
4.7 |
15.1 |
8.5 |
1.8 |
4.8 |
2. Bihar |
21.9 |
4.2 |
0.5 |
17.2 |
20.9 |
4.6 |
0.5 |
15.8 |
23.7 |
5.3 |
0.4 |
18.0 |
25.8 |
5.9 |
1.2 |
18.6 |
3. Chhattisgarh |
16.5 |
7.2 |
2.4 |
6.9 |
19.3 |
7.7 |
3.3 |
8.4 |
20.4 |
7.7 |
3.3 |
9.4 |
19.1 |
7.4 |
3.3 |
8.4 |
4. Goa |
15.1 |
7.3 |
5.5 |
2.3 |
16.7 |
6.6 |
7.0 |
3.2 |
13.6 |
5.7 |
5.1 |
2.9 |
13.3 |
6.1 |
4.7 |
2.5 |
5. Gujarat |
10.5 |
6.5 |
1.5 |
2.5 |
10.2 |
7.1 |
1.0 |
2.2 |
10.5 |
7.0 |
1.0 |
2.6 |
11.2 |
7.6 |
1.0 |
2.6 |
6. Haryana |
12.8 |
8.0 |
2.9 |
1.8 |
9.7 |
6.4 |
1.3 |
2.0 |
10.8 |
6.8 |
1.5 |
2.6 |
10.1 |
6.5 |
1.3 |
2.3 |
7. Jharkhand |
13.7 |
4.4 |
2.1 |
7.2 |
18.1 |
5.4 |
2.8 |
9.9 |
20.8 |
5.7 |
2.9 |
12.1 |
23.2 |
6.3 |
2.8 |
14.1 |
8. Karnataka |
15.8 |
9.8 |
1.9 |
4.1 |
15.3 |
10.1 |
0.9 |
4.3 |
15.8 |
10.5 |
0.7 |
4.5 |
15.6 |
10.0 |
0.6 |
5.1 |
9. Kerala |
11.6 |
7.6 |
0.7 |
3.4 |
11.2 |
7.8 |
0.7 |
2.6 |
12.1 |
8.1 |
0.8 |
3.2 |
12.3 |
8.2 |
0.9 |
3.2 |
10. Madhya Pradesh |
17.7 |
7.2 |
2.3 |
8.2 |
19.1 |
7.9 |
2.1 |
9.1 |
21.1 |
8.6 |
2.3 |
10.2 |
20.8 |
8.4 |
2.2 |
10.2 |
11. Maharashtra |
10.6 |
7.1 |
1.5 |
2.0 |
9.9 |
7.0 |
0.8 |
2.1 |
10.5 |
7.2 |
0.8 |
2.4 |
10.2 |
6.9 |
0.8 |
2.4 |
12. Odisha |
16.9 |
5.7 |
2.1 |
9.1 |
17.1 |
5.7 |
2.5 |
8.9 |
17.8 |
5.9 |
2.2 |
9.6 |
16.9 |
6.0 |
2.0 |
8.9 |
13. Punjab |
13.9 |
7.3 |
4.1 |
2.6 |
12.3 |
7.5 |
2.4 |
2.4 |
12.2 |
8.0 |
1.5 |
2.7 |
13.1 |
8.2 |
1.8 |
3.1 |
14. Rajasthan |
14.8 |
6.8 |
1.9 |
6.1 |
14.2 |
6.4 |
1.9 |
5.8 |
15.2 |
6.6 |
2.4 |
6.3 |
15.6 |
6.6 |
2.2 |
6.8 |
15. Tamil Nadu |
13.2 |
8.8 |
1.0 |
3.4 |
13.5 |
9.2 |
0.9 |
3.4 |
14.7 |
10.3 |
1.0 |
3.5 |
14.6 |
10.3 |
0.9 |
3.3 |
16. Uttar Pradesh |
16.5 |
6.5 |
1.4 |
8.6 |
19.4 |
7.2 |
1.9 |
10.2 |
21.6 |
8.0 |
2.1 |
11.5 |
21.8 |
8.5 |
1.9 |
11.3 |
17. West Bengal |
9.9 |
4.5 |
0.5 |
4.9 |
10.0 |
4.5 |
0.5 |
5.0 |
10.8 |
4.5 |
0.5 |
5.7 |
12.1 |
4.9 |
0.5 |
6.7 |
II. Special Category |
27.4 |
5.0 |
3.1 |
19.3 |
28.0 |
5.5 |
2.4 |
20.2 |
31.0 |
6.0 |
2.5 |
22.5 |
31.7 |
6.0 |
2.6 |
23.1 |
1. Arunachal Pradesh |
54.7 |
1.8 |
7.8 |
45.1 |
65.9 |
2.6 |
6.4 |
56.8 |
71.1 |
2.7 |
4.0 |
64.4 |
65.0 |
2.8 |
4.2 |
58.0 |
2. Assam |
20.4 |
5.2 |
2.6 |
12.7 |
22.1 |
5.7 |
2.3 |
14.1 |
28.3 |
6.3 |
2.3 |
19.7 |
29.1 |
6.2 |
2.7 |
20.2 |
3. Himachal Pradesh |
24.1 |
5.5 |
3.7 |
14.9 |
23.2 |
6.7 |
3.1 |
13.5 |
23.9 |
7.1 |
3.0 |
13.8 |
24.3 |
7.5 |
3.0 |
13.8 |
4. Jammu and Kashmir |
37.9 |
5.8 |
2.4 |
29.7 |
40.6 |
6.4 |
2.0 |
32.3 |
41.0 |
7.7 |
3.0 |
30.3 |
42.7 |
7.7 |
3.0 |
31.9 |
5. Manipur |
43.6 |
1.8 |
2.0 |
39.7 |
56.5 |
2.8 |
2.7 |
51.0 |
55.4 |
2.9 |
2.7 |
49.9 |
68.7 |
2.9 |
3.4 |
62.4 |
6. Meghalaya |
24.4 |
3.4 |
2.1 |
19.0 |
30.2 |
4.1 |
2.1 |
24.0 |
35.2 |
3.7 |
2.5 |
29.1 |
37.6 |
3.9 |
2.5 |
31.2 |
7. Mizoram |
56.2 |
1.9 |
3.6 |
50.8 |
55.7 |
2.1 |
2.4 |
51.1 |
59.0 |
2.6 |
3.4 |
53.0 |
59.8 |
2.4 |
2.9 |
54.6 |
8. Nagaland |
35.3 |
1.6 |
1.4 |
32.4 |
45.0 |
2.0 |
1.6 |
41.3 |
48.5 |
2.2 |
1.4 |
44.8 |
49.8 |
2.2 |
1.5 |
46.0 |
9. Sikkim |
103.3 |
7.5 |
53.3 |
42.4 |
54.0 |
4.9 |
20.1 |
28.9 |
69.9 |
4.0 |
19.1 |
46.8 |
68.8 |
5.1 |
14.7 |
49.0 |
10. Tripura |
30.4 |
3.0 |
1.1 |
26.3 |
29.7 |
3.6 |
0.8 |
25.4 |
32.4 |
4.0 |
0.8 |
27.7 |
31.9 |
4.0 |
0.8 |
27.1 |
11. Uttarakhand |
18.1 |
6.1 |
1.9 |
10.0 |
15.3 |
5.8 |
0.9 |
8.6 |
16.6 |
6.4 |
1.2 |
9.1 |
16.4 |
6.1 |
1.2 |
9.1 |
All States# |
11.9 |
5.7 |
1.4 |
4.7 |
12.2 |
6.0 |
1.2 |
5.0 |
12.9 |
6.2 |
1.2 |
5.5 |
13.1 |
6.3 |
1.2 |
5.6 |
Memo Item: |
|
|
|
|
|
|
|
|
|
|
|
|
|
|
|
|
1. NCT Delhi |
9.1 |
7.4 |
1.1 |
0.6 |
9.5 |
6.2 |
1.6 |
1.6 |
9.5 |
6.4 |
0.2 |
0.6 |
7.7 |
7.0 |
0.2 |
0.5 |
2. Puducherry |
22.8 |
6.6 |
6.6 |
9.5 |
24.8 |
11.6 |
5.7 |
7.4 |
24.8 |
12.8 |
1.0 |
8.4 |
30.0 |
15.0 |
0.8 |
14.2 |
Avg.: Average. RE: Revised Estimates. ONTR: Own Non-Tax Revenue. CT: Current Transfers.
RR: Revenue Receipts. OTR: Own Tax Revenue. GSDP: Gross State Domestic Product.
*: Data for Puducherry pertain to 2006-07.
#: Data for All States are as per cent to GDP.
Source: Based on Budget Documents of the state governments. |
 |
Expenditure Pattern
4.18 Aggregate expenditure of the states as a
ratio to GDP which, during 2011-12 (RE), was
higher than even in the crisis years, is placed
marginally lower at 16.1 per cent in 2012-13
(Table IV.16).
Revenue Expenditure
4.19 During 2012-13, the consolidated RE-GDP
ratio is budgeted to decline by 0.1 percentage
points due to lower growth in the development
component (both social and economic services).
Within social services, revenue expenditure on
‘water supply & sanitation’ and ‘expenditure on
natural calamities’ is budgeted to decline in 2012-
13. Among economic services, ‘irrigation & flood
control’, ‘rural development’ and ‘transport and
communication’ are budgeted to grow at a slower
pace during 2012-13. Despite a deceleration in
the growth of interest payments and administrative
services, the growth in non-development revenue
expenditure is budgeted to increase in 2012-13,
mainly due to higher growth of pension expenditure.
However, committed expenditure as a ratio of
revenue receipts, which had declined by 2.0 percentage points to 31.0 per cent in 2011-12
(RE), is budgeted to decline further to 30.6 per
cent in 2012-13 (Chart IV.3 and Appendix Table 4).
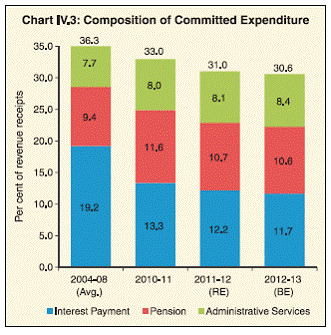 |
Table IV.11: Cost Recovery of Select Services |
(Ratio of Non-Tax Revenue to Non-Plan Revenue Expenditure) |
(Per cent) |
Item |
2000-04 |
2004-08 |
2008-10 |
2010-11 |
2011-12
(RE) |
2012-13
(BE) |
Average |
1 |
2 |
3 |
4 |
5 |
6 |
7 |
A. Social Services |
|
|
|
|
|
|
of which: |
|
|
|
|
|
|
(a) Education $ |
1.5 |
2.6 |
3.2 |
4.0 |
4.7 |
5.5 |
(b) Health * |
5.2 |
5.2 |
5.2 |
3.9 |
4.3 |
4.2 |
B. Economic Services |
|
|
|
|
|
|
of which: |
|
|
|
|
|
|
(a) Irrigation # |
9.8 |
15.3 |
16.1 |
16.1 |
20.6 |
21.1 |
(b) Power |
6.4 |
14.3 |
18.1 |
13.4 |
14.0 |
14.1 |
(c) Roads @ |
18.3 |
10.1 |
5.8 |
6.9 |
6.1 |
6.6 |
RE: Revised Estimates.
$ : Also includes expenditure on sports, art and culture.
* : Includes expenditure on medical and public health and family welfare.
# : Relates to irrigation and fl ood control for non-plan revenue expenditure,
and to major, medium and minor irrigation for non-tax revenue.
@ : Relates to roads and bridges for non-plan revenue expenditure, and to
road transport for non-tax revenue.
Note: Accounting in respect of power sector has not been uniform across the
states which has, at times, resulted in adjustment across years.
Source: Compiled from the Budget Documents of the state governments. |
4.20 In 2012-13, the RE-GSDP ratio is budgeted
to decline in 17 states, with the DRE-GSDP and
NDRE-GSDP ratios declining in 15 and 19 states,
respectively. Expenditures on pension and interest
payments as ratios to GSDP are budgeted to
decline in 18 and 19 states, respectively (Table
IV.12).
Table IV.12: Revenue Expenditure of the State Governments |
(Per cent) |
State |
2004-08 (Avg.)* |
2010-11 |
2011-12 (RE) |
2012-13 (BE) |
RE/
GS
DP |
DRE/
GS
DP |
ND
RE/
GS
DP |
IP/
GS
DP |
PN/
GS
DP |
RE/
GS
DP |
DRE/
GS
DP |
ND
RE/
GS
DP |
IP/
GS
DP |
PN/
GS
DP |
RE/
GS
DP |
DRE/
GS
DP |
ND
RE/
GS
DP |
IP/
GS
DP |
PN/
GS
DP |
RE/
GS
DP |
DRE/
GS
DP |
ND
RE/
GS
DP |
IP/
GS
DP |
PN/
GS
DP |
1 |
2 |
3 |
4 |
5 |
6 |
7 |
8 |
9 |
10 |
11 |
7 |
8 |
9 |
10 |
11 |
7 |
8 |
9 |
10 |
11 |
I. Non-Special Category |
13.7 |
7.6 |
5.8 |
2.7 |
1.3 |
13.7 |
8.2 |
5.1 |
1.9 |
1.6 |
14.6 |
9.0 |
5.1 |
1.8 |
1.6 |
14.4 |
8.8 |
5.2 |
1.8 |
1.6 |
1. Andhra Pradesh |
14.0 |
8.7 |
5.3 |
2.6 |
1.3 |
13.3 |
8.8 |
4.5 |
1.6 |
1.6 |
14.3 |
9.7 |
4.5 |
1.6 |
1.6 |
14.5 |
10.1 |
4.4 |
1.6 |
1.5 |
2. Bihar |
20.0 |
10.9 |
9.1 |
3.8 |
2.7 |
17.9 |
10.8 |
7.2 |
2.0 |
2.9 |
23.4 |
15.3 |
8.1 |
2.0 |
3.2 |
23.1 |
14.7 |
8.4 |
2.0 |
3.8 |
3. Chhattisgarh |
13.9 |
9.0 |
4.3 |
1.8 |
0.9 |
16.5 |
11.4 |
4.5 |
1.0 |
1.5 |
18.9 |
13.8 |
4.6 |
0.9 |
1.4 |
17.3 |
12.4 |
4.4 |
0.8 |
1.3 |
4. Goa |
14.9 |
10.1 |
4.8 |
2.6 |
1.0 |
14.7 |
10.1 |
4.6 |
2.0 |
1.1 |
13.9 |
9.9 |
4.0 |
1.5 |
1.1 |
13.5 |
9.9 |
3.6 |
1.4 |
0.9 |
5. Gujarat |
10.7 |
6.2 |
4.5 |
2.6 |
0.9 |
11.2 |
7.3 |
3.9 |
1.9 |
1.1 |
10.2 |
6.5 |
3.7 |
1.9 |
1.0 |
10.7 |
6.6 |
4.1 |
1.8 |
0.9 |
6. Haryana |
11.9 |
7.6 |
4.1 |
1.9 |
0.9 |
10.7 |
7.2 |
3.5 |
1.3 |
1.2 |
11.7 |
8.1 |
3.5 |
1.4 |
1.1 |
10.8 |
7.4 |
3.3 |
1.4 |
0.9 |
7. Jharkhand |
15.6 |
10.3 |
5.4 |
1.5 |
1.2 |
18.3 |
12.1 |
6.2 |
2.0 |
1.7 |
20.3 |
13.6 |
6.7 |
1.9 |
1.7 |
19.9 |
13.8 |
6.1 |
1.7 |
1.6 |
8. Karnataka |
14.5 |
8.9 |
4.9 |
1.9 |
1.2 |
14.2 |
9.7 |
3.7 |
1.5 |
1.1 |
15.0 |
10.0 |
4.0 |
1.4 |
1.3 |
15.5 |
9.8 |
4.6 |
1.4 |
1.3 |
9. Kerala |
13.9 |
6.7 |
6.6 |
2.8 |
2.3 |
12.5 |
5.9 |
5.6 |
2.1 |
2.1 |
13.8 |
6.9 |
5.8 |
1.9 |
2.4 |
13.2 |
6.8 |
5.3 |
1.8 |
2.1 |
10. Madhya Pradesh |
16.0 |
8.9 |
6.1 |
2.8 |
1.2 |
16.6 |
10.1 |
5.4 |
1.9 |
1.4 |
18.5 |
11.5 |
5.8 |
1.9 |
1.6 |
18.9 |
11.7 |
6.1 |
1.9 |
1.7 |
11. Maharashtra |
10.8 |
6.2 |
4.4 |
2.0 |
0.7 |
10.0 |
6.3 |
3.5 |
1.5 |
0.8 |
10.6 |
6.9 |
3.6 |
1.4 |
0.8 |
10.2 |
6.4 |
3.7 |
1.4 |
0.8 |
12. Odisha |
15.5 |
7.8 |
7.4 |
3.6 |
1.5 |
15.1 |
9.7 |
5.1 |
1.6 |
2.1 |
16.4 |
10.5 |
5.6 |
1.8 |
2.0 |
15.9 |
9.6 |
6.1 |
1.7 |
2.2 |
13. Punjab |
16.1 |
6.7 |
9.1 |
3.4 |
1.5 |
14.6 |
6.1 |
8.3 |
2.5 |
2.4 |
14.4 |
7.2 |
6.4 |
2.5 |
1.9 |
14.2 |
7.7 |
5.9 |
2.3 |
1.6 |
14. Rajasthan |
15.1 |
8.9 |
6.2 |
3.5 |
1.2 |
13.9 |
8.7 |
5.2 |
2.3 |
1.6 |
15.1 |
9.9 |
5.2 |
2.1 |
1.6 |
15.4 |
10.3 |
5.0 |
2.1 |
1.7 |
15. Tamil Nadu |
12.6 |
6.7 |
5.0 |
1.9 |
1.7 |
14.1 |
7.9 |
5.0 |
1.5 |
2.3 |
14.6 |
8.4 |
4.9 |
1.5 |
2.1 |
14.2 |
8.2 |
4.7 |
1.5 |
2.0 |
16. Uttar Pradesh |
16.7 |
8.3 |
7.5 |
3.4 |
1.4 |
18.8 |
9.6 |
8.4 |
2.5 |
2.2 |
20.3 |
11.2 |
8.3 |
2.3 |
2.2 |
21.0 |
11.3 |
8.9 |
2.3 |
2.6 |
17. West Bengal |
13.2 |
6.1 |
6.9 |
4.2 |
1.5 |
13.6 |
7.5 |
6.1 |
2.9 |
1.7 |
13.9 |
8.1 |
5.7 |
2.9 |
1.5 |
13.2 |
7.4 |
5.7 |
2.9 |
1.5 |
II. Special Category |
24.5 |
14.4 |
10.0 |
3.6 |
2.2 |
25.7 |
15.1 |
9.9 |
2.7 |
2.8 |
28.6 |
16.9 |
10.7 |
2.7 |
2.9 |
28.0 |
16.8 |
10.1 |
2.6 |
2.8 |
1. Arunachal Pradesh |
45.4 |
31.9 |
13.4 |
4.1 |
2.0 |
45.5 |
30.1 |
15.4 |
4.9 |
2.7 |
51.3 |
36.5 |
14.8 |
3.3 |
2.6 |
41.9 |
29.4 |
12.5 |
3.3 |
2.5 |
2. Assam |
18.1 |
11.2 |
6.9 |
2.4 |
1.8 |
22.0 |
12.7 |
7.4 |
1.8 |
2.3 |
28.0 |
16.3 |
9.1 |
1.8 |
2.1 |
28.0 |
17.0 |
8.0 |
1.6 |
2.0 |
3. Himachal Pradesh |
24.4 |
13.7 |
10.7 |
5.8 |
2.7 |
24.2 |
14.6 |
9.7 |
3.6 |
3.8 |
23.2 |
13.7 |
9.4 |
3.4 |
3.7 |
23.7 |
14.0 |
9.7 |
3.3 |
4.1 |
4. Jammu and Kashmir |
31.9 |
18.6 |
13.3 |
4.6 |
2.8 |
33.7 |
19.5 |
14.2 |
4.2 |
4.1 |
36.1 |
20.2 |
15.9 |
4.1 |
4.5 |
35.0 |
19.2 |
15.8 |
3.8 |
4.3 |
5. Manipur |
35.1 |
21.5 |
13.6 |
4.6 |
3.4 |
42.5 |
24.2 |
17.1 |
3.8 |
4.2 |
52.1 |
29.5 |
20.8 |
3.6 |
6.0 |
54.4 |
32.8 |
19.9 |
3.6 |
6.0 |
6. Meghalaya |
23.1 |
14.7 |
8.4 |
2.4 |
1.3 |
28.5 |
19.1 |
9.3 |
1.8 |
2.1 |
31.3 |
22.6 |
8.7 |
1.8 |
1.5 |
32.2 |
24.5 |
7.7 |
1.8 |
1.2 |
7. Mizoram |
51.9 |
33.6 |
18.3 |
6.3 |
2.8 |
56.1 |
37.1 |
19.1 |
4.1 |
4.1 |
56.3 |
37.9 |
18.4 |
3.9 |
3.9 |
52.0 |
35.3 |
16.7 |
3.0 |
3.4 |
8. Nagaland |
30.7 |
16.2 |
14.4 |
3.8 |
2.8 |
37.7 |
21.1 |
16.6 |
3.5 |
3.0 |
42.4 |
23.1 |
19.3 |
3.6 |
4.8 |
39.9 |
21.6 |
18.3 |
3.8 |
5.1 |
9. Sikkim |
92.2 |
30.9 |
61.3 |
5.2 |
2.0 |
51.5 |
23.3 |
28.0 |
3.3 |
2.8 |
56.7 |
29.4 |
26.8 |
2.9 |
2.6 |
51.2 |
26.7 |
23.8 |
2.9 |
3.4 |
10. Tripura |
23.8 |
12.6 |
10.8 |
3.7 |
2.5 |
25.1 |
13.5 |
11.0 |
2.6 |
3.8 |
25.5 |
14.3 |
10.6 |
2.5 |
3.5 |
26.3 |
15.0 |
10.8 |
2.5 |
3.4 |
11. Uttarakhand |
18.1 |
10.9 |
6.7 |
2.7 |
1.4 |
15.3 |
9.3 |
5.5 |
2.0 |
1.5 |
16.4 |
10.0 |
5.8 |
2.1 |
1.6 |
16.0 |
9.6 |
5.5 |
2.1 |
1.5 |
All States# |
11.9 |
6.6 |
5.0 |
2.3 |
1.1 |
12.1 |
7.3 |
4.6 |
1.6 |
1.7 |
12.8 |
7.9 |
4.5 |
1.6 |
1.6 |
12.7 |
7.8 |
4.5 |
1.5 |
1.7 |
Memo Item: |
|
|
|
|
|
|
|
|
|
|
|
|
|
|
|
|
|
|
|
|
1. NCT Delhi |
5.8 |
3.4 |
2.0 |
1.6 |
0.0 |
5.4 |
3.8 |
1.4 |
1.0 |
0.0 |
6.1 |
4.4 |
1.4 |
0.9 |
0.0 |
6.1 |
4.1 |
1.7 |
0.9 |
0.0 |
2. Puducherry |
23.1 |
13.3 |
4.0 |
2.2 |
0.9 |
27.4 |
20.7 |
6.7 |
2.6 |
2.0 |
24.2 |
17.0 |
7.2 |
2.8 |
2.2 |
31.5 |
23.7 |
7.8 |
2.7 |
2.2 |
Avg.: Average. RE: Revised Estimates. NDRE: Non-development Revenue Expenditure. IP: Interest Payment.
RE: Revenue Expenditure. DRE: Development Revenue Expenditure. PN: Pension. GSDP: Gross State Domestic Product.
*: Data for Puducherry pertain to 2006-07. #: Data for All states are as per cent to GDP.
Source: Based on Budget Documents of the state governments. |
4.21 The committed expenditure5 of NSC
states, SC states and all states at the consolidated
level declined during 2008-10 compared with
2004-08, reflecting the impact of a sharp decline
in interest payments. During 2010-11 to 2012-13
(BE), the committed expenditure of all states and
NSC states at the consolidated level has remained stable at 4.0 per cent of GDP and 4.5 per cent of
GSDP, respectively. However, the committed
expenditure of SC states at the consolidated level,
which had increased during 2011-12 (RE), is
budgeted to decline during 2012-13 (Table IV.13).
It may be mentioned that the average committed
expenditure during 2010-11 to 2012-13 in three
chronic revenue defi cit states, viz., Kerala, Punjab
and West Bengal, accounted for 41.3 per cent,
47.6 per cent and 50.0 per cent, respectively, of
the revenue receipts.
Table IV.13: Interest Payments, Pension and Committed Expenditure |
(As per cent to GSDP) |
|
2004-08
(Avg.) |
2008-10
(Avg.) |
2010-11 |
2011-12
(RE) |
2012-13
(BE) |
1 |
2 |
3 |
4 |
5 |
6 |
Interest Payments |
|
|
|
|
|
(i) Non-Special
Category States |
2.7 |
2.0 |
1.9 |
1.8 |
1.8 |
(ii) Special Category
States |
3.6 |
3.0 |
2.7 |
2.7 |
2.6 |
(iii) All States
Consolidated* |
2.3 |
1.8 |
1.6 |
1.6 |
1.5 |
Pension |
|
|
|
|
|
(i) Non-Special Category States |
1.3 |
1.4 |
1.6 |
1.6 |
1.6 |
(ii) Special Category
States |
2.2 |
2.3 |
2.8 |
2.9 |
2.8 |
(iii) All States
Consolidated* |
1.1 |
1.2 |
1.4 |
1.4 |
1.4 |
Committed Expenditure |
|
|
|
|
|
(i) Non-Special
Category States |
5.0 |
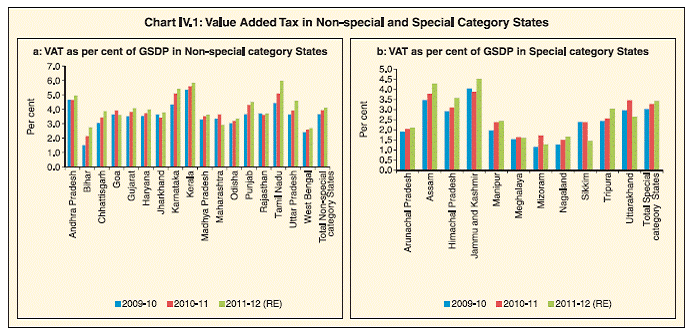
4.4 |
4.5 |
4.5 |
4.5 |
(ii) Special Category
States |
8.8 |
8.6 |
8.9 |
9.6 |
9.2 |
(iii) All States
Consolidated* |
4.3 |
4.0 |
4.0 |
4.0 |
4.0 |
* : As a ratio to GDP. RE: Revised Estimates BE: Budget Estimates
Note: Committed expenditure comprises expenditure on interest
payments, pension and administrative services.
Source: Budget documents of the state governments. |
Capital Expenditure
4.22 Growth in capital expenditure is budgeted
to decelerate during 2012-13, which reflects the slower pace of expansion in capital outlay.
Development capital outlay on economic services,
which accounts for around 68.0 per cent of the
total capital outlay, is budgeted to grow at a lower
rate in 2012-13 than in 2011-12 (RE). Capital
outlay on ‘energy’ is budgeted to decline over the
same period. Non-development capital outlay is
also budgeted to decelerate during 2012-13.
Despite the deceleration in its growth rate, capital
outlay as a ratio to GDP at the consolidated level
is placed marginally higher at 2.3 per cent in 2012-
13 (BE). State-wise capital outlays as ratios to
GSDP are budgeted to increase in 17 states in
2012-13 [18 states in 2011-12 (RE)]. The budgeted
decline in loans and advances by the states is
attributable to a decline in loans for economic
services, viz., ‘rural development’ and ‘power’ and
a sharp deceleration in the non-development
component (Appendix Table 6).
Development Expenditure
4.23 Development expenditure remains the
largest component of aggregate expenditure,
although its share in aggregate expenditure shows
a marginal decline to 63.3 per cent in 2012-13(BE).
The share of development revenue expenditure in
aggregate expenditure is budgeted to decline in
2012-13. Within development revenue expenditure,
growth rate in expenditure on both social and economic services is budgeted to be lower in
2012-13. However, developmental capital outlay
as a ratio to total expenditure is budgeted to record
an increase of 0.7 percentage points in 2012-13,
which is attributable to higher outlays in the ‘major
and medium irrigation and flood control’ and
‘transport’ sectors. The share of loans and
advances for development purposes is also
budgeted to decline during 2012-13 due to a sharp
decline in loans to ‘power projects’. In 2012-13, development expenditure-GSDP ratios are
budgeted to decline in 17 states, while the
consolidated development expenditure-GDP ratio
is budgeted lower at 10.2 per cent. Among NSC
states, the development expenditure-GSDP ratio
remained higher than the average in 10 of the 17
NSC states. The improvement seen in select
states, viz., Bihar, Chhattisgarh, Jharkhand and
Madhya Pradesh, in recent years is noteworthy
(Tables IV.14, IV.15 and Appendix Tables 8 to 14).
Table IV.14: Components of Development Expenditure |
(Amount in ` billion) |
Year |
Develop-
ment
Revenue
Expendi-
ture |
Develop-
ment
Capital
Outlay |
Develop-
ment
Loans &
Advances |
Total
Develop-
ment
Expendi-
ture |
1 |
2 |
3 |
4 |
5 |
2010-11 |
5,567.0 |
1,452.5 |
184.0 |
7,203.5 |
|
(48.0) |
(12.5) |
(1.6) |
(62.2) |
2011-12 (RE) |
7,016.7 |
1,828.4 |
363.6 |
9,208.8 |
|
(49.0) |
(12.8) |
(2.5) |
(64.3) |
2012-13 (BE) |
7,877.6 |
2,201.2 |
253.7 |
10,332.4 |
|
(48.3) |
(13.5) |
(1.6) |
(63.3) |
RE: Revised Estimates. BE: Budget Estimates.
Note: Figures in parentheses are per cent to aggregate expenditure.
Source: Budget Documents of the state governments. |
Table IV.15: Development Expenditure: Select Indicators |
(Per cent) |
State |
2004-08 (Avg.)* |
2010-11 |
2011-12 (RE) |
2012-13 (BE) |
DEV/
GSDP |
SSE/
GSDP |
CO/
GSDP |
DEV/
GSDP |
SSE/
GSDP |
CO/
GSDP |
DEV/
GSDP |
SSE/
GSDP |
CO/
GSDP |
DEV/
GSDP |
SSE/
GSDP |
CO/
GSDP |
1 |
2 |
3 |
4 |
5 |
6 |
7 |
8 |
9 |
10 |
11 |
12 |
13 |
I. Non-Special Category |
10.3 |
5.9 |
2.4 |
10.5 |
6.7 |
2.2 |
11.8 |
7.4 |
2.4 |
11.6 |
7.4 |
2.6 |
1. Andhra Pradesh |
12.2 |
6.2 |
3.0 |
11.2 |
6.6 |
1.9 |
12.5 |
7.2 |
2.2 |
13.2 |
7.6 |
2.6 |
2. Bihar |
15.3 |
10.2 |
3.6 |
15.4 |
9.1 |
4.3 |
20.4 |
12.7 |
5.3 |
19.5 |
12.8 |
5.1 |
3. Chhattisgarh |
12.7 |
8.2 |
3.2 |
14.3 |
10.1 |
2.5 |
19.0 |
13.0 |
4.3 |
17.9 |
11.6 |
4.4 |
4. Goa |
13.3 |
6.1 |
3.7 |
13.3 |
6.4 |
3.8 |
13.1 |
6.6 |
3.8 |
12.9 |
7.0 |
3.6 |
5. Gujarat |
8.8 |
4.7 |
2.4 |
9.3 |
5.6 |
1.9 |
8.9 |
5.2 |
2.4 |
9.6 |
5.6 |
3.0 |
6. Haryana |
9.3 |
4.3 |
1.6 |
8.8 |
5.2 |
1.5 |
9.7 |
5.8 |
1.5 |
8.8 |
5.2 |
1.3 |
7. Jharkhand |
15.5 |
9.8 |
3.9 |
16.1 |
11.1 |
3.9 |
17.2 |
11.6 |
3.4 |
19.0 |
12.0 |
4.9 |
8. Karnataka |
12.2 |
6.2 |
3.2 |
13.6 |
7.5 |
3.5 |
13.5 |
7.6 |
3.2 |
12.9 |
7.4 |
2.8 |
9. Kerala |
7.6 |
5.4 |
0.6 |
7.4 |
4.9 |
1.2 |
8.6 |
5.7 |
1.5 |
8.7 |
5.5 |
1.7 |
10. Madhya Pradesh |
14.5 |
7.3 |
4.4 |
14.6 |
8.6 |
3.2 |
19.7 |
9.5 |
3.1 |
16.5 |
10.3 |
3.2 |
11. Maharashtra |
8.5 |
4.8 |
1.9 |
8.0 |
5.0 |
1.7 |
8.5 |
5.4 |
1.5 |
8.1 |
5.4 |
1.7 |
12. Odisha |
9.5 |
6.2 |
1.6 |
12.0 |
7.8 |
2.2 |
12.8 |
8.6 |
2.1 |
12.3 |
7.8 |
2.7 |
13. Punjab |
8.2 |
3.6 |
1.4 |
7.1 |
3.7 |
1.1 |
8.7 |
5.4 |
1.6 |
9.3 |
5.5 |
2.0 |
14. Rajasthan |
12.0 |
7.6 |
3.0 |
10.3 |
7.0 |
1.6 |
12.3 |
8.1 |
2.2 |
12.6 |
8.3 |
2.4 |
15. Tamil Nadu |
9.1 |
5.7 |
1.9 |
10.6 |
7.0 |
2.4 |
11.9 |
7.2 |
2.8 |
11.2 |
7.4 |
3.0 |
16. Uttar Pradesh |
11.9 |
7.1 |
3.4 |
13.2 |
8.8 |
3.5 |
15.2 |
10.4 |
4.1 |
14.9 |
10.4 |
3.7 |
17. West Bengal |
7.4 |
5.0 |
0.8 |
8.0 |
6.4 |
0.5 |
8.8 |
7.1 |
0.7 |
8.8 |
6.6 |
1.3 |
II. Special Category |
20.0 |
10.8 |
5.8 |
20.1 |
11.4 |
5.3 |
23.0 |
12.9 |
6.7 |
22.5 |
12.8 |
6.5 |
1. Arunachal Pradesh |
44.5 |
19.7 |
13.0 |
49.3 |
19.0 |
20.2 |
59.8 |
25.1 |
36.5 |
37.7 |
16.3 |
26.3 |
2. Assam |
14.4 |
8.3 |
2.6 |
14.6 |
9.8 |
1.9 |
20.3 |
12.0 |
4.1 |
20.9 |
12.8 |
3.6 |
3. Himachal Pradesh |
17.0 |
10.5 |
3.4 |
18.1 |
11.0 |
3.3 |
17.3 |
10.4 |
3.1 |
17.4 |
10.3 |
2.9 |
4. Jammu and Kashmir |
28.3 |
13.3 |
11.2 |
29.9 |
13.6 |
11.1 |
29.6 |
14.6 |
10.9 |
28.5 |
14.1 |
10.5 |
5. Manipur |
33.2 |
16.9 |
12.8 |
41.4 |
20.1 |
20.0 |
45.6 |
21.9 |
18.9 |
49.2 |
21.3 |
18.4 |
6. Meghalaya |
18.5 |
10.7 |
3.8 |
23.1 |
12.4 |
4.1 |
28.7 |
15.2 |
6.1 |
31.5 |
17.0 |
7.5 |
7. Mizoram |
47.8 |
24.3 |
14.0 |
47.2 |
26.3 |
10.2 |
47.7 |
25.9 |
9.8 |
46.2 |
22.9 |
11.1 |
8. Nagaland |
23.7 |
12.2 |
8.6 |
29.3 |
14.2 |
10.1 |
32.8 |
15.6 |
11.8 |
30.0 |
14.7 |
13.3 |
9. Sikkim |
47.2 |
26.1 |
17.3 |
30.4 |
18.8 |
8.0 |
47.4 |
27.8 |
17.8 |
45.1 |
26.1 |
21.0 |
10. Tripura |
19.1 |
11.7 |
7.3 |
18.9 |
12.4 |
6.1 |
22.1 |
15.2 |
8.9 |
19.6 |
12.9 |
8.2 |
11. Uttarakhand |
15.7 |
8.9 |
4.9 |
11.7 |
7.9 |
2.4 |
13.3 |
8.8 |
2.9 |
13.4 |
9.2 |
3.7 |
All States# |
9.1 |
5.2 |
2.2 |
9.4 |
5.9 |
2.0 |
10.4 |
6.4 |
2.2 |
10.2 |
6.4 |
2.3 |
Memo Item: |
|
|
|
|
|
|
|
|
|
|
|
|
1. NCT Delhi |
6.8 |
4.2 |
1.6 |
6.7 |
4.1 |
1.5 |
6.7 |
4.5 |
1.3 |
6.1 |
4.3 |
1.3 |
2. Puducherry |
21.0 |
10.0 |
3.6 |
23.1 |
12.0 |
2.9 |
19.4 |
13.1 |
2.9 |
26.7 |
19.1 |
3.3 |
Avg.: Average. DEV: Development Expenditure. RE: Revised Estimates. SSE: Social Sector Expenditure.
CO: Capital Outlay. GSDP: Gross State Domestic Product.
*: Data for Puducherry pertain to 2006-07.
#: Data for All States are as per cent to GDP.
Source: Based on Budget Documents of the state governments. |
4.24 The share of social sector expenditure
(SSE) in total expenditure, which had declined
during 1998-2004 and 2004-08, has since
increased sharply to 40.0 per cent in 2012-13. The
SSE to GDP ratio, which had increased by 0.5
percentage points to 6.4 per cent in 2011-12 (RE),
is budgeted to remain at the same level in 2012-13
(Table IV.16). Thirteen states have budgeted for an
increase in their SSE-GSDP ratios as against 25
states in 2011-12(RE) (Table IV.15). There has
been a steady increase in the share of SSE in total
expenditure during 2010-11 to 2012-13 (BE). It may be noted that, within social services, the
shares of ‘education, sports, art and culture’ and‘water supply and sanitation’ showed a steady
decline, while the shares of ‘urban development’,
and ‘welfare of SCs, STs and OBCs’ increased
gradually during 2010-11 to 2012-13(BE) (Table
IV.17 and Appendix Table 15).
Table IV.16: Trends in Aggregate Social Sector Expenditure of State Governments |
(Per cent) |
Item |
1990-98 |
1998-2004 |
2004-08 |
2008-10 |
2010-11 |
2011-12 (RE) |
2012-13 (BE) |
Average |
1 |
2 |
3 |
4 |
5 |
6 |
7 |
8 |
TE/GDP |
15.0 |
15.9 |
15.7 |
15.7 |
15.1 |
16.2 |
16.1 |
SSE/GDP |
5.5 |
5.5 |
5.2 |
6.0 |
5.9 |
6.4 |
6.4 |
SSE/TE |
36.6 |
34.5 |
33.1 |
38.1 |
39.0 |
39.8 |
40.0 |
RE: Revised Estimates. BE: Budget Estimates. GDP: Gross Domestic Product.
TE: Total Expenditure. SSE: Social Sector Expenditure.
Source: Budget Documents of the state governments. |
Table IV.17: Composition of Expenditure on Social Services |
(Revenue and Capital Accounts) |
(Per cent to expenditure on social services) |
Item |
1990-98 |
1998-2004 |
2004-08 |
2008-10 |
2010-11 |
2011-12
(RE) |
2012-13
(BE) |
Average |
1 |
2 |
3 |
4 |
5 |
6 |
7 |
8 |
Expenditure on Social Services (a to l) |
100.0 |
100.0 |
100.0 |
100.0 |
100.0 |
100.0 |
100.0 |
(a) Education, Sports, Art and Culture |
51.9 |
52.6 |
47.3 |
44.3 |
47.7 |
46.7 |
46.4 |
(b) Medical and Public Health |
14.7 |
12.1 |
11.3 |
10.4 |
10.5 |
10.4 |
10.6 |
(c) Family Welfare |
1.0 |
2.1 |
1.6 |
1.6 |
1.7 |
1.6 |
1.8 |
(d) Water Supply and Sanitation |
7.3 |
7.6 |
8.2 |
6.7 |
5.0 |
4.8 |
4.3 |
(e) Housing |
2.9 |
2.9 |
2.9 |
3.1 |
2.8 |
2.6 |
2.9 |
(f) Urban Development |
2.4 |
3.2 |
5.4 |
8.7 |
6.6 |
7.5 |
8.3 |
(g) Welfare of SCs, ST and OBCs |
6.6 |
6.3 |
7.0 |
6.9 |
7.0 |
7.1 |
7.3 |
(h) Labour and Labour Welfare |
1.4 |
1.1 |
1.1 |
1.0 |
1.0 |
1.0 |
1.3 |
(i) Social Security and Welfare |
4.4 |
4.7 |
6.5 |
9.4 |
9.9 |
10.4 |
10.3 |
(j) Nutrition |
2.2 |
2.2 |
2.5 |
3.1 |
3.3 |
3.4 |
3.3 |
(k) Expenditure on Natural Calamities |
2.8 |
3.3 |
4.0 |
2.7 |
2.2 |
2.6 |
1.4 |
(l) Others |
2.4 |
2.0 |
2.2 |
2.2 |
2.4 |
1.8 |
2.1 |
RE: Revised Estimates. BE: Budget Estimates.
Source : Budget Documents of the state governments. |
5. Assessment
Revenue Deficit and Gross Fiscal Deficit
4.25 Key deficit indicators of the state
governments at the consolidated level are budgeted to improve during 2012-13 (Table IV.18).
The consolidated revenue surplus is budgeted to
increase by 0.3 percentage points of GDP during
2012-13, with 22 of the 28 states expected to record improvement in their revenue account. Of
these, one state is expected to show a turnaround
in its revenue account from deficit to surplus, while
the revenue surpluses of 16 states are budgeted to rise and the revenue deficits of five states would
moderate in 2012-13.
Table IV.18 : State-wise Correction of RD and GFD - 2012-13 (BE) over 2011-12 (RE) |
State |
Revenue Deficit |
Gross Fiscal Deficit |
Correction over
2011-12 (RE) (` billion) |
Percentage to Total |
Correction over
2011-12 (RE) (` billion) |
Percentage to Total |
1 |
2 |
3 |
4 |
5 |
1. Andhra Pradesh |
-36.6 |
12.4 |
22.3 |
18.9 |
2. Bihar |
-64.0 |
21.6 |
-53.2 |
-45.1 |
3. Chhattisgarh |
-8.2 |
2.8 |
8.4 |
7.1 |
4. Goa |
-0.4 |
0.1 |
1.9 |
1.6 |
5. Gujarat |
-16.9 |
5.7 |
50.6 |
42.9 |
6. Haryana |
-1.1 |
0.4 |
-0.8 |
-0.7 |
7. Jharkhand |
-40.3 |
13.6 |
-10.7 |
-9.1 |
8. Karnataka |
22.1 |
-7.5 |
26.4 |
22.4 |
9. Kerala |
-20.1 |
6.8 |
-5.7 |
-4.9 |
10. Madhya Pradesh |
14.2 |
-4.8 |
21.8 |
18.5 |
11. Maharashtra |
-22.1 |
7.5 |
23.9 |
20.3 |
12. Odisha |
7.4 |
-2.5 |
26.9 |
22.9 |
13. Punjab |
-24.6 |
8.3 |
-7.1 |
-6.0 |
14. Rajasthan |
-4.8 |
1.6 |
9.6 |
8.2 |
15. Tamil Nadu |
-18.4 |
6.2 |
32.4 |
27.5 |
16. Uttar Pradesh |
20.9 |
-7.1 |
28.8 |
24.5 |
17. West Bengal |
-103.0 |
34.8 |
-57.6 |
-48.9 |
Total (A) |
-295.8 |
100.0 |
117.8 |
100.0 |
1. Arunachal Pradesh |
-4.7 |
6.8 |
-12.6 |
28.6 |
2. Assam |
-10.7 |
15.5 |
-6.3 |
14.4 |
3. Himachal Pradesh |
0.8 |
-1.2 |
1.8 |
-4.0 |
4. Jammu and Kashmir |
-22.9 |
33.3 |
-17.3 |
39.5 |
5. Manipur |
-12.5 |
18.1 |
-11.8 |
26.9 |
6. Meghalaya |
-3.8 |
5.6 |
-0.4 |
0.8 |
7. Mizoram |
-4.3 |
6.3 |
-2.3 |
5.1 |
8. Nagaland |
-5.6 |
8.2 |
-2.4 |
5.6 |
9. Sikkim |
-4.0 |
5.8 |
-0.5 |
1.2 |
10. Tripura |
1.0 |
-1.5 |
1.9 |
-4.2 |
11. Uttarakhand |
-2.2 |
3.2 |
6.1 |
-13.9 |
Total (B) |
-68.9 |
100.0 |
-43.9 |
100.0 |
Grand Total (A + B) |
-364.7 |
100 |
73.9 |
100.0 |
Memo item: |
|
|
|
|
1. NCT Delhi |
-24.6 |
- |
-5.7 |
- |
2. Puducherry |
-0.4 |
- |
0.8 |
- |
RE : Revised Estimates. BE : Budget Estimates. ''-' : Not applicable.
Note : Negative (-) sign indicates improvement in deficit indicators.
Source : Budget Documents of the state governments. |
4.26 In line with an improvement in the revenue
account, the consolidated GFD-GDP ratio is
budgeted to be lower in 2012-13, despite an
increase in the CO-GDP ratio. Fiscal deficit in
absolute terms is budgeted to decline in 14 states,
while the GFD-GSDP ratio is placed lower in 18
States during 2012-13. The consolidated capital
outlay (CO)-GDP ratio is budgeted to increase
during 2012-13, with an increase in this ratio being
noticed in 17 states.
Decomposition and Financing of Gross Fiscal
Deficit
4.27 The decomposition of consolidated GFD
shows that capital outlay accounts for over 110
per cent of GFD in 2012-13 (BE). Net lending as a
proportion to GFD is also budgeted to be higher in
2012-13 (Table IV.19). Market borrowings would continue to remain the major source of fi nancing
the GFD of the states. The contribution of NSSF
investment in state government special securities,
which had turned negative in 2011-12 (RE) would
be marginally positive in 2012-13 (BE). The share
of certain public account items, viz., ‘provident
fund’, ‘deposits and advances’ and ‘suspense and
miscellaneous’ in GFD, is expected to decline
during 2012-13 (Table IV.19).
Budgetary Variations: State Budget vis-à-vis Union
Budget
4.28 Variations in the common items as
presented in the state budgets and the Union
budget continued in 2012-13. In 2010-11 and
2011-12, states overestimated the grants and
loans they receive from the centre, but
underestimated their share in central taxes.
However, for 2012-13 states have overestimated
all the items as compared with the Union Budget.
Table IV.19: Decomposition and Financing Pattern of Gross Fiscal Deficit - 2010-11
(Accounts) to 2012-13 (BE) |
(Per cent to GFD) |
Item |
2010-11 |
2011-12 (RE) |
2012-13 (BE) |
1 |
2 |
3 |
4 |
Decomposition (1+2+3-4) |
100.0 |
100.0 |
100.0 |
1. Revenue Deficit |
-1.9 |
-2.9 |
-19.8 |
2. Capital Outlay |
94.1 |
93.9 |
110.2 |
3. Net Lending |
8.6 |
9.1 |
9.7 |
4. Non-debt Capital Receipts |
0.8 |
0.1 |
0.1 |
Financing (1 to 11) |
100.0 |
100.0 |
100.0 |
1. Market Borrowings |
55.0 |
75.4 |
82.3 |
2. Loans from Centre |
0.4 |
3.6 |
5.3 |
3. Special Securities issued to NSSF/Small Savings |
23.9 |
-1.2 |
0.6 |
4. Loans from LIC, NABARD, NCDC, SBI and Other Banks |
2.0 |
2.9 |
3.9 |
5. State Provident Fund etc. |
17.2 |
12.3 |
10.8 |
6. Reserve Funds |
1.6 |
2.7 |
2.9 |
7. Deposits and Advances |
14.2 |
5.2 |
2.0 |
8. Suspense and Miscellaneous |
0.2 |
2.3 |
-2.0 |
9. Remittances |
-0.6 |
-3.0 |
-0.7 |
10. Others |
-4.8 |
-3.6 |
-4.6 |
11. Overall Surplus (-) / Deficit (+) |
-9.2 |
3.4 |
-0.5 |
BE : Budget Estimates. RE : Revised Estimates.
Note : 1. See Notes to Appendix Table 17.
2. 'Others' include Compensation and Other Bonds, Loans from Other Institutions, Appropriation to Contingency Fund, Inter-State
Settlement and Contingency Fund.
Source : Budget Documents of the state governments. |
Table IV.20: Budgetary Data Variation- State Budgets and Union Budget |
(Amount in ` billion) |
Item |
2010-11 (BE) |
2011-12 (BE) |
2012-13 (BE) |
State Budgets |
Union Budget |
Diffe rence* |
State Budgets |
Union Budget |
Diffe rence* |
State Budgets |
Union Budget |
Diffe rence* |
1 |
2 |
3 |
4 |
5 |
6 |
7 |
8 |
9 |
10 |
1. Shareable Taxes from Centre |
2,004.7 |
2,090.0 |
-85.3 |
2,508.9 |
2,634.6 |
-125.6 |
3,021.9 |
3,019.2 |
2.7 |
2. Grants-in-Aid |
1,832.8 |
1,519.6 |
313.2 |
2,287.5 |
1,871.3 |
416.2 |
2,638.2 |
2,108.8 |
529.5 |
3. Loans from Centre (Net) |
69.7 |
33.6 |
36.1 |
95.8 |
7.3 |
88.5 |
113.9 |
26.0 |
87.9 |
4. NSSF (Net) |
120.8 |
298.6 |
-177.8 |
174.9 |
341.7 |
-166.8 |
12.8 |
-158.2 |
171.0 |
*: Negative (-)/Positive (+) sign implies under estimation/over estimation in State budgets in comparison with Union Budget.
Source: Budget Documents of the state governments and the Union Government. |
Any shortfall in the current transfers from the
centre could reduce the consolidated revenue
surplus of the states (Table IV.20).
Performance of states vis-à-vis Projections of the
FC-XIII
4.29 FC-XIII had chalked out a fiscal
consolidation path for states, stipulating that states
achieve revenue balance and a fiscal deficit-GSDP
ratio of 3.0 per cent by 2014-15. FC-XIII had also
made a state-wise assessment of own receipts
and select expenditures for each of the years in the award period of 2010-15. Although the own tax
revenue-GSDP ratio of the states at the
consolidated level was increasing during the
period 2010-11 to 2012-13, it was lower than the
FC-XIII’s assessment of the same. Within revenue
expenditure, states were placed better in the case
of expenditure on interest payments as a ratio to
GSDP compared with the limit stipulated by the
FC-XIII, while the pension-GSDP ratio has
remained higher than the FC-XIII limit during
2010-11 to 2012-13 (Table IV.21).
Table IV.21: Performance of the States vis-à-vis FC-XIII Assessment |
(Per cent of GSDP) |
Item |
2010-11 |
2011-12 |
2012-13 |
Based on |
FC-XIII
Assessment |
2010-11
(Accounts) |
FC-XIII
Assessment |
Revised
Estimates |
FC-XIII
Assessment |
Budget
Estimates |
1 |
2 |
3 |
4 |
5 |
6 |
7 |
Own Revenue Receipts (1+2) |
10.1 |
8.5 |
10.1 |
8.9 |
10.1 |
9.0 |
1. Own Tax Revenue |
8.5 |
7.1 |
8.6 |
7.4 |
8.7 |
7.6 |
2. Own Non-tax Revenue |
1.6 |
1.4 |
1.5 |
1.4 |
1.5 |
1.4 |
Revenue Expenditure |
|
|
|
|
|
|
of which: Interest Payments |
2.4 |
1.9 |
2.4 |
1.9 |
2.3 |
1.8 |
Pension |
1.5 |
1.7 |
1.5 |
1.6 |
1.5 |
1.7 |
Note: As the GSDP series were revised after the release of the FC-XIII report, the calculated ratios are based on revised GSDP (2004-05 series) while
the ratios pertaining to FC-XIII are directly taken from the FC-XIII Report. |
4.30 A comparison of states’ revenue deficit
and fiscal deficit in terms of GSDP with the targets
of FC-XIII reveals that the performance of all
states, NSC and SC states at the consolidated
level in respect of the revenue deficit-GSDP ratio
was better than the FC-XIII’s targets in 2011-12.
State-wise data shows that with the exception of
Goa, Haryana, Kerala, Maharashtra, Punjab and
West Bengal, the rest of the states performed better than their respective FC-XIII targets. The
fiscal deficit-GSDP ratio of all states and NSC
states at the consolidated level was lower than the
FC-XIII target; however, the same was higher than
the FC-XIII target for SC states at the consolidated
level. Among NSC states, the GFD-GSDP ratios
of Bihar, Goa, Jharkhand, Punjab and West
Bengal were higher than the FC-XIII target. Within
SC states, the GFD-GSDP ratio is expected to be higher than the FC-XIII target in all states, barring
Himachal Pradesh, Meghalaya, Tripura and
Uttarakhand.
4.31 The revenue account position of all states,
NSC states and SC states at the consolidated
level is budgeted to be better than the FC-XIII
target for 2012-13, while the revenue defi cit-GSDP
ratios of Goa and Haryana are higher than the FCXIII
target for the year. The GFD-GSDP ratio of all
states, NSC states and SC states at the
consolidated level is budgeted to be lower than
the FC-XIII target in 2012-13. At the state level,
GFD -GSDP ratio is expected to exceed the FCXIII
targets in 2012-13 (BE) for Goa among the
NSC states and Arunachal Pradesh and Manipur
among the SC states (Table IV.22).
Table IV.22: Deficit Indicators in Comparison with FC-XIII Targets |
(Per cent to GSDP) |
States |
Revenue Deficit |
Gross Fiscal Deficit |
2011-12 |
2012-13 |
2011-12 |
2012-13 |
FC XIII |
RE |
FC XIII |
BE |
FC XIII |
RE |
FC XIII |
BE |
1 |
2 |
3 |
4 |
5 |
6 |
7 |
8 |
9 |
I. Non-Special Category States |
|
|
|
|
|
|
|
|
Andhra Pradesh |
0.0 |
-0.1 |
0.0 |
-0.6 |
3.0 |
2.6 |
3.0 |
2.6 |
Bihar |
0.0 |
-0.3 |
0.0 |
-2.7 |
3.0 |
5.4 |
3.0 |
2.9 |
Chhattisgarh |
0.0 |
-1.6 |
0.0 |
-1.8 |
3.0 |
2.8 |
3.0 |
2.8 |
Goa |
0.0 |
0.3 |
0.0 |
0.2 |
3.0 |
4.1 |
3.0 |
3.8 |
Gujarat |
0.0 |
-0.3 |
0.0 |
-0.5 |
3.0 |
2.2 |
3.0 |
2.6 |
Haryana |
0.0 |
0.8 |
0.0 |
0.7 |
3.0 |
2.5 |
3.0 |
2.1 |
Jharkhand |
0.0 |
-0.5 |
0.0 |
-3.3 |
3.0 |
3.2 |
3.0 |
2.1 |
Karnataka |
0.0 |
-0.7 |
0.0 |
-0.2 |
3.0 |
2.9 |
3.0 |
2.9 |
Kerala |
1.4 |
1.7 |
0.9 |
0.9 |
3.5 |
3.5 |
3.5 |
2.7 |
Madhya Pradesh |
0.0 |
-2.6 |
0.0 |
-1.9 |
3.0 |
2.6 |
3.0 |
3.0 |
Maharashtra |
0.0 |
0.2 |
0.0 |
0.0 |
3.0 |
1.7 |
3.0 |
1.7 |
Odisha |
0.0 |
-1.4 |
0.0 |
-0.9 |
3.0 |
0.9 |
3.0 |
1.8 |
Punjab |
1.8 |
2.2 |
1.2 |
1.1 |
3.5 |
3.8 |
3.5 |
3.1 |
Rajasthan |
0.0 |
-0.1 |
0.0 |
-0.2 |
3.0 |
2.1 |
3.0 |
2.1 |
Tamil Nadu |
0.0 |
-0.1 |
0.0 |
-0.3 |
3.0 |
2.9 |
3.0 |
2.9 |
Uttar Pradesh |
0.0 |
-1.3 |
0.0 |
-0.8 |
3.0 |
2.9 |
3.0 |
3.0 |
West Bengal |
1.6 |
3.1 |
1.1 |
1.1 |
3.5 |
3.9 |
3.5 |
2.5 |
Total I |
0.3 |
0.1 |
0.2 |
-0.3 |
3.1 |
2.7 |
3.1 |
2.5 |
II. Special Category States |
|
|
|
|
|
|
|
|
Arunachal Pradesh |
0.0 |
-19.7 |
0.0 |
-23.1 |
3.0 |
16.9 |
3.0 |
3.2 |
Assam |
0.0 |
-0.3 |
0.0 |
-1.1 |
3.0 |
3.9 |
3.0 |
3.0 |
Himachal Pradesh |
0.0 |
-0.8 |
0.0 |
-0.6 |
3.0 |
2.9 |
3.0 |
2.9 |
Jammu and Kashmir |
0.0 |
-4.9 |
0.0 |
-7.6 |
4.7 |
6.1 |
4.2 |
2.9 |
Manipur |
0.0 |
-3.4 |
0.0 |
-14.2 |
3.5 |
15.5 |
3.5 |
4.2 |
Meghalaya |
0.0 |
-4.0 |
0.0 |
-5.5 |
3.0 |
2.6 |
3.0 |
2.1 |
Mizoram |
0.0 |
-2.8 |
0.0 |
-7.8 |
6.4 |
7.0 |
5.2 |
3.3 |
Nagaland |
0.0 |
-6.0 |
0.0 |
-9.9 |
3.5 |
5.8 |
3.5 |
3.5 |
Sikkim |
0.0 |
-13.2 |
0.0 |
-17.5 |
3.5 |
4.8 |
3.5 |
3.5 |
Tripura |
0.0 |
-7.0 |
0.0 |
-5.7 |
3.0 |
2.0 |
3.0 |
2.6 |
Uttarakhand |
0.0 |
-0.3 |
0.0 |
-0.4 |
3.5 |
3.1 |
3.5 |
3.4 |
Total II |
0.0 |
-2.5 |
0.0 |
-3.7 |
3.4 |
4.5 |
3.3 |
3.1 |
Total (I+II) 28 States |
0.2 |
-0.1 |
0.2 |
-0.5 |
3.1 |
2.8 |
3.1 |
2.5 |
RE : Revised Estimates. BE : Budget Estimates.
Note: 1. Negative sign (-) indicates surplus
2. As the GSDP series were revised after the release of the FC-XIII report, the calculated ratios are based on revised GSDP (2004-05 series)
while the ratios pertaining to FC-XIII are directly taken from the FC-XIII Report. |
Conclusion
4.32 Key deficit-GDP ratios recorded
improvement in 2010-11 (Accounts) over the
previous year, as well as over the revised estimates
for the year. Fiscal imbalances in terms of GFDGDP
and PD-GDP ratios at the consolidated level, however, widened during 2011-12 (RE), even
though these were due to an increase in capital
outlay during the year. State-wise data, however,
shows improvement in the revenue account of the
majority of the states in 2011-12(RE). Most of the
states witnessed higher receipts from central
transfers and own tax revenues in 2011-12 (RE).
Within own tax revenues, taxes on petroleum
products, which account for around one-third of
the total revenue from VAT, increased in 15 states
during 2011-12 (RE). The overall fiscal performance
of states at the consolidated level is expected to
improve during 2012-13 as refl ected in the
increase in revenue surplus and reduction in GFD
and PD as ratios to GSDP. The increase in revenue
surplus, generated primarily through increase in
revenue receipts, is expected to provide more
resources for capital investment.
4.33 The performance of the states vis-à-vis the
FC-XIII’s deficit targets indicates that the states at
the consolidated level were able to better the FCXIII’s
targets for revenue account in 2011-12(RE)
and 2012-13 (BE).
|