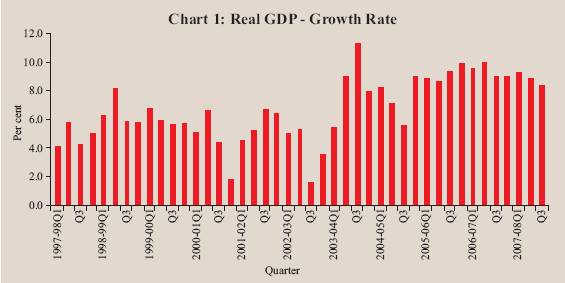
During 2007-08, the Indian economy continued to expand at a robust pace for the fifth consecutive year, although there was some moderation in the growth momentum during the course of the year (Table 1 and Chart 1). According to the advance estimates released by Central Statistical Organisation (CSO), the real GDP growth rate moderated to 8.7 per cent in 2007-08 from 9.6 per cent in 2006-07. The moderation in growth occurred in all the three sectors, viz., agriculture and allied activities, industry and services. Notwithstanding the moderation, the growth performance was in tune with the high average real GDP growth of 8.7 per cent per annum during the five-year period, 2003-04 to 2007-08. India also continued to be one of the fastest growing economies of the world.
Table 1: Growth Rates of Real GDP |
(Per cent) |
|
2000-01 to |
2005-06 |
2006-07* |
2007-08# |
2006-07 |
2007-08 |
2006-07 |
2007-08 |
Sector |
2007-08
(Average) |
|
|
|
Q1 |
Q2 |
Q3 |
Q1 |
Q2 |
Q3 |
April-December |
1 |
2 |
3 |
4 |
5 |
6 |
7 |
8 |
9 |
10 |
11 |
12 |
13 |
1. Agriculture and |
2.6 |
5.9 |
3.8 |
2.6 |
3.3 |
3.6 |
3.4 |
3.8 |
3.7 |
3.2 |
3.4 |
3.5 |
Allied Activities |
(20.8) |
(19.6) |
(18.5) |
(17.5) |
|
|
|
|
|
|
|
|
2. Industry |
7.2 |
8.0 |
10.6 |
8.6 |
10.0 |
10.7 |
10.3 |
10.6 |
8.3 |
8.4 |
10.3 |
9.1 |
|
|
(19.6) |
(19.4) |
(19.5) |
(19.5) |
|
|
|
|
|
|
|
|
2.1 |
Mining and Quarrying |
4.8 |
4.9 |
5.7 |
3.4 |
4.2 |
4.1 |
6.1 |
3.2 |
7.7 |
4.9 |
4.8 |
5.2 |
2.2 |
Manufacturing |
7.9 |
9.0 |
12.0 |
9.4 |
11.7 |
12.2 |
11.3 |
11.9 |
8.6 |
9.3 |
11.7 |
9.9 |
2.3 |
Electricity, Gas and |
|
|
|
|
|
|
|
|
|
|
|
|
|
Water Supply |
5.0 |
4.7 |
6.0 |
7.8 |
4.3 |
6.6 |
7.6 |
8.3 |
7.3 |
5.3 |
6.2 |
6.9 |
|
|
|
|
|
|
|
|
|
|
|
|
|
|
3. Services |
8.9 |
11.0 |
11.2 |
10.6 |
11.6 |
11.5 |
11.1 |
10.6 |
10.4 |
10.3 |
11.4 |
10.4 |
|
|
(59.6) |
(61.1) |
(61.9) |
(63.0) |
|
|
|
|
|
|
|
|
3.1 |
Trade, Hotels, |
|
|
|
|
|
|
|
|
|
|
|
|
|
Restaurants, Transport, |
|
|
|
|
|
|
|
|
|
|
|
|
|
Storage and |
|
|
|
|
|
|
|
|
|
|
|
|
|
Communication |
10.3 |
11.5 |
11.8 |
12.1 |
10.8 |
12.5 |
12.0 |
11.9 |
11.4 |
11.3 |
11.8 |
11.6 |
3.2 |
Financing, Insurance, |
|
|
|
|
|
|
|
|
|
|
|
|
|
Real Estate and |
|
|
|
|
|
|
|
|
|
|
|
|
|
Business Services |
8.8 |
11.4 |
13.9 |
11.7 |
13.6 |
13.9 |
14.7 |
11.1 |
10.7 |
11.6 |
14.1 |
11.1 |
3.3 Community, Social and |
|
|
|
|
|
|
|
|
|
|
|
|
|
Personal services |
5.8 |
7.2 |
6.9 |
7.0 |
10.3 |
7.2 |
5.6 |
7.6 |
7.7 |
7.6 |
7.6 |
7.7 |
3.4 Construction |
10.5 |
16.5 |
12.0 |
9.6 |
13.1 |
12.0 |
10.8 |
10.7 |
11.1 |
8.4 |
11.9 |
10.0 |
4. Real GDP at Factor Cost |
7.2 |
9.4 |
9.6 |
8.7 |
9.6 |
10.1 |
9.1 |
9.3 |
8.9 |
8.4 |
9.6 |
8.9 |
Memo: |
|
|
|
|
|
|
|
|
|
(Amount in Rupees crore) |
a) Real GDP at factor cost |
26,12,847 |
28,64,310 |
31,14,452 |
|
|
|
|
|
|
|
|
b) GDP at current market prices |
35,80,344 |
41,45,810 |
46,93,602 |
|
|
|
|
|
|
|
|
*: Quick Estimates #: Advance Estimates
Note: Figures in parentheses denote shares in real GDP and may not add up to 100 due to rounding off.
Source : Central Statistical Organisation. |
Agricultural Situation
The cumulative rainfall during the 2007 South-West monsoon season (June 1 to September 30) was 5 per cent above normal of the long-period average (LPA) as against 1 per cent below normal a year ago. Barring short spells of rainfall deficiency during the first week of June, third and fourth weeks of July, and third week of August, the seasonal rainfall was well-distributed over time. At the end of the season water stock in the 81 major reservoirs was 79 per cent of the full reservoir level (FRL), lower than 87 per cent during the corresponding period of the previous year but higher than the average of 67 per cent during the last 10 years. Cumulative rainfall during the North-East monsoon (October 1, 2007 to December 31, 2007) was, however, 32 per cent below normal as compared with 21 per cent below normal during the corresponding period of the previous year. Of the 36 meteorological sub-divisions, cumulative rainfall was deficient/scanty/no rain in 27 sub-divisions (same as last year) (Table 2). As on April 10, 2008, the total live water storage was 31 per cent (33 per cent last year) of the FRL.
According to the India Meteorological Department (IMD) forecast released in April 2008, the rainfall during the South-West monsoon season (June-September) 2008 for the country as whole is likely to be 99 per cent of the LPA or near normal with a model error of +/- 5 per cent. This is well above the forecast of 95 per cent during the corresponding period of the previous year.
The sowing of kharif crops improved during 2007-08 on account of satisfactory rainfall during the South-West monsoon and remunerative market prices. The reported sown area was about 2.8 per cent higher than the previous year. In contrast, area sown under rabi crops so far (as reported on April 4, 2008) has been 2.9 per cent lower than a year ago on account of the deficiency in rainfall. The lower sowing under rabi was observed across all the major crops except rice and groundnut (Table 3).
Table 2: Cumulative Rainfall |
(Number of Meteorological Divisions) |
Year |
South-West Monsoon |
North-East Monsoon |
|
Cumulative |
Spatial Distribution |
Cumulative |
Spatial Distribution |
|
Rainfall: |
Excess |
Normal |
Deficient |
Scanty/ |
Rainfall: |
Excess |
Normal |
Deficient |
Scanty/ |
|
Above(+)/
Below (-)
Normal
(per cent) |
Rainfall |
Rainfall |
Rainfall |
No Rain |
Above(+)/
Below (-)
Normal
(per cent) |
Rainfall |
Rainfall |
Rainfall |
No Rain |
1 |
2 |
3 |
4 |
5 |
6 |
7 |
8 |
9 |
10 |
11 |
1998 |
6 |
12 |
21 |
3 |
0 |
- |
28 |
6 |
1 |
1 |
1999 |
-4 |
3 |
26 |
7 |
0 |
- |
20 |
7 |
6 |
3 |
2000 |
-8 |
5 |
23 |
8 |
0 |
- |
0 |
4 |
13 |
19 |
2001 |
-8 |
1 |
30 |
5 |
0 |
- |
14 |
10 |
9 |
3 |
2002 |
-19 |
1 |
14 |
19 |
2 |
-33 |
3 |
7 |
12 |
14 |
2003 |
2 |
7 |
26 |
3 |
0 |
9 |
9 |
9 |
6 |
12 |
2004 |
-13 |
0 |
23 |
13 |
0 |
-11 |
8 |
10 |
17 |
1 |
2005 |
-1 |
9 |
23 |
4 |
0 |
10 |
11 |
6 |
5 |
14 |
2006 |
-1 |
6 |
20 |
10 |
0 |
-21 |
3 |
6 |
14 |
13 |
2007 |
5 |
13 |
17 |
6 |
0 |
-32 |
2 |
7 |
9 |
18 |
Excess :+20 per cent or more. Normal : +19 per cent to - 19 per cent. Deficient :- 20 per cent to -59 per cent.
Scanty : - 60 per cent to -99 per cent. No Rain:-100 per cent.
Source : India Meteorological Department. |
Table 3: Progress of Area under Crops - 2007-08 |
(Million hectares) |
|
Area Coverage
(As on October
26, 2008) |
Crop |
Normal
Area |
Area Coverage
(As reported on
April 4, 2008) |
Crop |
Normal Area |
2006 |
2007 |
Variation |
|
|
2007 |
2008 |
Variation |
1 |
2 |
3 |
4 |
5 |
1 |
2 |
3 |
4 |
5 |
|
Kharif |
Crops |
|
|
|
Rabi |
Crops |
|
|
Rice |
38.2 |
37.1 |
37.3 |
0.2 |
Rice |
3.7 |
4.1 |
4.3 |
0.2 |
Coarse Cereals |
22.9 |
22.1 |
22.0 |
-0.1 |
Wheat |
26.2 |
28.2 |
27.7 |
-0.5 |
of which: |
|
|
|
|
Coarse Cereals |
6.4 |
7.1 |
6.8 |
-0.2 |
Bajra |
9.4 |
9.3 |
8.7 |
-0.6 |
|
|
|
|
|
|
|
|
|
|
of which: |
|
|
|
|
Jowar |
4.4 |
3.8 |
3.6 |
-0.2 |
|
|
|
|
|
|
|
|
|
|
Jowar |
5.0 |
4.9 |
4.7 |
-0.3 |
Maize |
6.2 |
6.8 |
7.5 |
0.6 |
|
|
|
|
|
|
|
|
|
|
Maize |
0.7 |
1.0 |
1.1 |
0.0 |
Total Pulses |
10.9 |
11.4 |
12.6 |
1.2 |
|
|
|
|
|
|
|
|
|
|
Total Pulses |
11.4 |
14.2 |
13.5 |
-0.7 |
Total Oilseeds |
15.4 |
16.8 |
17.7 |
0.9 |
|
|
|
|
|
|
|
|
|
|
Total Oilseeds |
8.8 |
10.2 |
9.6 |
-0.6 |
of which: |
|
|
|
|
|
|
|
|
|
|
|
|
|
|
of which: |
|
|
|
|
Groundnut |
5.5 |
4.8 |
5.4 |
0.6 |
|
|
|
|
|
Soyabean |
6.6 |
8.1 |
8.8 |
0.6 |
Groundnut |
0.8 |
1.1 |
1.3 |
0.2 |
Sugarcane |
4.2 |
4.8 |
5.1 |
0.3 |
Rapeseed/Mustard |
5.9 |
6.6 |
6.0 |
-0.6 |
Cotton |
8.3 |
9.0 |
9.3 |
0.4 |
Sunflower |
1.2 |
1.3 |
1.1 |
-0.1 |
All Crops |
100.8 |
102.1 |
104.9 |
2.8 |
All Crops |
56.5 |
63.8 |
61.9 |
-1.8 |
Source : Ministry of Agriculture, Government of India. |
According to the Third Advance Estimates for 2007-08, the total foodgrains production is slated to reach an all-time high at 227.3 million tonnes, surpassing the target set earlier (221.5 million tonnes) and recording an increase of 4.6 per cent over the previous year (217.3 million tonnes) (Table 4). The enhanced foodgrains production reflects the expected increase across all major crops. Amongst non-foodgrains, while the production of cotton and oilseeds are expected to increase over the previous year, that of sugarcane is likely to show a decline.
Food Management
Total procurement of rice and wheat during 2007-08 aggregated to 37.5 million tonnes, which was 4.5 per cent higher than that procured during the corresponding period of the previous year, mainly on account of increase in wheat procurement. Total offtake of rice and wheat during 2007-08 (up to December 31, 2007) at 27.3 million tonnes was almost of the same order as that during the corresponding period of the previous year. As on February 1, 2008, total stocks of foodgrains with the Food Corporation of India (FCI) and other Government agencies were at 21.4 million tonnes - higher by 18.4 per cent than that a year ago (18.1 million tonnes). While the stock of rice (14.0 million tonnes) was 11.1 per cent higher than that of last year (12.6 million tonnes), the stock of wheat (7.2 million tonnes) was 33.0 per cent higher than that of the previous year (5.4 million tonnes) (Table 5).
Table 4: Agricultural Production |
(Million tonnes) |
Crop |
2003-04 |
2004-05 |
2005-06 |
2006-07 |
2007-08 |
|
|
|
|
|
Target |
Achievement @ |
1 |
2 |
3 |
4 |
5 |
6 |
7 |
Rice |
88.5 |
83.1 |
91.8 |
93.4 |
93.0 |
95.7 |
|
Kharif |
78.6 |
72.2 |
78.3 |
80.2 |
80.0 |
82.8 |
|
Rabi |
9.9 |
10.9 |
13.5 |
13.2 |
13.0 |
12.9 |
Wheat |
72.2 |
68.6 |
69.4 |
75.8 |
75.5 |
76.8 |
Coarse Cereals |
37.6 |
33.5 |
34.1 |
33.9 |
37.5 |
39.7 |
|
Kharif |
32.2 |
26.4 |
26.7 |
25.6 |
28.7 |
30.9 |
|
Rabi |
5.4 |
7.1 |
7.3 |
8.3 |
8.8 |
8.8 |
Pulses |
14.9 |
13.1 |
13.4 |
14.2 |
15.5 |
15.2 |
|
Kharif |
6.2 |
4.7 |
4.9 |
4.8 |
5.5 |
6.4 |
|
Rabi |
8.7 |
8.4 |
8.5 |
9.4 |
10.0 |
8.8 |
Total Foodgrains |
213.2 |
198.4 |
208.6 |
217.3 |
221.5 |
227.3 |
|
Kharif |
117.0 |
103.3 |
109.9 |
110.6 |
114.2 |
120.0 |
|
Rabi |
96.2 |
95.1 |
98.7 |
106.7 |
107.3 |
107.3 |
Total Oilseeds |
25.2 |
24.4 |
28.0 |
24.3 |
30.0 |
28.2 |
|
Kharif |
16.7 |
14.1 |
16.8 |
14.0 |
18.5 |
19.0 |
|
Rabi |
8.5 |
10.2 |
11.2 |
10.3 |
11.5 |
9.2 |
Sugarcane |
233.9 |
237.1 |
281.2 |
355.5 |
310.0 |
344.2 |
Cotton # |
13.7 |
16.4 |
18.5 |
22.6 |
22.0 |
23.2 |
Jute and Mesta ## |
11.2 |
10.3 |
10.8 |
11.3 |
11.0 |
11.5 |
@ : Third Advance Estimates as on April 22, 2008. ## : Million bales of 180 kgs each.
# : Million bales of 170 kgs each.
Source : Ministry of Agriculture, Government of India. |
Table 5: Management of Food Stocks |
(Million tonnes) |
|
Opening Stock of |
Procurement of |
|
|
|
Month |
Foodgrains |
Foodgrains |
Foodgrains Off-take |
Closing |
Norms |
|
Rice |
Wheat |
Total |
Rice |
Wheat |
Total |
PDS |
OWS |
OMS - Domestic |
Exports |
Total |
Stock |
|
1 |
2 |
3 |
4 |
5 |
6 |
7 |
8 |
9 |
10 |
11 |
12 |
13 |
14 |
2004-05 |
13.1 |
6.9 |
20.6 |
24.0 |
16.8 |
40.8 |
29.7 |
10.6 |
0.2 |
1.0 |
41.5 |
18.0 |
|
2005-06 |
13.3 |
4.1 |
18.0 |
26.6 |
14.8 |
41.4 |
31.4 |
9.8 |
1.1 |
0.0 |
42.3 |
16.6 |
|
2006-07 |
13.7 |
2.0 |
16.6 |
26.7 |
9.2 |
35.9 |
31.6 |
5.1 |
0.0 |
0.0 |
36.8 |
17.9 |
|
2006-07 # |
13.7 |
2.0 |
16.6 |
26.7 |
9.2 |
35.9 |
23.6 |
3.8 |
0.0 |
0.0 |
27.3 |
18.1 |
|
2007-08 # |
13.2 |
4.7 |
17.9 |
26.4 |
11.1 |
37.5 |
24.7 |
2.6 |
0.0 |
0.0 |
27.3 |
21.4 |
|
2006 |
|
|
|
|
|
|
|
|
|
|
|
|
|
April |
13.7 |
2.0 |
16.6 |
1.7 |
8.7 |
10.3 |
2.5 |
0.3 |
0.0 |
0.0 |
2.7 |
22.8 |
16.2 |
May |
12.8 |
9.0 |
22.8 |
1.6 |
0.6 |
2.2 |
2.9 |
0.4 |
0.0 |
0.0 |
3.2 |
22.3 |
|
June |
12.0 |
9.3 |
22.3 |
1.5 |
0.0 |
1.5 |
2.6 |
0.6 |
0.0 |
0.0 |
3.0 |
20.5 |
|
July |
11.1 |
8.2 |
20.5 |
0.8 |
0.0 |
0.8 |
2.7 |
0.4 |
0.0 |
0.0 |
3.0 |
17.1 |
26.9 |
August |
9.5 |
7.3 |
17.1 |
0.5 |
0.0 |
0.5 |
2.7 |
0.4 |
0.0 |
0.0 |
3.0 |
15.5 |
|
September |
7.8 |
6.7 |
15.5 |
0.2 |
0.0 |
0.2 |
2.6 |
0.5 |
0.0 |
0.0 |
3.0 |
12.6 |
|
October |
6.0 |
6.4 |
12.6 |
8.0 |
0.0 |
8.0 |
2.5 |
0.3 |
0.0 |
0.0 |
2.8 |
18.6 |
16.2 |
November |
12.5 |
6.0 |
18.7 |
2.0 |
0.0 |
2.0 |
2.5 |
0.4 |
0.0 |
0.0 |
2.9 |
17.8 |
|
December |
12.1 |
5.6 |
17.8 |
2.6 |
0.0 |
2.6 |
2.6 |
0.3 |
0.0 |
0.0 |
3.0 |
17.5 |
|
2007 |
|
|
|
|
|
|
|
|
|
|
|
|
|
January |
12.0 |
5.4 |
17.5 |
4.3 |
0.0 |
4.3 |
2.7 |
0.4 |
0.0 |
0.0 |
3.1 |
18.1 |
20.0 |
February |
12.6 |
5.4 |
18.1 |
2.4 |
0.0 |
2.4 |
2.7 |
0.5 |
0.0 |
0.0 |
3.1 |
19.1 |
|
March |
14.0 |
5.1 |
19.1 |
1.2 |
0.0 |
1.2 |
2.7 |
0.5 |
0.0 |
0.0 |
3.2 |
17.9 |
|
April |
13.2 |
4.7 |
17.9 |
0.9 |
7.9 |
8.7 |
2.6 |
0.2 |
0.0 |
0.0 |
2.8 |
25.1 |
16.2 |
May |
13.5 |
11.6 |
25.1 |
1.5 |
2.6 |
4.0 |
2.8 |
0.2 |
0.0 |
0.0 |
3.0 |
25.9 |
|
June |
12.6 |
13.3 |
25.9 |
1.3 |
0.7 |
2.0 |
2.7 |
0.4 |
0.0 |
0.0 |
3.0 |
23.9 |
|
July |
11.0 |
12.9 |
23.9 |
0.8 |
0.0 |
0.8 |
2.9 |
0.4 |
0.0 |
0.0 |
3.2 |
21.2 |
26.9 |
August |
9.2 |
12.0 |
21.2 |
0.1 |
0.0 |
0.1 |
2.8 |
0.3 |
0.0 |
0.0 |
3.0 |
17.9 |
|
September |
6.9 |
11.0 |
18.0 |
0.1 |
0.0 |
0.1 |
2.7 |
0.3 |
0.0 |
0.0 |
2.9 |
15.6 |
|
October |
5.5 |
10.1 |
15.6 |
7.4 |
0.0 |
7.4 |
2.7 |
0.3 |
0.0 |
0.0 |
2.9 |
19.7 |
16.2 |
November |
10.7 |
9.0 |
19.7 |
1.8 |
0.0 |
1.8 |
2.7 |
0.3 |
0.0 |
0.0 |
2.9 |
18.5 |
|
December |
10.1 |
8.4 |
18.5 |
3.6 |
0.0 |
3.6 |
2.7 |
0.3 |
0.0 |
0.0 |
3.0 |
19.2 |
|
2008 |
|
|
|
|
|
|
|
|
|
|
|
|
|
January |
11.5 |
7.7 |
19.2 |
4.5 |
0.0 |
4.5 |
_ |
_ |
_ |
_ |
_ |
21.4 |
20.0 |
February |
14.0 |
7.2 |
21.4 |
3.0 |
0.0 |
3.0 |
_ |
_ |
_ |
_ |
_ |
_ |
|
March |
_ |
_ |
_ |
1.6 |
0.0 |
1.6 |
_ |
_ |
_ |
_ |
_ |
_ |
|
PDS: Public Distribution System. OWS: Other Welfare Schemes. OMS : Open Market Sales. _ : Not Available.
# : Off-take up to December 31 and stock as at end-January.
Note :
Closing stock figures may differ from those arrived at by adding the opening stocks and procurement and deducting off-take, as stocks include coarse grains also.
Source : Ministry of Consumer Affairs, Food and Public Distribution, Government of India. |
Table 6: Index of Industrial Production: Sectoral and |
Use-Based Classification of Industries |
(Per cent) |
Industry Group |
Weight
in IIP |
Growth |
Weighted Contribution# |
|
|
2006-07 |
2006-07 |
2007-08 P |
2006-07 |
2006-07 |
2007-08 P |
|
April-March |
April-February |
April-March |
April-February |
1 |
2 |
3 |
4 |
5 |
6 |
7 |
8 |
Sectoral |
|
|
|
|
|
|
|
Mining |
10.5 |
5.3 |
5.0 |
5.1 |
3.4 |
3.3 |
4.0 |
Manufacturing |
79.4 |
12.5 |
12.2 |
9.1 |
91.1 |
91.1 |
89.5 |
Electricity |
10.2 |
7.3 |
7.2 |
6.6 |
5.5 |
5.7 |
6.5 |
Use-Based |
|
|
|
|
|
|
|
Basic Goods |
35.6 |
10.3 |
10.1 |
7.4 |
27.2 |
27.6 |
25.6 |
Capital Goods |
9.3 |
18.2 |
18.3 |
17.5 |
17.6 |
17.6 |
23.2 |
Intermediate Goods |
26.5 |
12.0 |
11.7 |
9.2 |
27.0 |
27.3 |
27.9 |
Consumer Goods (a+b) |
28.7 |
10.1 |
9.5 |
6.3 |
28.5 |
27.8 |
23.3 |
a) Consumer Durables |
5.4 |
9.2 |
9.7 |
-1.0 |
6.7 |
7.4 |
-1.0 |
b) Consumer Non-durables |
23.3 |
10.4 |
9.5 |
8.9 |
21.8 |
20.4 |
24.3 |
General |
100.0 |
11.5 |
11.2 |
8.7 |
100.0 |
100.0 |
100.0 |
P : Provisional.
# : Figures may not add up to 100 due to rounding off.
Source: Central Statistical Organisation. |
Industrial Performance
Industrial growth moderated during April-February 2007-08 primarily reflecting the performance of manufacturing sector (Table 6 and Chart 2). Growth in index of industrial production (IIP) decelerated to 8.7 per cent during April-February 2007-08 from 11.2 per cent during April-February 2006-07 with the manufacturing sector growth moderating to 9.1 per cent from 12.2 per cent. While the growth in the electricity sector decelerated to 6.6 per cent during April-February 2007-08 from 7.2 per cent a year ago, that of the mining sector increased marginally to 5.1 per cent from 5.0 per cent over the same period.
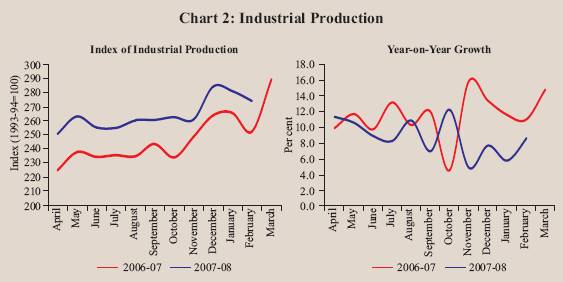
The moderation in the manufacturing sector reflected decelerated/negative growth in eleven out of seventeen manufacturing industry groups accounting for 49.3 per cent weight in the IIP (Table 7).
Table 7: Performance of Manufacturing Groups |
(Per cent) |
Industry Group |
Weight
in IIP |
Growth Rate |
Weighted
Contribution # |
|
|
2006-07 |
2006-07 |
2007-08 P |
2006-07 |
2006-07 |
2007-08 P |
|
|
April-March |
April-February |
April-March |
April-February |
1 |
2 |
3 |
4 |
5 |
6 |
7 |
8 |
1. |
Wood and wood products, |
|
|
|
|
|
|
|
|
furniture and fixtures |
2.7 |
29.1 |
21.6 |
45.8 |
2.4 |
1.9 |
5.6 |
2. |
Jute and other vegetable |
|
|
|
|
|
|
|
|
fibre textiles (except cotton) |
0.6 |
-15.8 |
-13.5 |
30.8 |
-0.4 |
-0.4 |
0.9 |
3. |
Other manufacturing industries |
2.6 |
7.7 |
10.4 |
18.7 |
2.4 |
3.2 |
7.5 |
4. |
Basic metal and alloy industries |
7.5 |
22.8 |
22.8 |
12.9 |
16.6 |
17.0 |
14.0 |
5. |
Beverages, tobacco and related |
|
|
|
|
|
|
|
|
products |
2.4 |
11.1 |
11.8 |
11.8 |
4.5 |
5.0 |
6.6 |
6. |
Leather and leather and fur products |
1.1 |
0.6 |
1.4 |
11.8 |
0.0 |
0.1 |
1.1 |
7. |
Chemicals and chemical products |
|
|
|
|
|
|
|
|
except products of petroleum and coal |
14.0 |
9.6 |
9.0 |
11.3 |
15.0 |
14.7 |
23.6 |
8. |
Machinery and equipment |
|
|
|
|
|
|
|
|
other than transport equipment |
9.6 |
14.2 |
14.2 |
9.5 |
18.2 |
18.6 |
16.8 |
9. |
Rubber, plastic, petroleum |
|
|
|
|
|
|
|
|
and coal products |
5.7 |
12.9 |
12.4 |
9.4 |
6.4 |
6.3 |
6.4 |
10. |
Food products |
9.1 |
8.5 |
6.3 |
6.7 |
5.7 |
4.3 |
5.7 |
11. |
Non-metallic mineral products |
4.4 |
12.8 |
13.1 |
6.3 |
6.6 |
6.9 |
4.4 |
12. |
Cotton textiles |
5.5 |
14.8 |
14.3 |
4.5 |
4.8 |
4.8 |
2.1 |
13. |
Textile products |
|
|
|
|
|
|
|
|
(including wearing apparel) |
2.5 |
11.5 |
11.2 |
4.0 |
3.2 |
3.2 |
1.5 |
14. |
Wool, silk and man-made |
|
|
|
|
|
|
|
|
fibre textiles |
2.3 |
7.8 |
7.4 |
3.5 |
1.9 |
1.9 |
1.1 |
15. |
Transport equipment and parts |
4.0 |
15.0 |
15.2 |
3.3 |
8.2 |
8.5 |
2.5 |
16. |
Paper and paper products |
|
|
|
|
|
|
|
|
and printing, publishing and |
|
|
|
|
|
|
|
|
allied activities |
2.7 |
8.7 |
8.6 |
2.5 |
2.3 |
2.3 |
0.9 |
17. |
Metal products and parts |
|
|
|
|
|
|
|
|
(except machinery and equipment) |
2.8 |
11.4 |
7.7 |
-3.1 |
2.3 |
1.6 |
-0.8 |
|
Manufacturing - Total |
79.4 |
12.5 |
12.2 |
9.1 |
100.0 |
100.0 |
100.0 |
P : Provisional. # : Figures may not add up to 100 due to rounding off.
Source: Central Statistical Organisation. |
‘Machinery and equipment’, ‘basic metal and alloy industries’, ‘non-metallic mineral products’, ‘cotton textiles’, ‘textile products’ and ‘transport equipment and parts’ were amongst the major groups which registered deceleration in growth largely due to base effect. ‘Metal products and parts’ recorded negative growth due to decline in the production of tin metal containers, welded link chains and razor blades. ‘Chemicals and chemical products except products of petroleum and coal’ with the highest weight in the IIP, however, registered a double-digit growth mainly due to strong growth in filament yarn, viscose staple fibre, hair oil and clinical drugs. ‘Jute and other vegetable fibre textiles’ registered a turnaround with a positive growth during the period.
In terms of use-based classification, the capital goods sector recorded double-digit growth during April-February 2007-08 (see Table 6). The continued capacity addition by manufacturing firms helped the robust growth of capital goods. The growth in the intermediate goods sector decelerated on account of slowdown in production of newsprint bleached, cotton yarn, polished granite/ stone chips, and ball and roller bearings. The growth in consumer goods sector decelerated to 6.3 per cent during April-February 2007-08 from 9.5 per cent during April-February 2006-07 largely due to negative growth in the consumer durables segment, particularly in telephone instruments, motor cycles and wrist watches. The basic goods sector growth decelerated to 7.4 per cent during April-February 2007-08 from 10.1 per cent during April-February 2006-07 due to decline in production in respect of soda ash, fertilisers, carbon steel and steel castings.
Infrastructure
During April-February 2007-08, growth of the infrastructure sector decelerated to 5.6 per cent from 8.7 per cent during the corresponding period of the previous year, reflecting deceleration in all the sectors, except coal (Chart 3). The deceleration in the electricity sector was mainly on account of moderation
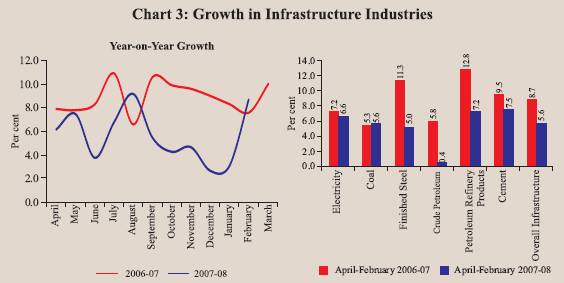
in thermal power generation and decline in nuclear power generation. High base as well as decline in refinery output in certain public sector refineries contributed to decelerated growth in petroleum refinery products. The slowdown in the cement sector was mainly on account of high base and capacity constraints. The sharp deceleration in crude oil production was attributable to the decline in production in Oil India Limited (OIL) and Oil and Natural Gas Corporation (ONGC) plants by 1.3 per cent and 0.2 per cent, respectively, during April-February 2007-08. In six out of eleven months of 2007-08, the crude oil sector recorded decline in production, which led to decelerated growth at 0.4 per cent for April-February 2007-08. The coal sector recorded a growth of 5.6 per cent during April-February 2007-08 as compared with 5.3 per cent during the corresponding period of last year. High base as also capacity constraints faced by major steel producers led to decelerated growth in the steel sector during the same period.
Services Sector
The services sector maintained its double-digit growth at 10.6 per cent during 2007-08 despite some moderation in pace. It continued to be the major contributor to GDP growth. During April-December 2007, the services sector recorded a growth of 10.4 per cent, somewhat lower than 11.4 per cent during April-December 2006 (see Table 1). The growth in services sector continued to be broad based. ‘Trade, hotels, transport and communication’, ‘financing, insurance, real estate and business services’ and ‘construction’ sub-sectors registered lower but double digit growth rates, while ‘community, social and personnel services’ recorded a higher but single digit growth during April-December 2007 than during April-December 2006. The sub-sector ‘trade, hotel, transport and communication’ contributed almost one third (34.5 per cent) to overall real GDP growth during April-December 2007 (Table 8).
Leading indicators of service sector activity for April-February 2007-08 show that the growth rates in tourist arrivals, revenue earning freight traffic of the railways, commercial vehicles production, new cell phone connections, passengers handled by civil aviation at domestic terminals, cement and steel moderated over the previous year (Table 9).
Aggregate Demand
The growth of the Indian economy during 2007-08 was driven by investment demand. The estimated share of gross fixed capital formation (GFCF) in real GDP increased to 32.6 per cent in 2007-08 from 30.6 per cent in 2006-07, while that of private final consumption expenditure (PFCE) declined to 67.1 per cent from 68.4 per cent over the same period (Table 10).
Table 8 : Growth in Services Sectors |
(Contribution to real GDP growth; percentage points) |
Year/Quarter |
Construction |
Trade, Hotels,
Transport and Communication |
Financing, Insurance,
Real Estate and Business Services |
Community, Social
and Personal Services |
Total Services |
1 |
2 |
3 |
4 |
5 |
6 |
2000-01 |
0.4 |
1.6 |
0.5 |
0.7 |
3.2 |
2001-02 |
0.2 |
2.0 |
0.9 |
0.6 |
3.8 |
2002-03 |
0.5 |
2.2 |
1.1 |
0.6 |
4.3 |
2003-04 |
0.7 |
2.9 |
0.8 |
0.8 |
5.2 |
2004-05 |
1.0 |
2.7 |
1.2 |
1.0 |
5.8 |
2005-06 |
1.1 |
3.0 |
1.5 |
1.0 |
6.6 |
2006-07 |
0.8 |
3.1 |
1.9 |
1.0 |
6.8 |
2007-08 |
0.7 |
3.2 |
1.7 |
0.9 |
6.6 |
2006-07 : Q1 |
0.9 |
2.8 |
1.9 |
1.4 |
7.0 |
: Q2 |
0.9 |
3.3 |
2.0 |
1.1 |
7.3 |
: Q3 |
0.7 |
3.1 |
1.9 |
0.7 |
6.5 |
: Q4 |
0.8 |
3.4 |
1.3 |
0.8 |
6.2 |
2007-08 : Q1 |
0.8 |
3.1 |
1.6 |
1.0 |
6.5 |
: Q2 |
0.8 |
3.1 |
1.6 |
1.1 |
6.7 |
: Q3 |
0.6 |
3.0 |
1.6 |
1.0 |
6.1 |
Table 9: Indicators of Service Sector Activity |
(Growth rates in per cent) |
Sub-sector |
2005-06 |
2006-07 |
2006-07 |
2007-08 |
|
|
|
April-February |
1 |
2 |
3 |
4 |
5 |
Tourist arrivals |
12.4 |
13.6 |
13.0 * |
11.3 * |
Commercial vehicles production # |
10.6 |
33.0 |
34.3 |
4.5 |
Railway revenue earning freight traffic |
10.7 |
9.2 |
9.1 |
9.0 |
New cell phone connections |
89.4 |
85.4 |
90.3 |
40.0 |
Cargo handled at major ports |
10.4 |
9.5 |
9.4 |
12.2 |
Civil aviation |
|
|
|
|
a) Export cargo handled |
7.3 |
3.6 |
3.4 |
8.0 |
b) Import cargo handled |
15.8 |
19.4 |
19.5 |
20.9 |
c) Passengers handled at international terminals |
12.8 |
12.1 |
12.0 |
12.0 |
d) Passengers handled at domestic terminals |
27.1 |
34.0 |
35.3 |
21.6 |
Cement ** |
12.4 |
9.1 |
9.5 |
7.5 |
Steel ** |
10.8 |
11.7 |
11.3 |
5.0 |
Aggregate deposits of SCBs |
18.1 |
23.8 |
23.8 * |
22.2 * |
Non-food credit of SCBs |
31.8 |
28.5 |
28.5 * |
22.3 * |
* : April-March # : Leading Indicator for transportation.
** : Leading indicators for construction.
SCBs: Scheduled Commercial Banks
Source : Ministry of Tourism; Ministry of Commerce and Industry; Ministry of Statistics and Programme Implementation; Reserve Bank of India; and Centre for Monitoring Indian Economy. |
Table 10 : Disposition of GDP at Market Prices (at 1999-2000 Prices) |
(Rates as per cent of GDP) |
Item |
2006-07* |
2007-08# |
2006-07 |
2007-08 |
2006-07 |
2007-08 |
|
|
|
Q1 |
Q2 |
Q3 |
Q1 |
Q2 |
Q3 |
April-December |
1 |
2 |
3 |
4 |
5 |
6 |
7 |
8 |
9 |
10 |
11 |
1. |
Total Final Consumption Expenditure |
68.4 |
67.1 |
72.1 |
68.9 |
69.5 |
70.2 |
67.5 |
68.4 |
70.1 |
68.7 |
|
(i) Private Final Consumption Expenditure |
58.6 |
57.6 |
60.6 |
60.3 |
60.6 |
59.7 |
58.6 |
59.8 |
60.5 |
59.4 |
|
(ii) Government Final |
|
|
|
|
|
|
|
|
|
|
|
Consumption Expenditure |
9.8 |
9.5 |
11.5 |
8.6 |
8.9 |
10.5 |
8.9 |
8.6 |
9.6 |
9.3 |
2. |
Gross Fixed Capital Formation |
30.6 |
32.6 |
30.8 |
31.2 |
29.7 |
32.7 |
33.7 |
31.6 |
30.5 |
32.6 |
3. |
Change in Stocks |
2.1 |
2.0 |
2.1 |
2.2 |
2.0 |
2.1 |
2.1 |
1.9 |
2.1 |
2.0 |
4. |
Valuables |
1.2 |
1.5 |
1.3 |
1.3 |
1.2 |
1.4 |
1.5 |
1.6 |
1.3 |
1.5 |
5. |
Exports |
20.6 |
20.1 |
24.4 |
18.5 |
18.7 |
23.4 |
16.6 |
19.9 |
20.4 |
20 |
6. |
Less: Imports |
24.7 |
24.2 |
25.5 |
26.9 |
24.1 |
24.8 |
25.3 |
24.6 |
25.4 |
24.9 |
7. |
Discrepancies |
1.8 |
0.9 |
-5.3 |
4.8 |
3.2 |
-5.0 |
3.9 |
1.1 |
1.0 |
0.1 |
Memo: |
(Rupees crore) |
Real GDP at market prices |
31,17,372 |
33,89,614 |
7,04,997 |
7,21,913 |
8,23,935 |
7,70,843 |
7,85,296 |
8,93,767 |
22,50,845 |
24,49,906 |
* : Quick Estimates. # : Advance Estimates.
Source : Central Statistical Organisation. |
Saving and Investment
Gross Domestic Saving (GDS), as a percentage of GDP at current market prices, increased to 34.8 per cent in 2006-07 from 34.3 per cent in 2005-06 mainly due to improvement in the saving performance by the private corporate and public sectors. On the other hand, the household saving rate declined marginally in 2006-07 from the previous year on account of a decline in the financial saving rate. During the Tenth Five-Year Plan period, however, the household saving rate has remained stable, averaging 23.7 per cent (Table 11). The rate of Gross Domestic Capital Formation (GDCF) is estimated to be higher at 35.9 per cent of GDP in 2006-07 than 35.5 per cent in 2005-06. In terms of GDP, while the overall saving rate increased by 0.5 percentage points in 2006-07, the overall investment rate increased by 0.4 percentage points, reflecting a marginal narrowing down of current account deficit.
Corporate Performance
The performance of non-government non-financial companies moderated during 2007-08 (up to December 2007) relative to the previous year, but still remained healthy (Table 12). Sales growth, which slowed down in the first two quarters of the year, accelerated somewhat in the third quarter of 2007-08. On the whole, however, sales growth during the first nine months of 2007-08 at 17.4 per cent was lower than 29.1 per cent in the corresponding period of the previous year. While growth in gross profits and net profits also decelerated during April-December 2007 as compared with the corresponding period of the previous year, gross profits to sales ratio improved marginally over the same period.
Table 11: Rates of Gross Domestic Saving and Investment |
(Per cent of GDP at current market prices) |
Item |
2001-02 |
2002-03 |
2003-04 |
2004-05 |
2005-06 PE |
2006-07 QE 10th
Plan Average |
|
1 |
2 |
3 |
4 |
5 |
6 |
7 |
8 |
1 |
Household Saving |
22.1 |
23.2 |
24.4 |
23.0 |
24.2 |
23.8 |
23.7 |
|
of which : |
|
|
|
|
|
|
|
|
a) Financial assets |
10.9 |
10.3 |
11.4 |
10.1 |
11.8 |
11.3 |
11.0 |
|
b) Physical assets |
11.3 |
12.9 |
13.0 |
12.9 |
12.5 |
12.5 |
12.7 |
2 |
Private Corporate Saving |
3.4 |
3.9 |
4.4 |
6.6 |
7.5 |
7.8 |
6.0 |
3 |
Public Sector Saving |
-2.0 |
-0.6 |
1.1 |
2.2 |
2.6 |
3.2 |
1.7 |
4 |
Gross Domestic Saving |
23.5 |
26.4 |
29.8 |
31.8 |
34.3 |
34.8 |
31.4 |
5 |
Net capital inflow |
-0.6 |
-1.2 |
-1.6 |
0.4 |
1.2 |
1.1 |
0.0 |
6 |
Gross Domestic Capital Formation # |
22.8 |
25.2 |
28.2 |
32.2 |
35.5 |
35.9 |
31.4 |
7 |
Gross Capital Formation |
24.2 |
25.2 |
26.8 |
31.6 |
34.5 |
36.0 |
30.8 |
|
of which : |
|
|
|
|
|
|
|
|
a) Public sector |
6.9 |
6.1 |
6.3 |
6.9 |
7.6 |
7.8 |
6.9 |
|
b) Private corporate sector |
5.4 |
5.7 |
6.6 |
10.5 |
13.3 |
14.5 |
10.1 |
|
c) Household sector |
11.3 |
12.9 |
13.0 |
12.9 |
12.5 |
12.5 |
12.8 |
|
d) Valuables |
0.6 |
0.6 |
0.9 |
1.3 |
1.2 |
1.2 |
1.0 |
8 |
Total Consumption |
|
|
|
|
|
|
|
|
Expenditure (a+b) |
76.9 |
75.1 |
73.1 |
69.4 |
68.0 |
66.4 |
70.4 |
|
a) Private Final Consumption |
|
|
|
|
|
|
|
|
Expenditure |
64.5 |
63.3 |
61.8 |
58.7 |
57.6 |
56.1 |
59.5 |
|
b) Government Final Consumption |
|
|
|
|
|
|
|
|
Expenditure |
12.4 |
11.9 |
11.3 |
10.7 |
10.4 |
10.3 |
10.9 |
Memo |
|
|
|
|
|
|
|
Saving-Investment Balance (4-6) |
0.7 |
1.2 |
1.6 |
-0.4 |
-1.2 |
-1.1 |
0.0 |
Public Sector Balance |
-8.9 |
-6.7 |
-5.3 |
-4.7 |
-5.0 |
-4.5 |
-5.3 |
Private Sector Balance |
8.8 |
8.5 |
9.2 |
6.1 |
5.9 |
4.5 |
6.8 |
|
a) Private Corporate Sector |
-2.1 |
-1.9 |
-2.2 |
-4.0 |
-5.8 |
-6.8 |
-4.1 |
|
b) Household Sector |
10.9 |
10.3 |
11.4 |
10.1 |
11.8 |
11.3 |
10.9 |
PE : Provisional Estimates. QE : Quick Estimates. # : Adjusted for errors and omissions
Note : Figures may not add up to the totals due to rounding off.
Source : Central Statistical Organisation. |
Business Expectation Surveys
According to the survey by the National Council of Applied Economic Research (NCAER) conducted in December 2007, the overall business confidence index (BCI) for the next six months improved over the previous round of the survey but declined on a year-on-year basis (Table 13). A component-wise analysis shows that all four components, viz., overall economic conditions, financial position of the firms, investment climate and present capacity utilisation (being close to or above optimal level) recorded an increase over the previous round; the sharpest improvement was in the investment climate. The BCI in respect of all the main industry groups defined in terms of use-based classification also improved. Amongst the various industry sectors, the largest gain in business confidence was in the services sector, while the smallest gain was in the consumer non-durable sector.
Table 12: Corporate Financial Performance |
(Growth rates in per cent) |
Item |
2005-06 |
2006-07 |
2006-07 |
2007-08 |
2006-07 |
2007-08 |
|
|
|
April-December |
Q1 |
Q2 |
Q3 |
Q4 |
Q1 |
Q2 |
Q3 |
1 |
2 |
3 |
4 |
5 |
6 |
7 |
8 |
9 |
10 |
11 |
12 |
Sales |
16.3 |
26.2 |
29.1 |
17.4 |
25.6 |
29.2 |
30.3 |
22.5 |
19.2 |
16.0 |
18.0 |
Other Income |
17.3 |
7.1 |
20.9 |
75.5 |
21.6 |
15.5 |
9.2 |
0.4 |
106.7 |
45.2 |
70.2 |
Total expenditure |
16.7 |
23.4 |
26.3 |
17.2 |
24.0 |
27.7 |
25.7 |
20.0 |
18.0 |
15.3 |
18.9 |
Depreciation |
8.1 |
15.4 |
17.2 |
17.1 |
14.9 |
16.4 |
16.8 |
18.1 |
18.1 |
15.8 |
17.9 |
Gross profits |
24.6 |
41.9 |
44.7 |
25.0 |
32.7 |
46.0 |
52.9 |
35.5 |
31.9 |
22.5 |
20.4 |
Interest payments |
-2.0 |
17.4 |
18.5 |
23.9 |
19.9 |
18.0 |
11.9 |
32.3 |
4.4 |
18.4 |
45.7 |
Profits after tax |
32.8 |
45.2 |
46.6 |
29.8 |
34.7 |
49.4 |
59.5 |
39.6 |
33.9 |
22.7 |
29.4 |
|
Select Ratios |
(Per cent) |
Gross Profits to Sales |
12.2 |
15.5 |
15.9 |
16.8 |
15.2 |
15.6 |
15.8 |
15.4 |
16.7 |
16.3 |
16.2 |
Profits After Tax to Sales |
8.2 |
10.7 |
11.1 |
12.2 |
10.6 |
11.0 |
11.0 |
10.6 |
11.6 |
11.5 |
12.2 |
Interest to Sales |
2.2 |
2.1 |
2.1 |
2.2 |
2.2 |
2.0 |
2.0 |
2.0 |
2.0 |
2.1 |
2.5 |
Interest to Gross Profits |
18.1 |
13.4 |
13.0 |
13.1 |
14.2 |
13.1 |
12.6 |
12.9 |
11.8 |
12.8 |
15.3 |
Interest Coverage (Times) |
5.5 |
7.5 |
7.7 |
7.6 |
7.0 |
7.6 |
7.9 |
7.7 |
8.5 |
7.8 |
6.5 |
Memo: |
(Amount in Rs. crore) |
No of Companies |
2,730 |
2,388 |
1,871 |
1,989 |
2,228 |
2,263 |
2,258 |
2,356 |
2,342 |
2,228 |
2,329 |
Sales |
7,35,216 |
10,41,894 |
6,73,056 |
8,14,569 |
2,34,610 |
2,51,125 |
2,60,064 |
2,94,223 |
2,80,814 |
2,97,110 |
3,06,238 |
Other Income* |
17,088 |
23,895 |
13,021 |
25,074 |
4,304 |
5,282 |
4,927 |
8,466 |
9,151 |
8,057 |
9,221 |
Total Expenditure# |
6,43,826 |
8,78,645 |
5,64,464 |
6,83,468 |
2,00,120 |
2,11,043 |
2,17,472 |
2,49,133 |
2,37,698 |
2,49,194 |
2,57,472 |
Depreciation provision |
28,961 |
37,095 |
24,392 |
29,604 |
8,449 |
8,892 |
9,172 |
10,338 |
10,173 |
10,576 |
10,961 |
Gross profits |
90,179 |
1,61,006 |
1,06,898 1,36,643 |
35,761 |
39,055 |
40,995 |
45,424 |
46,780 |
48,296 |
49,717 |
Interest Payments |
16,302 |
21,500 |
13,870 |
17,951 |
5,083 |
5,121 |
5,162 |
5,862 |
5,504 |
6,194 |
7,609 |
Profits after tax |
60,236 |
1,11,107 |
75,036 |
99,272 |
24,845 |
27,710 |
28,698 |
31,251 |
32,699 |
34,266 |
37,470 |
*: Other Income excludes extraordinary income/expenditure if reported explicitly.
#: The increase or decrease in stock in trade is accounted under total income instead of total expenditure as was hitherto done.
Notes:
1. Data for 2005-06 are based on audited balance sheet, while those for 2006-07 and 2007-08 are based on abridged financial results of the select non-Government non-financial public limited companies.
2. Growth rates are per cent changes in the level for the period under reference over the corresponding period of the previous year for common set of companies.
3. The quarterly data may not add up to annual data due to differences in the number and composition of companies covered in each period. |
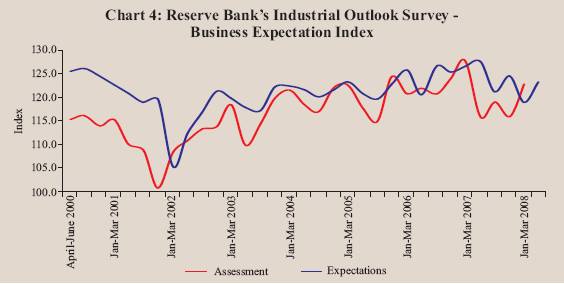
According to the Reserve Bank’s latest Industrial Outlook Survey of manufacturing companies in the private sector conducted in February 2008, the business expectations indices based on assessment for January-March 2008 and on expectations for April-June 2008 increased by 6.0 per cent and 3.9 per cent, respectively, over the previous quarters. The indices, however, declined by 3.8 per cent and 3.4 per cent, respectively, over the corresponding quarter of the previous year (Chart 4).
Table 13: Business Expectations Surveys |
(Per cent) |
|
Business Expectations |
|
|
Agency |
Period |
Index |
Growth over
a year ago |
Growth
over previous round |
1 |
2 |
3 |
4 |
5 |
NCAER |
January-June 2008 |
Business Confidence Index |
-2.1 |
5.6 |
RBI |
April-June 2008 |
Business Expectation Index |
-3.4 |
3.9 |
Dun & Bradstreet |
April-June 2008 |
Business Optimism Index |
-23.6 |
-9.0 |
The improvement in expectations index for April-June 2008 over the previous quarter emanated from higher net responses for major parameters of the survey such as working capital requirement, availability of finance, production, order books, capacity utilisation, employment, exports, imports, selling prices and profit margins than in the previous quarter (Table 14). However, even with this improvement, the performance of the manufacturing sector in the first quarter of 2008-09 was expected to be considerably lower than that of the corresponding quarter of the previous year. A significantly higher proportion of respondents expected a decline in the overall business and financial situation and exports, and an increase in the prices of raw material than in the first quarter of 2007-08.
Purchasing Managers’ Index
The ABN-AMRO Purchasing Manager’s Index (PMI)1 declined to 57.5 in March 2008 from 59.5 in the previous month. While the index posted the lowest reading in the past eight months, it nevertheless indicated a considerable improvement in operating conditions. At a disaggregated level, the seasonally adjusted output index remained markedly high as Indian manufacturers were reported to continue expanding production at their plants in line with strong sales growth and efficiency gains during the month. Despite a weakening in input price index in March 2008, input costs remained strong due to higher prices for a range of raw materials, including aluminum and oil.
Table 14: Reserve Bank’s Survey - Net Response on 'A Quarter Ahead' |
Expectations About the Industrial Performance |
(Per cent) |
| |
|
Jan- |
Apr- |
July- |
Oct- |
Jan- |
Apr- |
Parameter |
Response |
March |
June |
Sept |
Dec. |
Mar |
June |
| |
|
2007 |
2007 |
2007 |
2007 |
2008 |
2008 |
1 |
2 |
3 |
4 |
5 |
6 |
7 |
8 |
1. |
Overall business situation |
Better |
53.7 |
51.7 |
49.5 |
50.2 |
47.7 |
46.0 |
|
|
|
(40.7) |
(43.3) |
(41.2) |
(42.1) |
(42.9) |
(42.7) |
2. |
Financial situation |
Better |
44.5 |
43.8 |
41.3 |
40.1 |
40.3 |
36.6 |
|
|
|
( 49.9) |
(49.8) |
(49.8) |
(51.3) |
(50.3) |
(51.6) |
3. |
Working capital finance requirement |
Increase |
36.2 |
35.3 |
34.5 |
32.2 |
34.7 |
36.6 |
|
|
|
(59.2) |
(59.2) |
(59.2) |
(62.6) |
(60.3) |
(56.5) |
4. |
Availability of finance |
Improve |
36.2 |
35.2 |
32.1 |
33.8 |
31.1 |
32.3 |
|
|
|
(56.6) |
(57.2) |
(58.6) |
(58.8) |
(59.5) |
(58.3) |
5. |
Production |
Increase |
50.7 |
47.8 |
46.6 |
49.0 |
43.9 |
45.2 |
|
|
|
(40.1) |
(41.6) |
(41.1) |
(40.9) |
(42.3) |
(41.0) |
6. |
Order books |
Increase |
47.3 |
45.7 |
43.6 |
44.1 |
37.1 |
41.5 |
|
|
|
(43.1) |
(45.4) |
(46.1) |
(46.0) |
(48.6) |
(44.3) |
7. |
Pending orders, if applicable |
Below normal |
-2.7 |
-2.2 |
-2.2 |
-3.5 |
0.4 |
-4.3 |
|
|
|
(82.9) |
(82.8) |
(82.6) |
(82.4) |
(80.2) |
(81.3) |
8. |
Cost of raw material |
Decrease |
-41.7 |
-42.1 |
-46.0 |
-42.4 |
-44.1 |
-48.2 |
|
|
|
(51.0) |
(52.0) |
(49.7) |
(51.0) |
(49.2) |
(46.0) |
9. |
Inventory of raw material |
Below average |
-7.1 |
-7.3 |
-5.4 |
-6.3 |
-7.3 |
-7.0 |
|
|
|
(83.8) |
(85.0) |
(85.0) |
(85.0) |
(84.8) |
(83.2) |
10. |
Inventory of finished goods |
Below average |
-5.2 |
-4.4 |
-2.7 |
-3.5 |
-4.5 |
-5.8 |
|
|
|
(84.5) |
(85.2) |
(87.1) |
(86.4) |
(86.1) |
(84.5) |
11. |
Capacity utilisation
(Main product) |
Increase |
33.3 |
29.4 |
27.0 |
28.4 |
24.2 |
25.6 |
|
|
|
(57.7) |
(60.4) |
(61.4) |
(61.5) |
(62.3) |
(59.9) |
12. |
Level of capacity utilisation (Compared to the |
Above |
12.8 |
11.5 |
9.4 |
10.7 |
6.4 |
9.4 |
|
average in the preceding four quarters) |
normal |
(76.4) |
(77.1) |
(76.5) |
(77.2) |
(78.3) |
(77.0) |
13. |
Assessment of the production capacity |
More than |
4.8 |
4.0 |
3.0 |
4.2 |
4.7 |
8.0 |
|
(With regard to expected demand in the
next six months) |
adequate |
(81.8) |
(82.2) |
(82.2) |
(83.0) |
(83.8) |
(81.2) |
14. |
Employment in the company |
Increase |
18.1 |
18.3 |
17.4 |
16.7 |
14.6 |
20.8 |
|
|
|
(73.7) |
(73.3) |
(73.5) |
(74.1) |
(75.6) |
(68.2) |
15. |
Exports, if applicable |
Increase |
32.6 |
33.4 |
32.6 |
31.4 |
24.3 |
27.7 |
|
|
|
(57.3) |
(56.8) |
(55.6) |
(55.9) |
(58.3) |
(53.3) |
16. |
Imports, if any |
Increase |
20.8 |
21.6 |
23.7 |
20.8 |
20.1 |
25.3 |
|
|
|
(68.0) |
(68.4) |
(68.2) |
(68.6) |
(70.5) |
(65.6) |
17. |
Selling prices are expected to |
Increase |
14.2 |
15.5 |
19.0 |
13.0 |
14.9 |
19.1 |
|
|
|
(69.2) |
(68.9) |
(67.1) |
(68.5) |
(67.1) |
(66.0) |
18. |
If increase expected in selling prices |
Increase at |
10.5 |
12.1 |
10.4 |
3.7 |
13.3 |
9.0 |
|
|
lower rate |
(68.1) |
(66.7) |
(65.0) |
(58.9) |
(66.7) |
(64.0) |
19. |
Profit margin |
Increase |
11.6 |
9.9 |
7.5 |
9.6 |
5.4 |
7.2 |
|
|
|
(61.7) |
(62.5) |
(62.6) |
(59.6) |
(60.0) |
(61.0) |
Notes:1. 'Net response' is measured as the percentage share differential between the companies reporting 'optimistic' (positive) and 'pessimistic' (negative) responses; responses indicating status quo (no change) are not reckoned.
Higher 'net response' indicates higher level of confidence and vice versa.
2. Figures in parentheses are the percentages of respondents with 'no change over the preceding quarter' as responses. |
CMIE Projections
The recent projections for growth rate of industrial production in 2008-09 by the Centre for Monitoring Indian Economy (CMIE) present an optimistic view in the light of the large investments being made in the economy. The CMIE expects the industrial growth to accelerate from the estimated 8.5 per cent in 2007-08 to 10 per cent in 2008-09. Growth rates in manufacturing, mining and electricity sectors are projected at 10.8 per cent, 8.0 per cent and 6.3 per cent, respectively. On the whole, the industrial rebound is expected to be well-spread across all the sectors and would be fuelled by robust growth in capital goods in the wake of large capital goods imports, investments and healthy order-book position as also a pick-up in growth of consumer goods.
Survey of Professional Forecasters
Several central banks conduct ‘Survey of Professional Forecasters’ on major macroeconomic indicators of short to medium term economic developments so as to gain from the professional expertise and experience of these forecasters. The Reserve Bank has also introduced such a survey from the quarter ended September 2007. The results of the fourth quarter (ended March 2008) survey are presented for select macroeconomic indicators in Table 15.
Forecasts by various agencies for the real GDP growth in 2008-09 are set out in Table 16.
Table 15: Median Forecasts of Select Macroeconomic Indicators by |
Professional Forecasters : 2008-09 |
|
2008-09 |
Indicators |
Annual |
Q1 |
Q2 |
Q3 |
1 |
|
2 |
3 |
4 |
5 |
1. |
Real GDP growth rate at factor cost (in per cent) |
8.1 |
8.1 |
8.3 |
8.1 |
|
a. Agriculture & Allied Activities |
3.0 |
3.0 |
3.0 |
2.9 |
|
b. Industry |
8.1 |
8.4 |
8.5 |
8.6 |
|
c. Services |
9.7 |
10.0 |
9.6 |
9.8 |
2. |
Gross Domestic Saving |
|
|
|
|
|
(per cent of GDP at current market prices) |
35.0 |
- |
- |
- |
3. |
Gross Domestic Capital Formation |
|
|
|
|
|
(per cent of GDP at current market prices) |
36.0 |
36.2 |
36.0 |
36.0 |
4. |
Corporate profit after tax (growth rate in per cent) |
24.7 |
21.3 |
22.6 |
23.1 |
5. |
91-day Treasury Bills Yield (per cent-end period) |
6.8 |
- |
- |
- |
6. |
10-year Government Securities Yield
(per cent-end period) |
7.8 |
- |
- |
- |
7. |
Export (growth rate in per cent) |
15.8 |
- |
- |
- |
8. |
Import (growth rate in per cent) |
20.0 |
- |
- |
- |
9. |
Trade Balance (US $ billion) |
-115.5 |
-28.4 |
-27.5 |
-28.1 |
- : Not Available.
Source : Survey of Professional Forecasters, Fourth Quarter 2007-08. |
Table : 16 : Projections of Real GDP for India by various Agencies - 2007-08 |
(per cent) |
Agency |
Overall
Growth |
Agriculture |
Industry |
Services |
Month of
Projection |
1 |
2 |
3 |
4 |
5 |
6 |
ASSOCHAM |
7.9 |
2.6 |
7.6 |
9.7 |
April 2008 |
Confederation of Indian Industry (CII) |
8.0-8.5 |
- |
- |
- |
March 2008 |
Citigroup |
8.3 |
- |
- |
- |
February 2008 |
|
7.7 |
3.0 |
7.5 |
9.2 |
March 2008 |
Merrill Lynch |
8.4 |
- |
- |
- |
December 2007 |
|
8.2 |
3.0 |
7.6 |
9.9 |
March 2008 |
JP Morgan |
7.5 |
- |
- |
- |
December 2007 |
|
7.0 |
- |
- |
- |
March 2008 |
Goldman Sachs |
7.8 |
- |
- |
- |
January 2008 |
CRISIL |
8.5 |
3.0 |
8.3 |
10.3 |
February 2008 |
|
8.1 |
- |
- |
- |
April 2008 |
Centre for Monitoring the Indian Economy (CMIE) |
9.1 |
3.3 |
10.4 |
10.3 |
February 2008 |
|
9.5 |
2.6 |
11.4 |
10.6 |
April 2008 |
Asian Development Bank |
8.5 |
- |
- |
- |
September 2007 |
|
8.0 |
- |
- |
- |
April 2008 |
International Monetary Fund |
8.4 * |
- |
- |
- |
October 2007 |
|
7.9 * |
- |
- |
- |
April 2008 |
United Nations Organisation |
8.2 |
- |
- |
- |
January 2008 |
Economic Advisory Council to Prime Minister |
8.5 |
- |
- |
- |
January 2008 |
- : Not Available. * : Calendar year. |
1 The PMI is a composite indicator designed to provide an overall view of activity in the manufacturing sector.A PMI of 50.0 indicates no change while values above or below this level indicate an expansion or a contraction of manufacturing activity.
|