Fiscal Policy and Economic Growth
The Indian Experience
Fiscal Policy, Economic Stability and Growth: an Empirical Framework
Limits of Fiscal Policy for Growth
Some Unpleasant Fiscal Arithmetic
Concluding Observations 4.1 The current phase of activity in the Indian economy has brought to the fore a revival of the debate on the role of fiscal policy in stimulating growth. A resurgence of the case for fiscal activism is driven by the argument that fiscal correction through cut back in government investment during the 1990s has contributed to the current deceleration. In this view, the country's debt is moderate by international standards and of internal variety; therefore, substantial increase in government expenditure on investment, especially in agriculture and infrastructure sectors is advocated through deployment of surfeit liquidity and/or monetisation of fiscal deficits (Patnaik, 2001; Rakshit, 2000; Shetty, 2001). The other, more moderate, view recognises the role of fiscal policy in inducing growth but stresses the costs of fiscal deficits. Although the present stream of public financing cannot be sustained any longer, the State will be failing in its duty if it absolves of its responsibility by binding itself to inflexible fiscal rules that can be obeyed only at the cost of much needed public investment (Bagchi, 2001). Moreover, it is argued that the short-term impact of increasing deficit financing on prices and the balance of payments needs to be given due consideration while formulating fiscal measures for long-term growth (Chelliah, 2001). At the other end of the spectrum, considerable scepticism is expressed regarding the efficacy of expansionary fiscal policy at the current juncture (Acharya, 2001). In this context, both the size and quality of fiscal adjustment assume critical importance (Reddy, 2001). The Report of the Economic Advisory Council (EAC, 2001) stresses that high fiscal deficits, by raising real interest rates, crowd out private investment, especially in the context of the government borrowing being predominantly used to finance revenue deficits. The EAC believes that the existing level of public debt is 'too high … and clearly unsustainable'. In a similar vein, the IMF observes that India's fiscal sustainability remains a serious concern with large deficits crowding out private investment and constraining the scope for the monetary authorities to ease interest rates. Achievement of stronger growth would, inter alia, require prompt and credible progress in reducing the fiscal deficit (IMF, 2000). Despite a significant improvement in a number of areas, notably the external sector, the external credit ratings have been downgraded, attributed largely to the fiscal position. 4.2 Against this background, the Chapter addresses the key questions in the debate: Can fiscal policy stimulate the revival and how? What are the downside risks associated with expansionary fiscal policy in terms of macroeconomic instability and future growth? Section I discusses the role of fiscal policy in economic growth, drawing upon theoretical developments and cross-country experience. Section II situates the current debate in the context of the inter-temporal evolution of Indian public finances. An empirical verification of the role of fiscal policy in stimulating growth in India is undertaken in Section III covering issues relating to cyclical and structural influences of the fiscal stance, particularly in the context of the stabilisation function, crowding-in/out associated with public spending and the growth-enhancing potential associated with government capital expenditures. The sustainability of public debt is examined in Section IV. In view of the arguments expressed in favour of pump-priming via monetisation of the fiscal deficit, Section V deals with the ‘unpleasant monetarist arithmetic’ (UMA) hypothesis, its empirical verification in the Indian context focusing on the search for an optimal combination of money and bond financing of the deficit. Concluding observations are contained in Section VI. I. FISCAL POLICY AND ECONOMIC GROWTH The Dominant Paradigm 4.3 The role of fiscal policy in influencing economic growth has been widely debated in the literature. The size of the fiscal deficit, despite a strong opposing view, is widely believed to be a key indicator of the overall stance of fiscal policy. On the impact of fiscal deficits on growth, alternative approaches can be identified. In the tradition of the neoclassical school, fiscal deficits increase aggregate consumption in the economy which leads to a reduction in national savings resulting in higher real interest rates (in a closed economy) and this, in turn, depresses investment and overall economic activity. In an open economy, higher fiscal deficits are reflected in higher capital flows and a real appreciation leading to lower net exports and again, a reduction in overall activity. In either case, a fiscal deficit crowds out investment/net exports and hence, brings about reduction in overall activity. The decline in current investment and build-up of external debt has adverse implications for future output. 4.4 An implicit assumption in the neoclassical approach is that the economy is operating at full employment. In conditions of less than full employment, the Keynesian approach argues that fiscal deficits would not lead to any crowding out. Given sticky wages/ prices, shifts in aggregate demand induced by changes in government spending and taxes affect the utilisation of the economy's factors of production, increasing domestic output. An expansionary fiscal policy according to the Keynesian approach is, therefore, conducive to growth just as overheating of the economy would warrant fiscal tightening. The impact of the fiscal policy on growth would depend upon the existing level of slack in the economy. 4.5 In contrast to the neoclassical and the Keynesian approaches, the Ricardian approach argues that fiscal deficits would be neutral as 'immortal' economic agents internalise variations in government expenditures. These rational agents adjust their consumption/ saving one-to-one in relation to movements in fiscal deficits thereby fully offsetting fiscal policy. With overall savings remaining unchanged, fiscal deficits do not have any impact on economic activity in the Ricardian approach. As empirical support in favour of the Ricardian view is rather weak (Ball and Mankiw, 1995; Elmendorf and Mankiw, 1998), the two major competing theories are the neoclassical and Keynesian approaches. 4.6 Since the late 1980s, developments in endogenous growth theory suggest that economic growth is an endogenous outcome of the system and not the result of forces - like exogenous technical change - that impinge from outside (Romer, 1994). Since growth is endogenous, public policy can influence its magnitude and the role of government in economic development acquires significance. Public capital or public investment in areas like infrastructure, human capital, and science and technology exerts a positive influence on output. Similarly, government activities in protection of property rights and the taxation of economic activity influence growth in an endogenous manner. Thus, unlike the neoclassical growth theory, the endogenous view of growth stresses that fiscal policy can affect long-run growth performance (Tanzi and Zee, 1997). 4.7 Empirical studies on the influence of fiscal policy on growth can be generally grouped into studies testing for the effect of (i) government spending, (ii) taxation and (iii) budget balance on growth. In the first category, several studies have found a negative impact of government spending on output growth rates, lending support to the notion that smaller government sectors are associated with faster growth rates (Landau, 1983, 1986; Grier and Tullock, 1989; Barro, 1991). On the other hand, empirical exercises on the effects of government spending which distinguish between government consumption and government capital accumulation suggest that government capital stock has a positive impact on productivity growth and that government spending had a positive and highly significant impact on output growth rates (Ram, 1986 and Aschauer, 1989). At the same time, the empirical support in favour of the view that capital expenditures increase growth has been debated as the classification of government expenditures into consumption and investment can quickly become problematic. Hence, a more useful classification divides public expenditure into productive (growth-inducing) and unproductive (growth-retarding) (Tanzi and Zee, 1997). Cross-country examination of the relationship between growth and composition of public expenditure produces results that question the conventional wisdom. An increase in current expenditure has positive and statistically significant growth effects while a negative relationship is detected between the capital component of public expenditure and per capita growth (Deverajan, Swaroop and Zou, 1996). The results suggest that productive expenditures, when used in excess, turn unproductive and that several components of current expenditure, such as operations and maintenance, may have higher rates of return than capital expenditure. The focus on capital expenditures by developing country governments has the implication that they may have been misallocating public expenditures in favour of capital expenditures at the expense of current expenditure, losing out in terms of growth in that process. 4.8 In the second category, the near consensus of empirical evidence suggests a negative impact of taxation on output growth (Koester and Kormendi, 1988; Skinner, 1988; Dowrick, 1992; Engen and Skinner, 1992). Even a balanced-budget increase in government spending and taxation is observed to decrease long-term growth rates. This has triggered interest in the role of fiscal policy in inducing business cycles. An erratic time pattern in taxes or tax randomness could increase the intensity of the business cycle. Government spending on education financed by income taxes may spur economic growth, but it may also increase the intensity of cyclical fluctuations. Although these studies suggest a negative impact of taxation on growth, the relationship is not robust and sensitive to model specification, particularly with respect to the list of non-tax variables (like public expenditures and other budget policies) that are controlled (Easterly and Rebelo, 1993). On the whole, as Tanzi and Zee (op cit) note, the empirical evidence on the relationship between taxation and growth is much weaker than suggested by theory. 4.9 Studies on the impact of the budgetary gap have, as in the case of taxation and expenditure, found mixed effects. While a negative and significant correlation between the budget deficits and growth has been found, the correlation has not been found to be robust (Easterly and Rebelo, 1993 and Levine and Renelt, 1992). Another aspect generally examined in the context of budget deficits is the long-run inflationary potential of expansionary fiscal policy. Inflation emanating from monetisation of fiscal deficits may lead to greater uncertainty about future inflation and hence have an adverse effect on growth. In a cross-sectional analysis over the period 1970-99 for 23 emerging economies, IMF (2001) indicates robust evidence of a positive long-run relationship between the size of fiscal deficits and inflation. A (permanent) reduction in the fiscal deficit by 1 percentage point of GDP is associated with a drop of 2-6 percentage points in inflation, depending upon the level of private sector's holding of money. Fiscal Adjustment: Cross Country Experience 4.10 In the 1980s and 1990s, the primacy accorded to government spending has undergone a paradigm shift with many countries preferring a more limited role of government as part of restructuring of the fiscal system. In particular, a number of advanced economies have attained sizable fiscal surpluses for the first time in nearly half a century. The OECD area, for instance, achieved a fiscal surplus in 2000 for the first time after 1969 (Atkinson and Noord, 2001). Moreover, a distinct pattern is visible in the fiscal correction of the 1990s vis-à-vis the 1980s. The fiscal adjustment in the 1990s was achieved by expenditure reductions rather than tax increases; expenditures have been curtailed by cuts in transfer spending and in the public sector wage bill in an urgent effort to address high levels of public debt (IMF, 2001). Unlike in the 1980s, revenue growth since 1993 has made a relatively small contribution to the fiscal adjustment. On an average, general government expenditure in the advanced economies (excluding Japan) declined by close to 6 per cent of GDP during 1993-2000, with the sharpest reduction in the Northern European countries (10.5 per cent of GDP). The bulk of adjustment has fallen on expenditure categories that contributed to the earlier long upward trend in expenditure, viz., wages and salaries, current transfers and interest payments (Table 4.1). The limited contribution of revenue increases during the 1990s reflected a wave of tax reforms in the industrial countries directed towards reduction in marginal tax rates on personal and corporate income in recognition of distortionary effects of high taxation, but tax exemptions, reliefs and credits were drastically curtailed to offset revenue losses. The value added tax (VAT) became an increasingly important source of indirect tax revenues. An important aspect that might have contributed to the reduced role of tax revenues could be the increasing globalisation as competitive pressures may have constrained government's ability and willingness to raise taxes. Table 4.1 : Fiscal Adjustment in OECD Countries - Role of General Government Outlays | | | | | | (As per cent to GDP) | Item/Year
| 1965
| 1980
| 1995
| 2000
| 1
| 2
| 3
| 4
| 5
| Total Outlays | 26.9 | 35.5 | 39.4 | 36.5 | Of which: | | | | | Income Transfers | 6.5 | 10.7 | 13.2 | 12.8 | Subsidies | 0.8 | 1.4 | 0.9 | 0.8 | Interest Payments | 1.4 | 3.1 | 5.0 | 3.8 | Consumption | 14.6 | 17.0 | 16.6 | 15.7 | Net Capital Outlays
| 3.5
| 3.3
| 3.8
| 3.4
| Source: Atkinson and Noord (2001). | | |
4.11 Another noteworthy feature of the fiscal adjustment in the 1990s has been efforts at strengthening fiscal frameworks: mechanisms to strengthen budgetary procedures and to enhance budget flexibility while strengthening expenditure control (Chart IV.1). The Maastricht Treaty and the subsequent Stability and Growth Pact in the euro area, the operation of a golden rule - borrowing only to finance capital spending - since 1997 in the UK and the Fiscal Responsibility Act of 1994 in New Zealand are a few landmarks of this evolution. An important aspect of the fiscal frameworks has been the focus on transparency. Based upon these frameworks, the IMF developed 'Code of Good Practices on Fiscal Transparency - Declaration of Principles' in 1998. The Code provides a benchmark for assessing fiscal transparency and as such represents a standard of fiscal transparency to which all countries should aspire (IMF, 2001). At the same time, reconsideration of the role of government has led to an expanded role for markets in the provision of hitherto exclusively public services, including contracting out of government services, liberalising public procurement, introducing user charges and using vouchers in the distribution of merit goods and services. 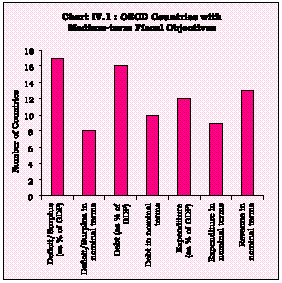
|
4.12 An important issue that emerges from the experience of the 1990s is whether fiscal consolidation achieved would be sustained in the future. In particular, the response of fiscal policy in the event of a future slowdown is uncertain since the current fiscal consolidation and institutional measures to support such fiscal adjustment are yet to face a cyclical downturn. In this regard, one of the important determinants of the likelihood of the success of fiscal adjustment is the composition of fiscal adjustment. In particular, fiscal adjustments that rely primarily on spending cuts in transfers and the government wage bill have a better chance of success than those relying primarily on tax increases and cuts in public investment (Alesina and Perotti, 1997). Based on this view, the recent fiscal strengthening appears to be durable as it has been achieved on the basis of expenditure reductions rather than revenue gains (IMF, 2001). On the other hand, after a relatively long episode of fiscal rigour, pent-up demand for public goods and services may result in more calls for increased government spending. With relatively strong fiscal positions, these calls may be met without a sufficiently careful assessment of the trade-off between alternatives or without a sufficient evaluation of the possible consequences of spending choices (Atkinson and Noord, 2001). 4.13 As in the case of industrial economies, significant fiscal consolidation has also been witnessed in emerging economies since the 1980s. The fiscal deficit/GDP ratio for emerging market economies, as a group, which had increased from 5.1 per cent during the 1970s to 5.7 per cent during the first half of the 1980s, more than halved to 2.7 per cent of GDP during 1996-2000 (IMF, 2001). Although the expenditure-GDP ratio in emerging market economies has been substantially lower than in the OECD countries (Chart IV.2), the fiscal adjustment in the emerging economies, as in the OECD countries, has been based on expenditure reduction. 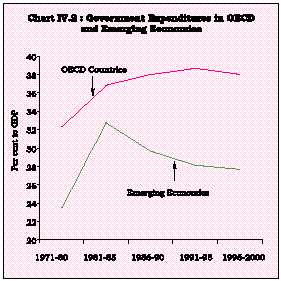
|
4.14 The adjustments in expenditures in emerging countries as a group have been more drastic than in the OECD countries with the expenditure-GDP ratio declining from 33 per cent in 1981-85 to 28 per cent in 1996-2000. With fiscal deficits in Asia already low, the improved outcome for the emerging economies was the result of efforts to contain the deficits in Africa/Middle Eastern and Latin American regions (IMF, 2001) (Charts IV.3 and IV.4) . II. THE INDIAN EXPERIENCE Stylised Facts 4.15 The debate on the role of deficit financing in development has raged since the 1950s. In the early years, it was argued that in a situation of supply constraints, the role of government expenditure in boosting national income through deficit financing is limited (Rao, 1952). Subsequently, the advocacy of deficit financing intensified. It is only in recent years that the poor performance of public sector units, difficulties in financing of public sector deficits, and implications for macroeconomic stability and growth have prompted a reconsideration of the role of fiscal policy in the growth process. 4.16 The 1970s was a period of moderate growth in public expenditure in line with revenue flows. During the 1980s, there was explosive growth, both in public expenditure and revenue, necessitating heavy borrowing requirements. The government expenditures, as a proportion to GDP, expanded from 26 per cent at the beginning of the 1980s to 30 per cent by the close of the decade (Chart IV.5). This was largely the outcome of rising interest payments (Chart IV.6). 4.17 Over time and particularly since the 1980s, a distinct development has been the inability of revenues to keep pace with the expenditures. While total expenditure/GDP ratio increased by almost four percentage points during the 1980s, revenue receipts increased by only two percentage points over the decade (Chart IV.7). 4.18 The sluggishness in revenues was mainly on account of non-tax revenues. While combined tax revenues-GDP ratio increased by more than 2 percentage points over the 1980s, the ratio of non-tax revenues to GDP did not show any improvement over the same period (Charts IV.8 and IV.9). 4.19 This widened the resource gap and the resultant growing borrowing requirements led to an accumulation of public debt. The growth rate of borrowing requirement (GFD) of the Government sector increased from around 17 per cent in the 1970s to 21 per cent in the 1980s. The fiscal deficit, as a result, escalated sharply and reached 9.4 per cent of GDP in 1990-91 (Chart IV.10) with a significant recourse to financing from small saving instruments. 4.20 The continued fiscal imbalances have been reflected in growing public debt with the combined debt/GDP ratio of Central and State Government reaching 61 per cent of GDP by end 1980s (Chart IV.11). Systematic empirical evidence suggests that the high public debt spilled over to the external sector in the form of a deteriorating current account balance (Rangarajan and Mohanty, 1997). 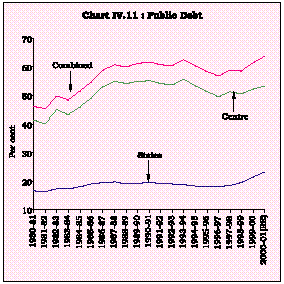
|
4.21 The crisis of 1990-91 and comprehensive economic reforms launched in its aftermath were underpinned by fiscal adjustment and consolidation, improvement in fiscal-monetary coordination, elimination of automatic monetisation of fiscal deficit, introduction of market-determined interest rates and reform in taxation and investment policies. The revenue receipts (as a proportion of GDP) declined in the aftermath of tax rationalisation. Some decline in tax revenue ratios in the short-run was expected due to downward revision in tax rates but this should have been at least partly made up by the removal of many exemptions and through improvements in tax administration (Chelliah, 2001). The structural transformation in the economy also impacted upon the tax revenue flows. Although the service sector contributes about 50 per cent to the GDP and has been growing at a relatively fast rate, it largely remains outside the purview of taxation. 4.22 There are structural weaknesses in the States’ tax system (Chart IV.12). The sales tax, the principal source of tax revenue for the States, is not adequately progressive operationally. Secondly, a potential area for revenue generation, viz., agricultural sector, which comes under the purview of States, remains unexploited. Thirdly, competitive tax rate setting among States has affected the overall tax buoyancy of State taxes. 4.23 A major weakness of government finances has been the inability to curtail revenue expenditures. Although the revenue deficit-GDP ratio declined through the first half of the 1990s in the immediate aftermath of fiscal adjustment, the ratio increased over the second half of the decade and was, in fact, higher than at the beginning of the previous decade (Chart IV.13). 4.24 The structural character acquired by revenue imbalances during the 1990s has been a critical factor underlying the rigidity of fiscal imbalances and explains as to why fiscal correction has not been durable during the 1990s (Table 4.2). Thus, the combined fiscal deficit at the end of the decade was the same as at the beginning at around nine per cent of the GDP. The reduction in the fiscal deficit at the Centre which has also followed a zig-zag path has been off-set by a rise in the fiscal deficit of the States (Rangarajan, 2001). Table 4.2: Fiscal Performance: Combined Government Sector | | | Item | 1971-80
| 1981-90
| 1991-2000
|
| A
| B *
| A
| B
| A
| B
| 1
| 2
| 3
| 4
| 5
| 6
| 7
| Revenue | 15.9 | 16.2 | 19.0 | 16.1 | 18.2 | 13.5 | T a x | 12.6 | 15.8 | 15.0 | 16.0 | 14.6 | 13.6 | Non-Tax | 3.4 | 17.9 | 4.0 | 16.7 | 3.6 | 13.5 | Total Expenditure | 23.0 | 15.3 | 28.8 | 16.5 | 26.9 | 14.2 | Revenue | 15.0 | 15.9 | 20.6 | 18.2 | 22.4 | 15.1 | Capital | 7.9 | 14.4 | 8.2 | 13.0 | 4.5 | 10.3 | Combined GFD | 4.7 | 16.5 | 8.0 | 20.6 | 7.7 | 16.8 | Outstanding Debt | 44.7 | 10.8 | 53.7 | 18.2 | 60.6 | 15.0 | Domestic | 34.5 | 12.8 | 47.0 | 19.4 | 56.3 | 15.6 | External
| 10.2
| 5.4
| 6.7
| 11.0
| 4.3
| 7.6
| A : Percentage to GDP. | | | | | | B : Average Growth Rate. | | | | | | * Data pertain to 1972-80. | | | | | |
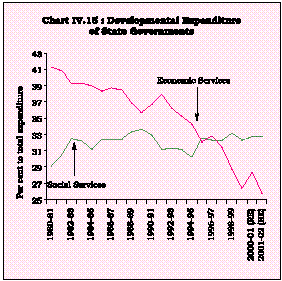
Expenditure Performance 4.25 Countries undertaking fiscal stabilisation attempt to offset increases in interest payments and other transfer obligations by winding back public investment. In periods of restrictive fiscal policies and fiscal consolidation, capital expenditures are the first to be reduced and often drastically, given that they are the least rigid components of expenditures (Roubini and Sachs, 1989). As these expenditures, especially those meant for basic infrastructure, are not adequately compensated by the private investment, this may ultimately result in adverse implications for output growth. In India, current expenditures are assuming a larger proportion of government expenditure, mainly driven by consumption expenditures and transfer payments viz., interest payments and subsidies. On the other hand, social sector expenditure comprising mainly, education, medical facilities, public health, family welfare and sanitation showed a steady deterioration, particularly in the 1990s. The deterioration in the allocations under social sector is sharper in the Centre than in States. Another adverse consequence of the deterioration in revenue/GDP ratio has been the discretionary cut back in public investment in productive sectors raising the issue of the quality of fiscal adjustment and this may have been an important factor underlying the resurfacing of fiscal pressures over the second half of the decade. State Finances 4.26 Assignment of functions and sources of finances among different tiers of government is crucial for the efficient organisation of any federal fiscal system. To enhance welfare gains, the lower level jurisdictions would have to provide all public services of a non-national character and thereby promote growth. According to the decentralisation theorem (Oates, 1972), so long as there are no scale economies, the sub-Central provision of public services results in welfare gains. The gains will be greater, the larger the variation in the preferences for public services. Therefore, progressive and mobile tax base should be assigned primarily to the Central Government, and the sub-Central units should raise revenues mainly through user charges, benefit taxes and taxes on relatively less mobile base (Musgrave, 1983). 4.27 The Indian constitution provides for demarcation of functional responsibilities and finances between the Centre and the States. The provision of public services has been largely entrusted to the States. These mainly relate to law and order, public health, sanitation, water supply and agriculture. The States have to concurrently take certain functions in areas such as education, infrastructure. Their share in combined expenditure (Centre and States) on social services is about 85 per cent, while in the case of economic services, it is about 60 per cent. Thus, the States have the primary responsibility to undertake tasks pertaining to developing social and economic infrastructure. However, their ability to undertake such developmental functions is critically determined by their financial position. 4.28 The fiscal position of the State Governments has been under stress since the mid-1980s. The stress stems from the inadequacy of receipts in meeting the growing expenditure requirements. The low and declining buoyancies in both tax and non-tax receipts, constraints on internal resource mobilisation due to losses incurred by State public sector undertakings, electricity boards and decelerating resource transfers from the Centre have resulted in rising fiscal deficit of the State Governments with an accompanying surge in the outstanding stock of debt. 4.29 Reflecting the fiscal stress, the expenditure for developmental activities, which are directly related to growth, has suffered; on the other hand, expenditure on non-developmental purposes, largely committed, has witnessed a steady rise (Chart IV.14). A rigid distinction between developmental and non-developmental expenditure with regard to their contribution to growth is somewhat difficult since certain non-developmental expenditure items such as expenditure on administrative services also exercise some influence, although of an indirect nature, on economic development. Within the developmental expenditure, the relative importance of social services has increased even though its share in total expenditure has been broadly stable (Chart IV.15). This outcome is due to a steady decline in the share of expenditure on economic services in total expenditure of States. 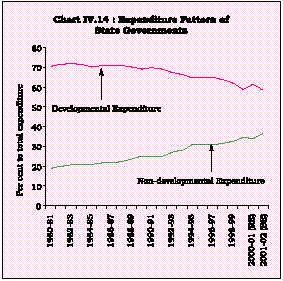
|
|
4.30 The crucial issue, therefore, is to bring about improvement in the State finances with a view to restructuring the expenditure in favour of developmental expenditure in order to enable a higher growth. Fiscal adjustments based predominantly on expenditure reduction, particularly when government expenditure in India are already substantially lower than that in the OECD countries, may involve welfare losses and could also have adverse implications for the growth process. As against this, the fiscal strategy based on revenue maximisation would provide the necessary flexibility to alter the pattern of expenditure so as to ensure productive utilisation of resources. A major challenge for the States in the medium-term is to raise the tax-GDP ratio, which has declined over the years. In addition, the States would need to enhance non-tax revenues, especially through cost recovery in respect of commercial services to ensure appropriate rate of return on their investment. During the 1990s, the cost recovery from social services in the form of revenue receipts has been 0.1 per cent of GDP as against the public expenditure of 5 per cent of GDP in providing these services. Tax-revenues can be raised through broadening the tax base, taxing untapped / under-tapped sources, rationalizing tax rates, introducing uniform value added tax, taxing agricultural income and raising efficiency in tax collections. Fiscal Options from the Current Debate 4.31 It is in this milieu of the deterioration seen in public finances that the debate on role of fiscal policy in revitalising growth has reached a crossroad with one view arguing for expansionary fiscal policy and the other highlighting the costs of higher fiscal deficits. Large fiscal deficits are not regarded as being inimical to growth as long as the government borrowing finances investment expenditures. On the whole, it is believed that it would be counterproductive to insist that fiscal deficit should be brought down to zero or drastically low levels. It is also argued that current imbalances in public finances lie not so much in the overall fiscal deficit but more in the composition of government expenditure (cutback in public investment, inadequate expenditure on education and health) and modes of financing (reliance on high cost borrowing instruments). Substantial increase in government expenditure on investment, especially in agriculture and infrastructure facilities, roll-back of public consumption expenditure to the level obtained in the early 1980s, reduction in subsidies that affect current rather than the future production and income distribution, and enhancement in social sector expenditure in general and primary education and health services in particular are advocated. On the financing side, a greater reliance on monetisation is suggested: as against the actual ratio of less than one per cent during 1996-2000, a monetised deficit of 2.5 per cent of GDP is considered a safe limit (Rakshit, 2000). 4.32 In the context of contractionary features inherent in public policies, there is a call for a decisive expansionary public policy - a 'concentrated approach' or 'imbalanced growth' strategy a la Hirschman - with additional expenditure of Rs.15,000-16,000 crore per annum over the next five years, distributed over four key infrastructure sectors. Towards this objective, deployment of surfeit liquidity in the financial system in a supply-leading strategy outside the budgetary programmes is recommended (Shetty, 2001). 4.33 An important issue of debate has been the crowding-in/out aspect of public investment on private investment; crowding-out is essentially a short-run phenomenon while crowding-in could take place in the medium-term, when, and if, the additional productive public investment yields results. Borrowings should be utilised only to finance capital expenditure. Given the household financial savings, the overall fiscal deficit - termed 'stable growth deficit' - of the government sector, as a whole, should be pegged at 6 per cent of GDP with the revenue deficit being gradually phased out (Chelliah, 2001). 4.34 Given the serious concerns expressed on the fiscal position in the country, an important institutional step envisaged in this direction is the Fiscal Responsibility and Budget Management Bill (FRBM), 2000. The FRBM approaches the issues of inter-generational equity in fiscal management and long-term macro-economic stability by envisaging complete elimination of revenue deficit by March 2006, generation of sufficient revenue surplus in the subsequent periods and reduction of the fiscal deficit-GDP ratio to 2 per cent by the Central Government by end-March 2006. The Bill also envisages a reduction in total liabilities (including external debt at current exchange rates) of the Centre to no more than 50 per cent of GDP by March 2011. In a similar vein, the Eleventh Finance Commission (GoI, 2000) stresses the need to completely eliminate the revenue deficit, generate primary surplus and reduce the fiscal deficit-GDP ratio of the State Governments to 2.5 per cent by the year 2004-05. While FRBM is an important step towards reforming the Indian public finances, concerns have been expressed about inflexibility to pursue counter-cyclical fiscal policy. The proposal of the FRBM to reduce the fiscal deficit to low levels may be counter productive as it may fail to sustain high rates of economic growth (Bagchi, 2001). 4.35 Such fiscal frameworks with legislative backing have been enacted in a number of countries in the recent years (Table 4.3) and the recent fiscal consolidation in the OECD countries is attributed partly to such frameworks (IMF, 2001). Table 4.3 : Fiscal Targets and Frameworks |
| Deficit Measure | Level of | Targets for India
| | Selected International Frameworks | | | Government | FRBM | EFC | | | | | | Target (As | Target (As | | | | | | per cent to | per cent to | | |
|
| GDP)
| GDP)
|
|
| 1
| 2
| 3
| 4
|
| 5
| Fiscal Deficit | Centre | 2.0 | 4.5 | | EU: Medium-term objective close to balance | | | States | | 2.5 | | or in surplus with a ceiling of 3.0 per cent | | | Combined | | 6.5 | | in cyclical downturns. | | | | | | | United Kingdom (UK): Borrowing only to finance | | | | | | | investment (golden rule). | | | | | | | Argentina: Fiscal Balance by 2005. | | | | | | | | Revenue Deficit | Centre | 0 | 1.0 | | | | | States | | 0.0 | | | | | Combined | | 1.0 | | | | | | | | | | Total liabilities | Centre | <50 | 48 | | EU: 60 per cent of GDP. | | | States | | | | UK: 40 per cent of GDP. |
| Combined
|
| 55
|
|
| FRBM: Fiscal Responsibility and Budget Management Bill. | EFC: Eleventh Finance Commission. | EU: European Union. |
Two contrasting views on the ability of these frameworks to improve public finances are found in the literature. The 'institutional irrelevance view' holds that such fiscal frameworks may not succeed as the budget rules can be circumvented by modifying accounting practices and changing the nominal timing or other classification of taxes and expenditure, i.e., the rules-based systems may be by-passed through creative accounting (Reischauer, 1990; Auerbach, 1994 and IMF, 2001). The 'public choice view' stresses that fiscal institutions place important constraints on the behaviour of political actors. Given the relatively short period and limited number of countries with such regimes, the empirical success of such regimes remains to be tested. Nonetheless, the limited evidence suggests that such institutions improve the fiscal outcome and hence, the fiscal institutions do matter (Gramlich, 1990; von Hagen and Harden, 1995 and Poterba, 1997). III. FISCAL POLICY, ECONOMIC STABILITY AND GROWTH: AN EMPIRICAL FRAMEWORK Cyclical and Structural Fiscal Deficits 4.36 In this section, the case for an expansionary fiscal policy in the context of the current downturn is examined within the framework of a small, testable model of the fiscal dynamics in India. It needs to be recognised that not only does the fiscal stance affect output, but the variability of output - imbalances between aggregate demand and aggregate supply - can also feedback on to the realised fiscal deficit. Given this simultaneity, an important question is to examine the design of fiscal policy to see whether fiscal policy automatically smoothens the business cycle or discretionary interventions are required. This aspect is usually examined by decomposing the actual fiscal deficit into a structural component (unresponsive to cycles in the economy) and a cyclical component (responsive to cycles). 4.37 As the economy slows down, revenues of the government, at unchanged tax rates, are expected to decline while its expenditure - say, on anti-poverty schemes, unemployment benefits - would increase. Thus, the cyclical component of the fiscal balance is expected to turn negative as the economy slows and vice versa. With the structural balance unchanged, the actual fiscal deficit would widen in the event of a slowdown. In such a case, the behaviour of the cyclical fiscal deficit is stabilising and the fiscal policy has an automatic stabiliser. If the cyclical component is strong, this obviates the need for a discretionary fiscal policy. The cyclical balance, though, need not work always in this fashion; its operation may be pro-cyclical and aggravate the swing in economic activity. In an extreme case, the cyclical component may be absent if private sector savings behave in a Ricardian manner, i.e., households step up savings in reaction to deteriorating fiscal balances. Such private sector savings reactions are expected to be more likely if the public debt is already high and private sector expects tax increases in the future. Under these circumstances, the in-built stabiliser part of fiscal policy would be ineffective. Accordingly, in the 1990s, the governments have increasingly supplemented/counteracted the cyclical component with discretionary policy changes (IMF, 2001) - for instance, reduction in tax rates or increased public spending or a combination of both to boost aggregate demand - to strengthen the growth impulses. 4.38 For OECD countries, automatic stabilisers have generally reduced cyclical volatility in the 1990s (Noord, 2000). However, since some of these countries had to undertake fiscal consolidation to improve public finances to meet the Maastricht criteria, the governments were forced to take discretionary actions that have reduced, or even offset, the effect of automatic stabilisers. By avoiding the hysteresis effects that may arise due to sharp economic fluctuations, fiscal stabilisers are conducive to long-run growth. In the Indian context, estimates have shown that structural deficit is quite predominant; the cyclical component, on the other hand, though present, is not significant (RBI, 1999; Pattnaik et al, 1999). 4.39 The first testable hypothesis is, therefore, to check for an automatic stabilising cyclical component in fiscal policy in India and its size. Following Giorno et al (1995) and Noord (2000), the cyclical and structural fiscal deficits are calculated by estimating structural revenues and structural expenditures, i.e., revenues and expenditures that would have prevailed had the actual output been at its potential level. The cyclical component of the fiscal deficit is then derived as the difference between the structural components of government revenues and expenditures from their actual levels1. Interest payments, given their contractual nature, are assumed to be impervious to cyclical movements in output. Moreover, the methodology assumes that the elasticity of revenues and expenditures is same across cyclical and trend (potential) output. 4.40 The first step in this process is, therefore, to estimate elasticities of revenues and non-interest expenditure of the government - both Centre and States separately as well as combined - with respect to actual output. The estimates indicate that elasticity of receipts of the combined government sector at 1.07 is fractionally higher than that of 1.06 for non-interest expenditures, indicating the operation of automatic fiscal stabiliser. Based on these elasticity estimates, the cyclical and structural components of fiscal deficits are presented in Table 4.4. 4.41 The estimates confirm the predominance of the structural deficit. The cyclical component, as in previous studies, is not large in magnitude. Over the period, 1981-2001, the cyclical fiscal balance has ranged between a deficit of 0.12 per cent of GDP and a surplus of 0.21 per cent of GDP as against the actual deficit of around 8.0 per cent of GDP (Chart IV.16). Given the small size of the automatic stabiliser, counter-cyclical measures would have to depend upon discretionary fiscal actions. 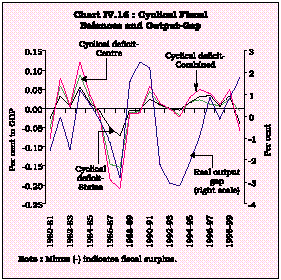
|
Table 4.4: Structural and Cyclical Fiscal Deficits | | | | | | | | | (As per cent to GDP) |
| Year | Centre
| States
| Combined
|
| SD
| CD
| AD
| SD
| CD
| AD
| SD
| CD
| AD
| 1
| 2
| 3
| 4
| 5
| 6
| 7
| 8
| 9
| 10
| 1980-81 | 5.83 | -0.05 | 5.77 | 2.61 | -0.03 | 2.58 | 7.58 | -0.08 | 7.50 | 1981-82 | 5.08 | 0.06 | 5.14 | 2.38 | 0.03 | 2.41 | 6.21 | 0.08 | 6.29 | 1982-83 | 5.64 | 0.01 | 5.64 | 2.65 | 0.00 | 2.65 | 5.90 | 0.01 | 5.90 | 1983-84 | 5.85 | 0.09 | 5.94 | 2.84 | 0.05 | 2.90 | 7.16 | 0.12 | 7.28 | 1984-85 | 7.07 | 0.02 | 7.09 | 3.33 | 0.01 | 3.34 | 8.93 | 0.03 | 8.97 | 1985-86 | 7.88 | -0.02 | 7.86 | 2.71 | -0.01 | 2,71 | 8.00 | -0.02 | 7.98 | 1986-87 | 8.61 | -0.15 | 8.46 | 3.03 | -0.05 | 2.98 | 10.08 | -0.19 | 9.89 | 1987-88 | 7.79 | -0.15 | 7.63 | 3.24 | -0.07 | 3.17 | 9.36 | -0.21 | 9.15 | 1988-89 | 7.35 | -0.01 | 7.33 | 2.77 | -0.01 | 2.77 | 8.53 | -0.01 | 8.51 | 1989-90 | 7.34 | -0.01 | 7.33 | 3.18 | -0.01 | 3.17 | 8.88 | -0.01 | 8.87 | 1990-91 | 7.80 | 0.04 | 7.85 | 3.28 | 0.02 | 3.30 | 9.36 | 0.06 | 9.42 | 1991-92 | 5.55 | 0.01 | 5.56 | 2.89 | 0.01 | 2.89 | 7.01 | 0.01 | 7.02 | 1992-93 | 5.37 | 0.00 | 5.37 | 2.79 | 0.00 | 2.79 | 7.00 | -0.01 | 7.00 | 1993-94 | 7.03 | -0.02 | 7.01 | 2.40 | -0.01 | 2.40 | 8.28 | -0.02 | 8.26 | 1994-95 | 5.68 | 0.02 | 5.70 | 2.72 | 0.01 | 2.73 | 7.05 | 0.03 | 7.07 | 1995-96 | 5.05 | 0.02 | 5.07 | 2.62 | 0.03 | 2.65 | 6.49 | 0.05 | 6.54 | 1996-97 | 4.87 | 0.01 | 4.88 | 2.69 | 0.03 | 2.72 | 6.34 | 0.04 | 6.38 | 1997-98 | 5.83 | 0.01 | 5.84 | 2.90 | 0.01 | 2.90 | 7.26 | 0.01 | 7.27 | 1998-99 | 6.42 | 0.02 | 6.45 | 4.19 | 0.03 | 4.22 | 8.88 | 0.05 | 8.93 | 1999-2000 | 5.36 | -0.01 | 5.35 | 4.71 | -0.04 | 4.67 | 9.50 | -0.06 | 9.44 | 2000-2001
| 5.14
| -0.01
| 5.13
| 4.44
| -0.08
| 4.36
| 9.28
| -0.14
| 9.14
| CD : Cyclical Deficit | | SD : Structural Deficit | AD : Actual Deficit. | | | Note: (-) indicates surplus. | | | | | | | |
Crowding-In/Out Aspect of Government Activity 4.42 Once the case for an expansionary fiscal policy is admitted, the issue that arises is its impact on the rest of the economy or more precisely, whether or not the higher government expenditure crowds in private consumption and investment. For counter-cyclical discretionary fiscal actions to be effective, the reaction of the private sector should not negate the demand impulse stemming from the fiscal impulse. A number of studies that have estimated private sector behaviour in India suggest that crowding-out/ in effect of public investment is sector-specific. Public investment exerts a short-run crowding-out but establishes long-run complementarity with private investment (Sundarrajan and Thakur, 1980). In the case of total private investment, the positive effect (complementarity) almost cancels out the negative effect (crowding-out), whereas in the case of private corporate investment, the positive effect seems to dominate the negative effect (Rangarajan, 1982). Other studies indicate that while there is some complementarity in certain sectors, the evidence on the overall impact of public investment on private investment is not definitive (Krishnamurthy and Saibaba, 1982 and Bhattacharya et al 1994). The long-term complementarity of public and private investment was also underscored by Pillai et al (1997). 4.43 In view of the differential behaviour of different components of government activities on private sector suggested in the survey of the literature, this section undertakes a detailed assessment of the interaction between government activities and private sector behaviour. In particular, the behaviour of the direct taxes, indirect taxes, public sector consumption expenditure, public sector capital formation (manufacturing and infrastructure separately), private sector consumption and private sector investment expenditure in terms of their determinants over the period 1972-73 to 1999-2000 is studied. Moreover, in contrast to the earlier section on cyclical/ structural deficits, the model attempts to isolate the response of the government's budgetary components and private sector behaviour to cyclical and trend output. As mentioned earlier, cyclical output is measured by the imbalance between aggregate demand and aggregate supply. This requires the estimation of the behaviour of various components of aggregate demand and aggregate supply (examined in disaggregation in Chapter III), within a full scale macroeconomic model of the economy. This is undertaken in Chapter VIII. A reasonable approximation of the behaviour of cyclical output can, however, be obtained from the deviations of actual output from its underlying trend. These measures of cyclical output are highly correlated with the difference between aggregate demand and supply obtained from the macro-model in Chapter VIII. The results of the estimated equations are discussed below, followed by the results of model simulation. Government Revenues 4.44 Direct tax revenues are positively related to the trend output with a long-run elasticity of almost unity (0.95). The cyclical output also has a positive impact, with a lag, on direct taxes, although the impact is fairly negligible (a long-run semi-elasticity of 0.02)2. Indirect tax revenues exhibit a similar behaviour (Table 4.5). The elasticity of indirect tax revenues3 with trend output is estimated at 1.18. The elasticity with respect to cyclical output at 0.01 is almost negligible, as in the case of direct taxes. The lagged impact of cyclical output indicates the presence of leads in tax collections. The estimated series track the actual series fairly closely for both the tax components (Charts IV.17 and IV.18). Table 4.5 : Elasticity of Major Government Revenues | | | Variable
| Direct Taxes
| Indirect Taxes
| 1
| 2
| 3
| Trend Output | 0.95 | 1.18 | Cyclical Output
| 0.02
| 0.01
|
Government Consumption Expenditure 4.45 On the expenditure side, government final consumption expenditure turns out to be impervious to cyclical output4. The elasticity of government final consumption expenditure with respect to trend output is estimated at 1.14, i.e., a 10 per cent increase in trend output leads to an almost 11 per cent rise in consumption expenditures. The high elasticity highlights the inability of the government to restrict its consumption expenditures and has been an important factor underlying the weakness in public finances. The estimated series mirrors the actual expenditures closely (Chart IV.19). Public Sector Investment in Manufacturing Sector 4.46 Investment plays an important role in increasing the productive capacity of the economy. Public investment occurs both in manufacturing and infrastructural sectors. Public investment in manufacturing is strongly influenced by trend output with an elasticity of almost unity5. It also responds to business cycles in a pro-cyclical manner although the magnitude is negligible (Chart IV.20). Public Sector Investment in Infrastructure Sector 4.47 As regards public sector capital formation in infrastructure, it increases in line with trend output with an elasticity of 0.536 (Table 4.6). The lower elasticity of infrastructural investment appears to be the outcome of the substantial increases in government consumption expenditures (more than unit elasticity as estimates of the consumption behaviour indicated) leaving relatively less resources for investment (Chart IV.21). Table 4.6: Elasticity of Major Government Expenditures | | | | | | Elasticity | Government | Public Sector | Public Sector | with respect to | Final | Investment in | Investment in | | | Consumption | Manufacturing | Infrastructure |
| Expenditure
|
|
| 1
| 2
| 3
| 4
| Trend Output | 1.14 | 0.96 | 0.53 | Cyclical Output
| -
| 0.04
| -
|
Private Sector Consumption Behaviour 4.48 Turning to private sector consumption behaviour, the immediate response of private sector consumption to output changes is pro-cyclical. The impact of cyclicial output, however, is negligible with the estimated semi-elasticily being 0.01, i.e., a 10 per cent increase in cyclical output increases private consumption by only 0.1 per cent. Direct taxes have an expected negative impact on private consumption with short-run and long-run elasticities of 0.1 and 0.2. The estimated elasticity indicates that a 10 per cent reduction in direct taxes will increase private consumption by almost 1 per cent in the same year and by 2 per cent over time. Government (non-interest) transfer payments and government consumption expenditures have positive contemporaneous effects on private consumption, although the effect of the latter is not significant. Both these components, however, crowd out private sector consumption with a lag7. An increase of 10 per cent in government non-interest transfer payments increases private consumption by around 0.8 per cent in the current year and reduces it by 0.6 per cent in the subsequent year (Table 4.7). In response to an increase of 10 per cent in government consumption expenditure, private consumption declines by 2.5 per cent, with a lag, indicating Ricardian behaviour by economic agents, i.e., individuals increase their savings in expectations of higher taxes in the future. Overall, the estimates suggest that government consumption activities do not have a lasting effect on private consumption. The estimated series tracks the actual private sector consumption movements quite closely (Chart IV.22). 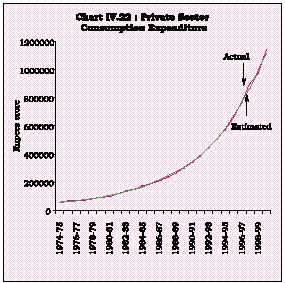
|
Table 4.7 : Elasticity of Private Consumption | Variable
|
| 1
| 2
| Cyclical Output | 0.02 | Direct Taxes | -0.16 | Transfer Payments | 0.19 | Government Final Consumption Lagged
| -0.58
|
Private Sector Investment Behaviour 4.49 Private sector investment behaviour responds significantly to trend output8. The estimated elasticity of 0.9 indicates that an increase of 10 per cent in trend output induces almost a similar order of increase in private investment. Business cycles do not appear to exercise any significant impact suggesting that investment, particularly fixed investment decisions are based on long-horizons, impervious to cyclical fluctuations. Public sector investment in manufacturing has a negative effect on private investment, i.e., government manufacturing investment crowds out private investment. An increase of 10 per cent in government manufacturing reduces private investment by more than one per cent with a one-year lag. This finding supports the view that public investment in manufacturing utilises scarce physical and financial resources that would otherwise have been available to the private sector and that the output of this sector may also be competing with that of the private sector. 4.50 On the other hand, government investment in infrastructure has a positive impact on private investment with a 10 per cent rise in the former inducing an increase of 3 per cent in the latter. The crowding-in of private investment suggests that the public sector infrastructure investment may be increasing the productivity of the capital in the economy which, by raising domestic output attracts higher private investment. Moreover, the comparison of the estimates reveals that the crowding-in effect of infrastructure investment is stronger than the crowding-out effect of manufacturing suggesting that government investment could be concentrated in infrastructure activities. While the government investment per se induces private investment, it may at the same time enlarge the fiscal deficit which, in turn, could have an adverse influence on private investment. The estimates indicate such a negative and significant effect with elasticity of (change in) fiscal deficit at 0.3, i.e., an increase of 10 per cent in the fiscal deficit could reduce private investment by almost three per cent (Table 4.8). Estimated and actual private investment are set out in Chart IV.23. 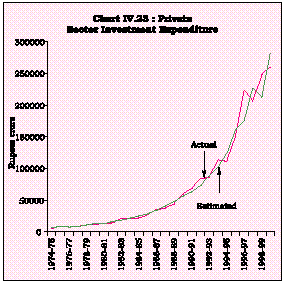
|
Table 4.8 : Elasticity of Private Investment | | | | Variable
|
| 1
| 2
| Public Investment in Manufacturing | -0.12 | Public Investment in Infrastructure | 0.32 | Fiscal Deficit
| -0.30
|
Model Simulation 4.51 The model was simulated to see the implications of pump-priming the economy through alternative instruments at the disposal of the government. In particular, shocks of 10 per cent each were given to direct taxes, government final consumption expenditure, public sector investment in infrastructure and public sector investment in manufacturing. 4.52 A reduction of 10 per cent in direct taxes increases private consumption by 0.4 per cent in the same period and by another 0.5 per cent in the next year with the impact dampening over time. Private investment declines by 0.8 per cent, with a lag, as reduction in taxes enlarges the fiscal deficit, depressing the private investment. The reduction in private investment partially offsets the boost to consumption. Nominal output rises by 0.3 per cent in the year of the shock and the impact weakens over time (Chart IV.24). 4.53 A 10 per cent increase in government final consumption expenditure leads to a contemporaneuous increase of one per cent in output. It leads to a decline of around 4 per cent in private investment with a lag as the higher government consumption expenditure feeds into an increase in the fiscal deficit. Private consumption is also crowded out. The initial output increase is offset by subsequent declines (Chart IV.25). 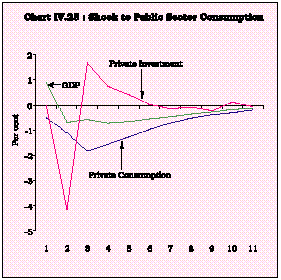
|
4.54 As regards shocks to government investment, the results display a differential behaviour: while private investment is 'crowded-in' in case of public sector's infrastructure investment, the manufacturing investment crowds out the private investment. The enlarged fiscal deficit dampens the positive effect on private investment in both cases. On a net basis, infrastructure investment still has a crowding-in effect. Finally, the impact of infrastructure investment shock on output growth remains positive in the case of manufacturing investment; in the case of manufacturing investment, output gains turn negative (Charts IV.26 and IV.27). 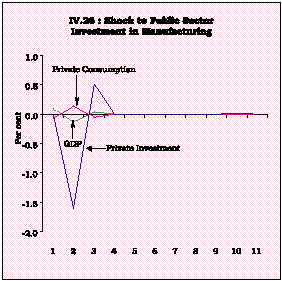
|
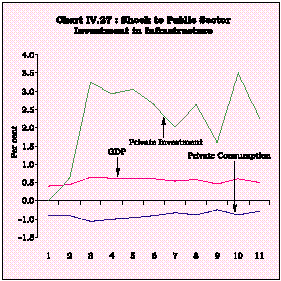
|
4.55 In brief, the results show that raising public sector consumption to boost aggregate demand in the economy crowd-out both private consumption and investment with no long-lasting impact on output. Infrastructure investment by public sector crowds in private investment. Pump-priming via public investment in manufacturing has a negative impact on private investment. The results stress the need for a restructuring of the composition of government expenditure in favour of investment in infrastructure while ensuring that (i) the fiscal deficit is unchanged or even reduced; and (ii) such investment is contingent upon enforced financial discipline emphasising cost recovery and productivity gains. IV. LIMITS OF FISCAL POLICY FOR GROWTH Fiscal Sustainability 4.56 An important objection against the pump-priming variety of fiscal activism, at the present juncture, is the concern about sustainability of the present state of public finances. The declining trend in the debt/GDP ratio witnessed in the early 1990s has reversed since 1997-98 with the debt of state governments exhibiting an inertia (Chart IV.11). With the interest rate on government securities becoming market-related, the weighted average cost of government securities rose to a peak of 13.8 per cent in 1995-96 before moderating to 11.0 per cent in 2000-01. Furthermore, interest rates on public account liabilities, which include small savings and provident funds, grew significantly. With a view to smoothening the inter-temporal maturity pattern and to reduce the interest cost and in the context of reduced investor appetite for longer-bonds, the market borrowings of the government were placed at the shorter- and medium-end of the market during the 1990s. As a result, securities with short- and medium term maturity (under 5 years) as a proportion of total outstanding dated securities rose sharply from 9 per cent at end-March 1991 to 35 per cent at end-March 2001 with consequent bunching of securities for redemption and frequent roll-over of such short-term issues. Besides the explicit debt, there has been a rise in contingent liabilities in the form of guarantees extended by the Government. Guarantees are emerging as the alternative fiscal instrument to meet fund requirements of state level bodies. At present, outstanding guarantee obligations given by the Central and State government together account for around 11 per cent of GDP. The secular increase in combined public debt has, therefore, brought serious concerns about the sustainability of the existing fiscal policies. Debt Dynamics 4.57 Debt may be considered sustainable if the debt/output ratio does not grow to explosive proportions. A necessary condition for stability is the Domar's Debt Stability Equation: b(r-g) -z = 0, where b is debt/GDP ratio, r is real interest rate on government debt, g is real output growth and z is primary deficit/GDP ratio. The Domar stability condition holds if g exceeds r; debt-GDP ratio is likely to be stable provided primary balance is either zero or positive (not very large if it is negative). With r higher than g, debt-GDP ratio would be rising if primary balance is either zero or negative. Thus, even if growth in output exceeds the real interest rate, a large initial primary deficit may lead to rise in debt/GDP ratio. In other words, the condition 'r is less than or equal to g' would also require that the initial debt stock equal the present discounted value of primary surpluses in the future (Lahiri and Kannan, 2001; Blanchard, 1980). 4.58 An important distinction in this context is between stability and sustainability with the former being a necessary but not a sufficient condition for sustainability. The latter includes the condition of instability and also depends upon the willingness of the public to hold the debt in future periods. Therefore, any assessment of debt sustainability requires analysis of ownership pattern, market structure and investor preferences. For instance, retail investors are less speculative and tend to buy and hold securities till maturity. Institutional investors, on the other hand, actively trade in debt and tend to reduce or increase their holdings depending upon the current/ expected movements in the market conditions. Thus, a higher debt/GDP ratio with higher proportion of individual investor holdings is more stable than a lower debt/GDP ratio with higher proportion of institutional holdings. 4.59 A number of studies have empirically tested sustainability of public debt in India. Amongst the earlier studies on the issue, Seshan (1987) found that internal debt of the government was unsustainable. Alternative scenarios for financing of the government deficit showed that monetary financing of deficit would lead to a vicious circle: higher deficits need higher monetary financing resulting in more inflation and higher deficit (Rangarajan, Basu and Jadhav, 1989). Domar stability holds in terms of the average interest rate; however, when GDP growth rate is compared with call money rate and commercial bank lending rate, debt is not sustainable (Jha, 1999). The appropriateness of a risky rate like a commercial bank lending rate instead of a risk-free rate to judge the Domar condition for the government sector, however, is not clear. On the basis of a cross-over of average interest rate and interest rate on small savings and provident funds over the GDP growth rate in 1997-98 and the forecast that redemption yield on government bonds would touch 16.5 per cent in 2003, Rajaraman and Mukhopadhyay (1999) suggested a debt trap situation. In contrast to these studies, Khundrakpam (1998) and Moorthy et al (2000) found the Indian public debt to be sustainable in terms of Domar's stability equation (Chart IV.28). 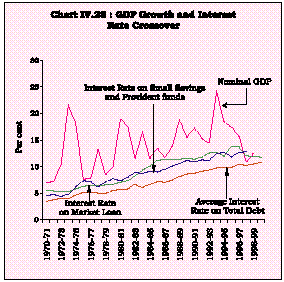
|
4.60 An alternative approach to sustainability is adopted in this section in the tradition of Buiter and Patel (1992) and Ray (1996) based on intertemporal budget constraint to assess the long-run solvency of debt over the period 1980-2000. The method involves discounting the nominal stock of government debt with an appropriate interest rate and assessing the stationarity of the resultant discounted series. Total internal liabilities of the Central Government include market loans as well as small savings and provident funds. Since interest rates on the latter component is not market related, these liabilities were segregated from total internal liabilities of the government. The series on remaining liabilities was discounted with the weighted average coupon rate of dated government securities and tested for stationarity (Chart IV.29). Unit root tests show that discounted series remains non-stationary which implies that government debt continues to be unsustainable9. These results are in consonance with the findings of Buiter and Patel (1992) and Ray (1996) although they contradict the results emanating from the static Domar condition. 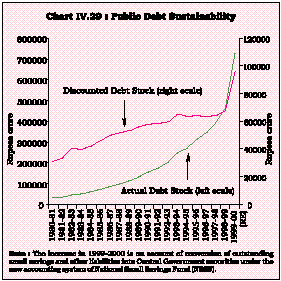
|
V. SOME UNPLEASANT FISCAL ARITHMETIC 4.61 The recent call for an expansionary fiscal policy has taken the form of an argument for pump-priming by monetising the fiscal deficit. It has been argued that financing does not matter and money financing may even ease the tax constraint. This argument revisits the unpleasant monetarist arithmetic (UMA) proposition (Sargent and Wallace, 1981) which analysed the build-up of public debt and its inflationary implications in the context of a conflict between the monetary and fiscal authorities. In particular, with real interest rates higher than real growth rate and with tight monetary policy but profligate fiscal policy, it was argued that bond financing is more inflationary than money financing. Given the stream of future primary (non-interest) fiscal deficits, the reliance on bond-financing continues to raise the public debt over time in an explosive manner. This cannot go on forever since the demand for bonds places an upper limit on bonds that would be held by the public. At some point, the public debt-GDP would outstrip the ratio of total wealth to income and bond-financing is no longer feasible. The monetary authority would then be forced to provide seigniorage revenues to finance not only the future government primary deficits but also has to service the existing public debt, forcing the creation of additional high-powered money, culminating in additional inflation. The implication of the Sargent-Wallace argument, therefore, is that fighting current inflation through tight monetary policy works only temporarily; eventually, it leads to higher inflation. In other words, an increase in primary fiscal deficits, at some time, requires a permanent increase in the inflation rate to ensure that the government's inter-temporal budget constraint is satisfied. Sargent and Wallace also argued that if economic agents have rational expectations, 'a tight monetary policy today leads to higher inflation not only eventually but starting today; tighter money today lacks even a temporary ability to fight inflation'. 4.62 The applicability of the UMA depends crucially on the condition that real interest rates increase as the government debt increases and they are higher than the real growth rate. Darby (1984) argued that real interest rates need not increase with higher debt if the economic agents are Ricardian, i.e., if the individuals are concerned about future generations, the higher current period debt will be offset by higher private savings. The relevant interest rate indicator is not before-tax real rate but after-tax real rate. Moreover, even the assumption of pre-tax real interest rates being higher than growth rates is not supported by empirical evidence. For most of the post-World War II data, for instance, the real interest rate has been below the growth rate in both the US and Canada (Bhattacharya and Haslag, 1999). On the other hand, the empirical evidence suggests that the Sargent-Wallace assumption of real interest rates greater than real growth rates may be realistic for European countries (Winckler, Hochreiter and Brandner, 1998). This is the outcome of increased worldwide capital mobility that equalises real interest rates globally at a high level although real GDP growth rates have been rather lower in Europe. 4.63 It was, however, pointed out that the empirical evidence of real interest rates being lower than the real growth rate, based on historical episodes, is flawed and does not resolve the issue since such real interest rates reflect the monetary and fiscal policies followed during that historical period (Miller and Sargent, 1984). The critical issue is whether the real interest rate would remain unchanged in the context of a change in future fiscal and monetary policies. Miller and Sargent believed that real interest rates may not remain constant and, accordingly, the average difference between the real growth rate and real interest rate cannot be expected to remain the same after a change in monetary and fiscal policies in the face of higher fiscal deficits. 4.64 More recently, it has been argued that, even if the condition 'real interest rate higher than real growth rate' does not hold, the Sargent-Wallace argument against bond financing and its inflationary potential may still be valid. The modified outcome arises if the basic Sargent-Wallace model containing two assets, money and government bonds, is extended to include an additional competing asset that has a store of value - an asset like equities representing claims on investment projects - with a real return higher than the economy's growth rate. Furthermore, if the economic agents invest in such investment projects (equities) not directly but through banks acting as intermediaries and the banks are mandated to hold a fraction of their deposits as cash reserves, then any increase in bond financing by the government must be accompanied by decline in bank deposits. The reduction in bank deposits, in turn, lowers bank's cash reserve requirements, i.e., crowds out money holdings, reducing the seigniorage tax base. For an unchanged reserve money growth, the loss in revenue from the fall in the seigniorage tax base exceeds the gains from bond sales. In order to bridge the revenue gap, the government would be forced to step up the base money growth that, over time, results in higher inflation. The inflationary outcome arises in the extended model even when the real interest rate on government debt is lower than the economy's growth rate as long as a competing asset with real return higher than that on government debt exists. In other words, the condition 'real interest rate (on government debt) higher than the growth rate' is not a necessary condition for the Sargent-Wallace condition. In fact, the Sargent-Wallace condition may still hold even if the return on equities is initially lower than the economy's growth rate if the increased bond financing crowds-out private investment, raising the real return on investment projects and inducing a commensurate rise in government borrowing costs, higher interest payments, more bond financing, and further crowding out of private investment initiating a vicious circle (Bhattacharya, Guzman and Smith, 1998 and Bhattacharya and Haslag, 1999). 4.65 An implicit assumption in the Sargent-Wallace model as well as the extended model is that fiscal policy dominates the monetary policy; this, however, may not be the case as the fiscal authority may have to yield since the latter may not have the purchasing power to carry out its planned spending (McCallum, 1999). Empirical evidence for Ireland and, to some extent, Italy suggests that it is the fiscal policy that adjusts to monetary policy rather than the other way round. A similar qualitative conclusion, based on trends in default risk (low) and inflation risk premia (declining) of public debt, has been documented for European countries (Winckler et al, op cit). The evidence in favour of fiscal policy adjustment appears plausible in the current era of increasing central bank independence. 4.66 A critical issue, therefore, is the financing of the deficit by the monetary authority and the implications for growth and inflation. In the Indian context, with the widening of fiscal deficits during the 1980s, a large part of the financing burden was borne by the Reserve Bank. The net RBI credit to Government increased at an annual average of almost Rs. 6000 crore during the 1980s, around 7-times its annual average during the 1970s (Chart IV.30). 4.67 As a result, the ratio of net RBI credit to the gross fiscal deficit which had averaged 26 per cent during the 1970s increased to 32 per cent during the 1980s. During the 1990s, it fell, averaging 12 per cent, reflecting policy efforts to reduce the reliance on the Reserve Bank. Similarly, the ratio of the Centre’s monetised deficit to GDP almost doubled during the 1980s to 2.1 per cent from 1.1 per cent during the 1970s before moderating to 0.7 per cent during the 1990s (Chart IV.31). 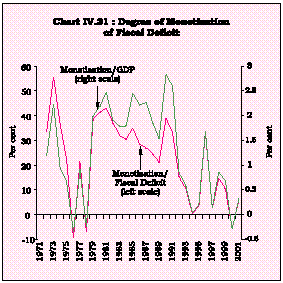
|
4.68 Alongside the growing market orientation of monetary policy, the net RBI credit to Government is increasingly reflecting, besides credit extended to Government, the impact of the Reserve Bank’s open market operations (OMO) including liquidity adjustment facility (LAF), etc. involving change in ownership of debt owned by Government without any bearing on the primary financing of the fiscal deficit. A more relevant measure of monetisation is the Reserve Bank's primary support to the government's borrowing programme (including primary placements/ devolvement of Government securities, rupee coins, ways and means advances (WMA) netted for changes in cash balances) which accounted for 31 per cent of GFD in 2000-01 as against 6 per cent based on net RBI credit to GFD (Table 4.9). Table 4.9 : Net RBI Credit and RBI Primary Support |
| Year | Fiscal | Net RBI | RBI’s Primary | Monetisation | Monetisation | | | Deficit | Credit to | Support to | Based on | Based on | | | (GFD) | Centre | Government | NRBIC
measure | RBIPS
measure | | | of the Centre
| during the year (NRBIC)
| Borrowings (RBIPS)
|
As per cent of Fiscal Deficit |
| Rupees Crore
|
|
| 1
| 2
| 3
| 4
| 5
| 6
| 1998-99 | 1,13,349 | 11,799 | 39,041 | 10.4 | 34.4 | 1999-2000 | 1,04,717 | -5,587 | 25,682 | -5.3 | 24.5 | 2000-01
| 1,11,972
| 6,705
| 34,943
| 6.0
| 31.2
| Source : RBI (2001) | | | | | |
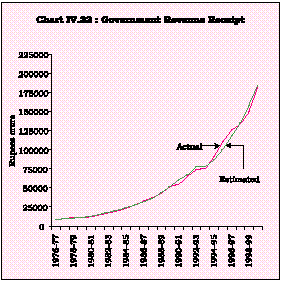
4.69 Based upon these developments and drawing upon the UMA, an important opinion in India is that the degree of monetisation of fiscal deficits in India in the 1990s has been on the lower side (Rakshit, 2000; Venkitaramanan 1995). The strict applicability of the UMA, in the Indian context, is in doubt given that real interest rates on government debt have been lower than that the economy's growth rate. Revisiting Moorthy et al (2000), it is observed that bond financing vis-a-vis money financing may increase real interest rates but it is still beneficial as it reduces inflation and, hence, increases long-run welfare. Moreover, the study also found that private capital formation has surged since liberalisation, contradicting the view that bond-financing crowds out private investment. The relationship between fiscal deficits and their financing pattern was analysed to find the optimal degree of monetisation of fiscal deficit for the Union Budget, 2001-02 by Rao (2000). The results indicated that the optimal monetisation for the year 2001-02 is about 40 per cent of the budgeted fiscal deficit. 4.70 Against this background, this section undertakes an empirical exercise to assess the inflationary impact of monetary-fiscal dynamics through a small model with the specific objective of examining optimal monetisation in the Indian context. For this purpose, the price dynamics are at the core of the model as government receipts and non-interest expenditures may respond asymmetrically to inflation on account of the Tanzi-Olivera effect (Olivera, 1967; Aghevli and Khan, 1978 and Tanzi, 1988). At the same time, movements in interest rates determine the government's interest burden. The model, therefore, also estimates the behaviour of interest rates and inflation in terms of their determinants. The model has been estimated over the period 1971-72 to 1999-2000. 4.71 Revenue receipts and non-interest Government expenditures of the Central Government increase with real output as well as prices10. The estimated equations track the actual receipts and expenditures fairly well (Charts IV.32 and IV.33). The crucial issue for the present exercise is the response to inflation. In the short-run, the elasticity of government (non-interest) expenditure with respect to prices is 0.35 while that of revenue receipts is higher at 0.47. Inflation, therefore, improves the primary fiscal balance in the short-run. However, the long-run estimates of elasticities present a different picture. The long-run elasticity of (non-interest) expenditure with respect to prices is estimated at 1.06 while that of revenue receipts is estimated to be lower at 0.81. Thus, inflation has an adverse impact on public finances in the long-run, widening the primary fiscal balance. 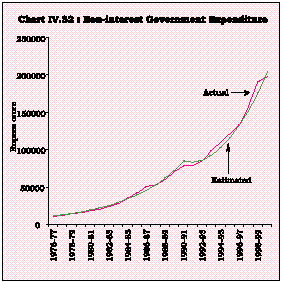
|
|
4.72 The money supply influences both interest rate and prices. The interest rates are estimated from the inverted real money demand equation11 and the estimates show that increased money supply initially reduces the interest rate (the liquidity effect) but increases the interest rate in the next period as inflationary expectations build up. A current period increase of one per cent in real money leads to a decline of 18 basis points in the nominal interest rate in the current period and an increase of 11 basis points in the next period interest rate. 4.73 As regards the prices-money supply relationship, the estimates indicate that the short-run elasticity of price with respect to money (M3) is 0.3, i.e., an increase of 10 percent in money supply increases prices by 3 per cent in the same period. Over time, the inflationary process builds up, with the long-run estimated elasticity almost unity, i.e., a 10 per cent increase in money supply leads to an increase in inflation of equal magnitude12 . The estimated equation mimics the actual price behaviour closely (Chart IV.34). Model Simulation 4.74 In the model, the variations in the degree of monetisation are reflected in changes in net RBI credit to Government (DRBIC), in turn, impacting on reserve money and through the money multiplier on the money supply. The increase in the money supply, following higher monetisation, increases inflation, widening the primary fiscal balance. On the other hand, the liquidity effect of higher money supply reduces the government's interest outgo, partly offset by an increase in the next period. An additional channel in the model influences the interest outgo on account of compositional shifts in ownership of government debt due to increased monetisation. The proportion of government debt held by the monetary authority increases while that held by the public declines. As a result, while interest payments to the debt held by the public fall, those to the monetary authority increase; the latter is reflected in higher net income of the central bank and finds a way back to the fiscal authority in the form of higher dividends. The overall impact of the compositional shift in favour of central bank would be a reduction in net interest burden of the government. 4.75 The model was simulated and alternative scenarios of monetisation of the fiscal deficit were analysed and the inflationary outcome was examined. The results show that an increase in monetisation results in higher inflation. The concept of optimal level of monetisation has been operationalised in this section as the level of monetisation that keeps the inflation rate close to its threshold. This estimate of the threshold inflation for India is 5 per cent (see Chapter V). The empirical exercise, therefore, attempted to identify the degree of monetisation that keeps the inflation rate close to 5 per cent. The simulations suggest that optimal degree of monetisation has been varying over time, with monetisation of more than 40 per cent as well as less than 10 per cent being clearly sub-optimal. The former leads to inflation above the threshold while the latter leads to inflation lower than the threshold. The optimal degree of monetisation appears to have been around 30 per cent for most of the period, with a decline in the second half of the 1990s. At present, the optimal monetisation appears to be in the range of 20-25 per cent of fiscal deficit (Chart IV.35). The decline in the optimal level of monetisation may be reflecting structural changes in the economy and policy efforts to widen and deepen the financial markets to enable the absorption of government debt. 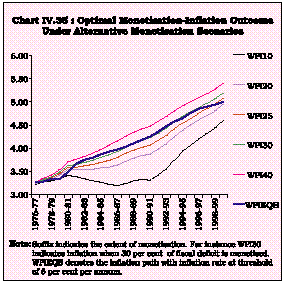
|
VI. CONCLUDING OBSERVATIONS 4.76 Against the backdrop of the current deceleration, this Chapter examined the role of fiscal policy in reviving growth. The decomposition of fiscal deficits into structural and cyclical components revealed that the fiscal deficits in India have been predominantly structural; the cyclical component has been almost negligible, suggesting that discretionary policy has an important role to play in cyclical swings. In this context, the dynamics between government spending and private sector behaviour show that raising public sector consumption to boost aggregate demand in the economy crowds out private consumption. The alternative of raising public sector capital expenditure in manufacturing also crowds out private investment. It is only the public sector capital expenditure in infrastructure sectors that crowds in private investment, a result consistent with endogenous growth theory. At the same time, the enlarged fiscal deficit financing crowds out private investment. The results, therefore, suggest the need for a restructuring of the composition of government expenditure while containing fiscal deficit for the beneficial effect of government's infrastructure investment to be realised. 4.77 On the size of public debt, the results indicate that the public debt continues to exhibit signs of unsustainability. The empirical examination of the issue of appropriate level of monetisation of fiscal deficits indicate that the optimal degree of monetisation appears to be in the range of 20-25 per cent.
1 Let Y and Y* denote actual and potential output; and, let T and G denote revenues and non-interest expenditures, then, the cyclical balance (CB) is estimated as: CB = (T/Y)[1-(Y*/Y)a-1] - (G/Y)[1-(Y*/Y)b-1], where, a and b are estimates of elasticities of tax revenues and non-interest expenditures with respect to actual output.2 | Log DT =-1.58 +0.53 Log YP +0.01 YC(-1) +0.44 Log DT(-1) + 0.16 D2 |
| | (-3.1) | (4.2) | (2.4) | (3.4) | | (2.8) |
| | R2 = 0.996, Durbin’s h = -0.4, | | | |
| | where, DT is direct taxes, YP is trend (nominal) output, YC is cyclical output (in per cent), D2 is dummy for the 1990s. |
| | | | | | 3 | Log IT = -4.2 + 1.18 Log YP + 0.006 YC(-1) - 0.25 D2 - 0.22 D3 |
| | (-20.2) | (67.2) | (1.8) | (-5.9) | (-5.1) | |
| | R2 = 0.998, D-W Statistic = 1.6 | | | | | | where, IT is indirect taxes and D2 and D3 are dummies for the 1990s |
4 | Log GFC = -1.36 + 0.42 Log YP + 0.63 Log GFC(-1) - 0.07 D2 |
| | R2 = 0.999, Durbin’s h = 1.6, | | | |
| | where, GFC is government final consumption expenditure. |
| | | | | | 5 | Log CMF = -3.56 + 0.96 Log YP + 0.04 YC(-1) - 0.58 D1 |
| | R2 = 0.93, D-W Statistic = 1.6, | | | |
| | where, CMF is public sector investment in manufacturing. |
6 | Log CINF = 4.35 + 0.53 Log YP | | | | | |
| | R2 = 0.997, D-W Statistic = 2.2, | | | | | |
| | where, CINF is public sector investment in infrastructure. | | | | | | | | | | 7 | Log CPVT = -0.33 + 0.66 Log YP + 0.01 YC - 0.01 YC(-1) -0.07 Log DT + 0.08 Log TRA - 0.06 Log TRA(-1) + 0.04 Log GFC |
| | (-0.8) | (4.7) | (12.2) | (-3.8) | (-1.7) | (2.3) | (-1.7) | (0.4) |
| | - 0.25 Log GFC(-1) + 0.57 Log CPVT(-1) + 0.03 DUM 97 | | | |
| | R2 = 0.999. Durbin’s h = 1.2 | | | | | |
Where, CPVT is private consumption expenditure, TRA is non-interest transfer payment, GFC is government final | consumption expenditure and DUM97 is dummy for 1997-98. |
8 | Log IPVT = -3.4 + 0.94 Log YP - 0.12 Log CMF(-1) + 0.32 Log CINF(-1) - 0.30 D LogFD(-1) + 0.24 DUM75 |
| | (-8.1) | (7.6) | (-2.3) | (2.5) | (-2.6) | (3.0) |
| | R2 = 0.997, D-W Statistic = 2.2, | | | | |
| | Where, IPVT is private investment, FD is fiscal deficit and DUM75 is dummy for 1975-76. | |
9 The ADF test-statistic at -2.37 was significant at 1 percent. 10 Log GE = -3.53 + 0.43 Log GDP + 0.35 Log WPI + 0.67 Log GE(-1) - 0.16 Dummy9299 |
| | (-1.6) | (1.9) | (2.3) | (6.7) | (-2.8) |
R2 = .997 | Durbin’s h = -1.3 | | | |
where, GE is Non-interest government expenditure, GDP is real GDP, WPI is Wholesale price index. |
| | | | | | Log TX = -8.7 + 0.97 Log GDP + 0.47 Log WPI + 0.42 Log TX(-1) - 0.14 Dummy9499 |
| | (-3.8) | (4.2) | (4.0) | (3.8) | (-3.6) |
R2= .998 | Durbin’s h = -0.3, | | | | where, TX is government revenues. | | | | | | | 11 | | | | |
LOG RM3 = -7.71 - 0.055 R + 0.60 LOG RM3(-1) +0.84 GDP | |
R2 = 0.997 Durbin’s h = 1.2 | | | |
where, RM3 is real broad money supply, R is interest rate. | |
12 | LOG WPI = 3.57 + 0.27 LOG M3 - 0.42 LOG GDP + 0.72 LOG WPI(-1) + 0.14 DUM75 + 0.07 DUM82 |
| | (3.0) | (5.0) | (-3.5) | (9.2) | (6.5) | (2.4) |
| | R2 = 0.998 | Durbin’s h = 0.6, | | | |
| | where, M3 is nominal broad money, DUM75 and DUM82 are dummies for 1973-75 and 1981-82. |
|