Bank credit growth moderated across constituent bank groups during the second half of 2019-20. The profitability ratios of Scheduled Commercial Banks (SCBs), although better in FY 2019-20 relative to FY 2018-19, have declined in the second half of FY 2019-20 and the outlook is weighed down by the moratorium’s implications for loan classification. Macro-stress tests for credit risk indicate that under the baseline scenario, SCBs’ gross non-performing assets (GNPA) ratio may increase from 8.5 per cent in March 2020 to 12.5 per cent (14.7 per cent in a very severe stress scenario) by March 2021, whereas the system-level1 capital to risk-weighted assets ratio (CRAR) may fall from 14.6 per cent in March 2020 to 13.3 per cent (11.8 per cent in a very severe stress scenario) by March 2021. Banks' exposure to NBFCs/HFCs has increased. Contagion risks through financial networks have moderated due to higher capital buffers as also the shrinking interbank market. Introduction 2.1 The deterioration in the macroeconomic and financial environment since the December 2019 FSR, globally and domestically, impinged on credit demand, asset quality, capital adequacy and profitability of scheduled commercial banks which are bracing up for the fuller impact of COVID-19. Stress on non-banking financial companies and co-operative banks, that had mounted in the wake of credit events in 2019, has been exacerbated by risk aversion and flight to safety among banks, leading to funding constraints and differentiation in market access. The outlook remains clouded with considerable uncertainty as the pandemic takes its toll. In the interregnum, however, financial markets have stabilised in response to recent policy measures and liquidity stress experienced by several financial intermediaries has eased. 2.2 Against this backdrop, this chapter sets out to evaluate the soundness and resilience of banks and NBFCs. Section II.1 presents an assessment of SCBs’ credit performance, asset quality, capital adequacy and risks. It also evaluates their resilience against macroeconomic shocks through stress tests for credit risk, which are supplemented by (a) bank level single factor sensitivity analysis for credit, interest rate, liquidity, concentration and equity price risks; and (b) bottom-up stress tests for capital and liquidity as well as derivatives portfolios. Section II.2 undertakes an examination of recent performance of scheduled urban cooperative banks (SUCBs) and the results of stress tests for credit and liquidity risks. Section II.3 discusses the major financial parameters of NBFCs, the recent disruptions in the sector and the results of stress tests at system level as well as for individual NBFCs. An analysis of the ratings distribution of the underlying assets for special mention accounts (SMAs) is presented in section II.4. The concluding section II.5 presents a detailed analysis of the network structure and connectivity of the Indian financial system, including the inter-bank market, exposure of / to various groups of financial entities and the results of contagion analysis under adverse scenarios. II.1 Scheduled Commercial Banks2 2.3 The recent period is marked by a structural shift in the performance of India’s commercial banking sector. A reduction in the overhang of stressed assets continued up to the early part of 2019-20, and fresh slippages were arrested, despite a prolonged slowdown in global and domestic growth impinging on credit demand. Towards the close of the financial year, these slow moving improvements were overwhelmed and halted by the outbreak of COVID-19. The regulatory dispensations that the pandemic has necessitated in terms of the moratorium on loan instalments and deferment of interest payments may have implications for the financial health of SCBs, going forward. II.1.1 Performance – Assets and Earnings 2.4 Credit growth (y-o-y) of SCBs, which had considerably weakened during the first half of 2019-20, slid down further to 5.9 per cent by March 2020 (Chart 2.1) and remained muted up to early June 2020. This moderation was broad-based across all bank groups. Year-on-year (y-o-y) deposit growth also moderated during the second half of 2019-20, mainly on account of PVBs (Chart 2.1 a), although a pick-up has occurred in the early months of 2020-21, reflecting COVID-19 related precautionary savings behaviour. Commercial banks’ earnings before provisions and taxes (EBPT) were supported by increases in other operating income (OOI) and some moderation in the growth of operating expenses (Chart 2.1 b). Net interest income (NII) slowed down marginally, taking down net interest margins (NIM) to the September 2019 level (Chart 2.1 c). Profitability ratios, viz., return on assets (RoA) and return on equity (RoE), declined in the second half of FY 2019-20 across all bank groups (Chart 2.1 d and Chart 2.1 e). 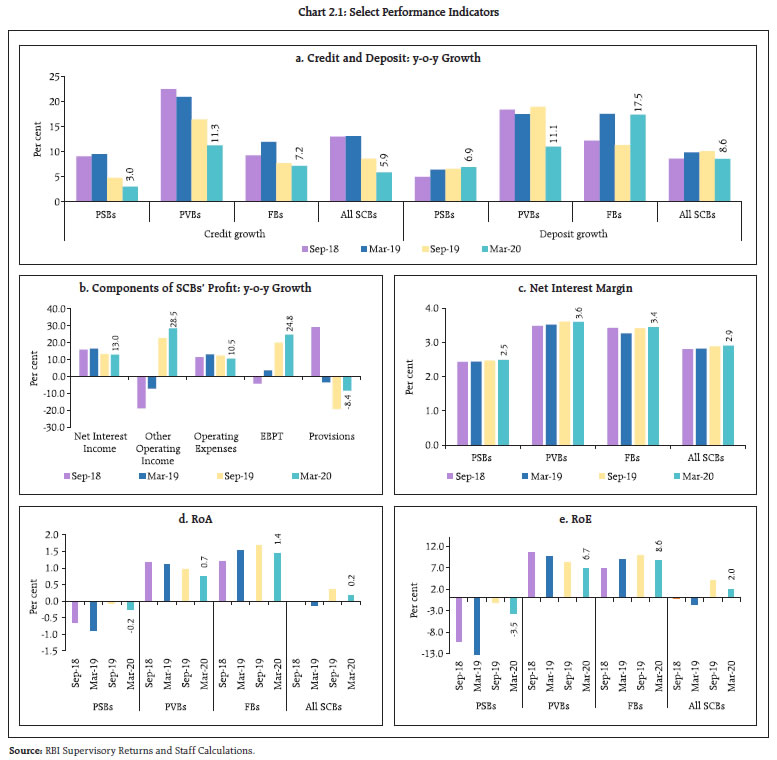 II.1.2 Asset Quality and Capital Adequacy 2.5 The gross and net non-performing asset (GNPA and NNPA) ratios of all SCBs which had reached 9.3 per cent and 3.7 per cent in September 2019 have come down to 8.5 per cent and 3.0 per cent in March 2020 (Chart 2.2 a & b). This is evident from the receding quarterly slippage ratios (calculated as new accretion to NPAs in the quarter as a ratio to the standard advances at the beginning of the quarter) across all bank groups (Chart 2.2 c). As a result, the provision coverage ratio (PCR) of SCBs improved to 65.4 per cent in March 2020 from 61.6 per cent in September 2019 (Chart 2.2 d). NPA provisions have been decelerating for PSBs and FBs since March 2019 (Chart 2.2 f). 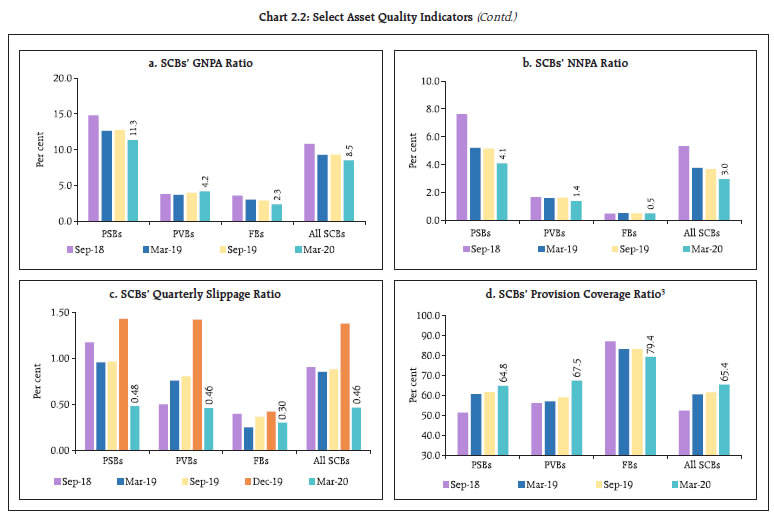
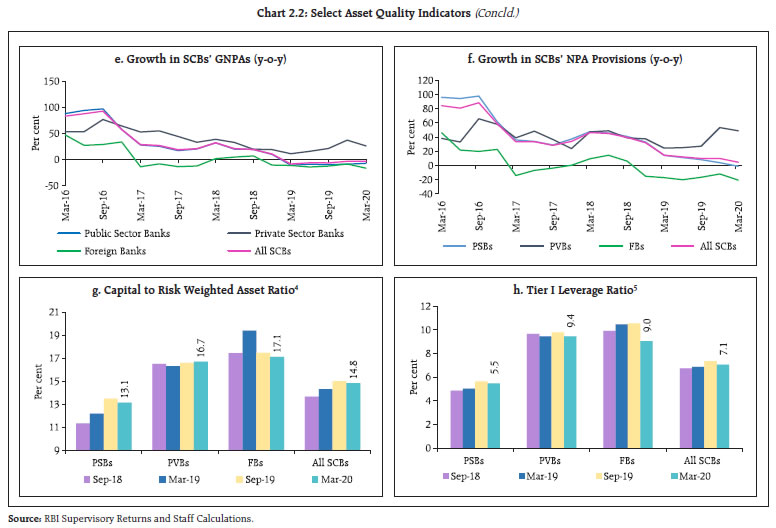 2.6 The capital to risk-weighted assets ratio (CRAR) of SCBs edged down to 14.8 per cent in March 2020, mainly due to reduction of CRARs of the PSBs. Their RoA continued to be negative as a group, notwithstanding lukewarm credit growth and moderate slippages. Among bank groups, PVBs recorded a marginal rise in CRAR whereas the ratio weakened for PSBs and FBs (Chart 2.2 g). Tier I leverage ratio contracted in March 2020 for all bank groups (Chart 2.2 h). II.1.3 Sectoral Asset Quality 2.7 Sectorally, the quality of bank loans to services sector worsened in March 2020. The GNPA ratio of the retail loan sector also edged up (Chart 2.3 a). Among major sub-sectors within industry, GNPA ratios in respect of construction and gems and jewellery sectors swelled up in March 2020 (Chart 2.3 b). On the other hand, the infrastructure sector (with a share of 36.2 per cent in bank credit to the industrial sector), basic metals (11.3 per cent) and electricity (17.5 per cent) have shown a perceptible decline in GNPA ratios. This has implications for aggregate asset quality of the banking sector. II.1.4 Credit Quality of Large Borrowers 2.8 Large borrowers6 accounted for 51.3 per cent and 78.3 per cent of the aggregate loan portfolio and GNPAs, respectively, of SCBs in March 2020 (Chart 2.4 a). Both these shares have declined since March 2018 implying that, on an incremental basis, credit and NPA accretions are occurring in the small borrower category in the recent period. The outstanding amount under SMA7-0, SMA-1, SMA-2 and restructured standard loan categories and NPAs of large borrowers declined during the quarter ending March 2020 (Chart 2.4 b). GNPA ratios of large borrowers edged down during the quarter across all banks, except for PVBs (Chart 2.4 c). SMA-2 ratios of large borrowers plunged across all bank groups, except for foreign banks (Chart 2.4 d). At the same time, the share of loss assets has been rising within the funded amount for large borrowers (Chart 2.4 e). 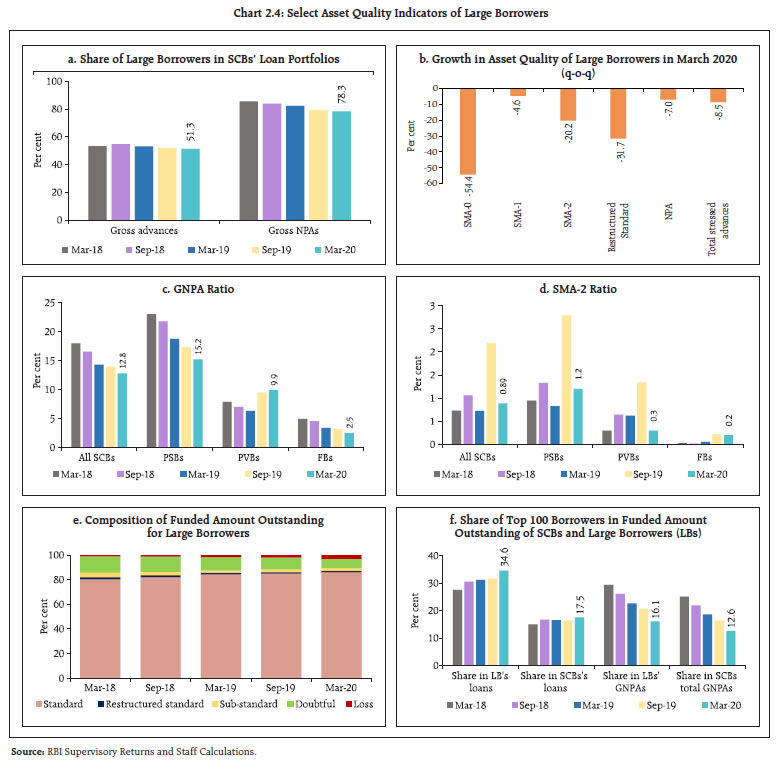 2.9 The top 100 borrowers accounted for 17.5 per cent of gross advances, but only 12.6 per cent of GNPAs of SCBs in March 2020 (Chart 2.4 f). Since the SMA ratios factor in the COVID-19 related regulatory moratorium, a separate analysis to assess the quality of the SMA assets by examining the ratings distribution is presented in Section II.4. II.1.5 Risks 2.10 The banking stability indicator (BSI)8 shows that, among the five dimensions considered for assessing the changes in underlying conditions and risk factors, SCBs have recorded deterioration in soundness, liquidity and efficiency in March 2020 as compared with the September 2019 position, whereas asset quality and profitability showed marginal improvement (Chart 2.5). Nevertheless, no comfort can be drawn on this front since any loss of income of banks during COVID-19 will be visible only from the first quarter of 2020-21. II.1.6 Resilience – Macro Stress Tests 2.11 The resilience of Indian banking in the face of macroeconomic shocks was tested through macro-stress tests which attempt to assess the impact of cumulative shocks on SCBs’ balance sheet and generate projections of GNPA ratios and CRARs over a one year horizon under a baseline and three adverse9 (medium, severe and very severe) scenarios. The baseline scenario is derived from the forecasted values of macroeconomic variables10. As the asset classification in March 2020 could have been influenced by the regulatory moratorium in the face of the COVID-19 pandemic, the projections for this exercise are built up using data from June 2011 up to the quarter ended December 2019 (instead of March 2020). The medium, severe and very severe adverse scenarios have been obtained by applying 0.25 to one standard deviation (SD) shocks, 1.25 to two SD shocks and 2.25 to three SD shocks, respectively, to each of the macroeconomic variables, increasing the shocks by 25 basis points in each subsequent projection quarter (Chart 2.6). 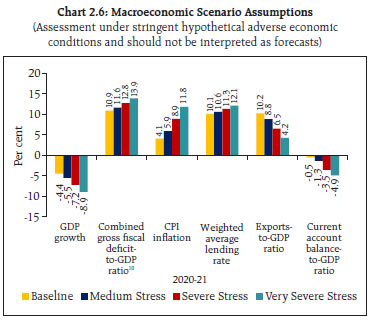 2.12 Given the fact that impact of moratorium is still uncertain and evolving, the exact nature of how the same will play out on the quality of banking assets is difficult to ascertain accurately. Therefore, this will only be ascertainable with passage of time, and outcomes would be disseminated in the forthcoming publications of RBI, from time to time. 2.13 The stress tests indicate that the GNPA ratio of all SCBs may increase from 8.5 per cent in March 2020 to 12.5 per cent by March 2021 under the baseline scenario (Chart 2.7). If the macroeconomic environment worsens further, the ratio may escalate to 14.7 per cent under the very severely stressed scenario. 2.14 Among the bank groups, PSBs’ GNPA ratio of 11.3 per cent in March 2020 may increase to 15.2 per cent by March 2021 under the baseline scenario; the GNPA ratio of PVBs and FBs may increase from 4.2 per cent and 2.3 per cent to 7.3 per cent and 3.9 per cent, respectively, over the same period. 2.15 The system level CRAR is projected to drop from 14.6 per cent in March 2020 to 13.3 per cent in March 2021 under the baseline scenario and to 11.8 per cent under the very severe stress scenario (Chart 2.8 a). 2.16 Stress test results indicate that, five banks may fail to meet the minimum capital level by March 2021 in a very severe stress scenario. This, however, does not take into account the mergers or any further recapitalization, which will further increase systemic resilience (Chart 2.8 b). 2.17 The common equity Tier I (CET 1) capital ratio of SCBs may decline from 11.7 per cent in March 2020 to 10.7 per cent under the baseline scenario and to 9.4 per cent under the very severe stress scenario in March 2021 (Chart 2.9 a). Furthermore, under these conditions, three banks may fail to meet the minimum regulatory CET 1 capital ratio of 5.5 per cent by March 2021 (Chart 2.9 b). 2.18 While the regulatory moratorium may be holding back some stress, the industry-wise composition of good quality loans (i.e., standard advances which have not yet turned into SMA; and SMA-0 loans) of PSBs and PVBs reveals that some of the industries with higher share of such loans across bank groups are severely affected by the COVID-19 crisis (Table 2.1). | Table 2.1: Top 10 Industries with High Share of Good Quality Assets | | Public Sector Banks | Private Sector Banks | | Industry | Share of good quality loans of the industry as share of total good quality loans as on March 2020 | Industry | Share of good quality loans of the industry as share of total good quality loans as on March 2020 | | NBFCs- general purpose loans | 10.4 | NBFCs- general purpose loans | 7.9 | | Generation of Electricity | 9.8 | Generation of Electricity | 6.0 | | NBFCs- in the housing sector | 7.7 | Real Estate Activities | 5.5 | | Developmental Financial Institutions | 4.6 | Manufacturing of Basic Iron and Steel | 4.1 | | Manufacturing of Refined Petroleum Products | 4.6 | NBFCs- in the housing sector | 3.6 | | Manufacturing of Basic Iron and Steel | 4.4 | Construction/ Maintenance of Roads | 2.4 | | Construction/Maintenance of Roads | 3.9 | Basic Telecom Services | 2.4 | | Public Utility Services through Consumer Coops. | 3.3 | Manufacturing of Refined Petroleum Products | 2.4 | | Collection and Distribution of Electricity | 2.5 | Manufacturing of Basic Non-ferrous Metals | 1.7 | | Real Estate Activities | 2.3 | Manufacturing of Cement, Lime and Plaster | 1.7 | | Source: RBI Supervisory Returns and Staff Calculations. | II.1.7 Sensitivity Analysis11 2.19 In order to assess vulnerabilities of SCBs under various scenarios12, a number of single-factor sensitivity stress tests13 were carried out on quarterly data from March 2011 up to March 2020 to simulate credit, interest rate, equity prices and liquidity risks materialising under a top-down14 sensitivity analysis. a. Credit Risk 2.20 Under a very severe shock of 3 SD15 to the system level GNPA (i.e., if the GNPA ratio of 53 select SCBs moves up from 8.6 per cent to 17.8 per cent), the system-level CRAR would decline from 14.6 per cent to 9.3 per cent and the Tier-1 capital ratio would decline from 12.5 per cent to 7.6 per cent. The impairment in capital at the system level could thus be about 41.8 per cent. The results of reverse stress test show that it requires a shock of 3.26 SD to bring down the system-level CRAR to 9 per cent. 2.21 Bank-level stress test results show that 23 banks16 with a share of 64.5 per cent in SCBs’ total assets might fail to maintain the required CRAR under the scenario of 3 SD shock to the GNPA ratio (Chart 2.10). In such an extreme shock scenario, the CRAR of all the 18 PSBs is likely to go down to 9 per cent. 2.22 Under the scenario of 3 SD shock to the GNPA ratio, CRAR would fall below 7 per cent for as many as 20 banks (Chart 2.11) which would dominate the list of banks witnessing large capital erosion. 2.23 15 and 20 banks would record over six percentage points decline in CRAR under 2 SD and 3 SD shocks, respectively (Chart 2.12). b. Credit Concentration Risk 2.24 Stress tests on banks’ credit concentration with respect to top individual borrowers according to their stressed advances showed that, in the extreme scenario of the top three individual borrowers failing to repay17, the impact was significant for three banks, which together account for 2.7 per cent of the total assets of SCBs. Under the assumed scenarios of failure of the top 1, top 2 and top 3 borrowers, the impact on CRAR at the system level would be 34, 51 and 63 basis points, respectively (Chart 2.13). 2.25 Stress tests on banks’ credit concentration, considering top individual borrowers according to their standard exposures showed that in the extreme scenario of top three individual borrowers failing to repay18, the impact was significant for two banks (Chart 2.14). Under the assumed scenario of default by all the top three individual borrowers, CRAR at the system level would go down by 140 basis points. 2.26 Under the scenarios of default by group borrowers in the banks’ credit exposure concentration, stress tests reveal that the system level capital losses19 could be around (a) 6.0 per cent, if the top-most group borrower defaults and (b) 10.9 per cent, if the top two group borrowers default. Two banks will not be able to maintain their CRAR level at 9 per cent if top three group borrowers default (Table 2.2). | Table 2.2: Credit Concentration Risk: Group Borrowers’ Exposure | | Shocks | System Level | Bank Level | | CRAR | Core CRAR | NPA Ratio | Losses as % of Capital | Impacted Banks (CRAR < 9%) | | Baseline (Before Shock) | 14.6 | 12.5 | 8.6 | --- | No. of Banks | Share in Total Assets of SCBs (in %) | | Shock 1 | The top 1 group borrower fails to repay | 13.8 | 11.7 | 11.9 | 6.0 | 1 | 0.2 | | Shock 2 | The top 2 group borrowers fail to repay | 13.1 | 11.0 | 14.7 | 10.9 | 1 | 0.2 | | Shock 3 | The top 3 group borrowers fail to repay | 12.6 | 10.4 | 17.0 | 15.0 | 2 | 1.1 | Note: For a system of select 53 SCBs.
Source: RBI Supervisory Returns and Staff Calculations. | c. Sectoral Credit Risk 2.27 Sensitivity analysis of bank-wise vulnerability due to their exposures to certain sub-sectors (shocks based on subsector-wise historical SDs of GNPA ratio) reveals varying magnitude of increase in the GNPAs of banks in different sub-sectors (Table 2.3). 2.28 The resulting losses due to increased provisioning and reduced income were taken into account to calculate banks’ stressed CRAR and risk weighted assets (RWAs). A 2SD shock to the infrastructure – energy segment and basic metals and metal products segment would reduce the system level CRAR by 20 bps and around 17 bps, respectively (Table 2.3). Although the impact of even a 3 SD shock in various sectors is seen to be limited, the cumulative impact may be sizable for a few banks. Table 2.3: Decline in System Level CRAR
(basis points, in descending order) | | | 1SD | 2SD | 3SD | | Infrastructure - Energy (55%) | 10 | 20 | 29 | | Basic Metal and Metal Products (74%) | 10 | 17 | 22 | | All Engineering (38%) | 3 | 5 | 7 | | Infrastructure - Transport (29%) | 3 | 6 | 6 | | Textiles (29%) | 2 | 4 | 5 | | Infrastructure - Communication (78%) | 2 | 3 | 5 | | Construction (27%) | 2 | 3 | 5 | | Food Processing (25%) | 1 | 3 | 4 | | Vehicles, Vehicle Parts and Transport Equipment (52%) | 1 | 2 | 3 | | Gems and Jewellery (24%) | 1 | 1 | 2 | Note: For a system of select 53 banks.
Note: Numbers in parentheses represent the growth in GNPAs due to 1SD shock to the subsector’s GNPA ratio.
Source: RBI Supervisory Returns and Staff Calculations. | d. Interest Rate Risk 2.29 The market value of the portfolio subject to fair value for a sample of 52 SCBs accounting for 98 per cent of the total assets of the banking system stood at ₹17 lakh crore as on end-March 2020 (Chart 2.15). About 91.7 per cent of the investments subjected to fair value were classified as available for sale (AFS). 2.30 The sensitivity (PV0120) of the AFS portfolio of PSBs and PVBs declined vis-a-vis the December 2019 position, whereas it marginally increased for FBs. In terms of PV01 curve positioning, the tenor-wise distribution indicates continuing bias of PSBs in favour of 5-10 year tenor and a marginal decrease in the proportion of PV01 in the 1-5 year bucket with a corresponding marginal increase in the longer maturity tenors. PVBs and FBs, however, continue to place their bets in the 1-5 year tenor bucket, though the proportion was lower for PVBs in this case (Table 2.4). | Table 2.4: Tenor-wise PV01 Distribution of AFS Portfolio | | (per cent) | | | Total
(in ₹ crores) | < 1 year | 1 year-5 year | 5 year-10 year | > 10 years | | PSBs | 212.4 (255.8) | 6.4 (5.8) | 25.4 (29.3) | 54.4 (51.8) | 13.9 (13.1) | | PVBs | 43.7 (46.4) | 20.0 (18.2) | 49.2 (51.7) | 25.0 (25.2) | 5.7 (5.0) | | FBs | 43.9 (41.1) | 6.4 (8.3) | 64.2 (60.5) | 10.1 (9.9) | 19.4 (21.3) | Note: Values in the brackets indicate December 2019 figures.
Source: Individual Bank Submissions and Staff Calculations. | 2.31 Softening interest rates and the resultant impact on yield curve movements across the tenors led to surge in profit booking by banks (Chart 2.16). PSBs and PVBs continued to book profits on securities trading for the quarter ended March 2020, while FBs reversed losses in the previous quarter (Table 2.5).
| Table 2.5: OOI - Profit/(loss) on Securities Trading | | (₹ crore) | | | 30-Jun-19 | 30-Sep-19 | 31-Dec-19 | 31-Mar-20 | | Public Sector Banks | 3912.66 | 8993.73 | 4184.28 | 8375.85 | | Private Sector Banks | 2545.25 | 2590.44 | 2291.46 | 4110.63 | | Foreign Bank Group | 225.21 | 926.75 | -58.74 | 223.53 | | Source: RBI Supervisory Returns and Staff Calculations. | 2.32 PVBs and FBs continue to have significant interest rate exposure in their held for trading (HFT) portfolios relative to their AFS book. The PV01 tenor-wise distribution for PVBs shows dominant exposure in the 1-5-year tenor, similar to AFS positioning, while FBs seem to have increased PV01 sensitivity in the 5-10 year tenor (Table 2.6). | Table 2.6: Tenor-wise PV01 Distribution of HFT portfolio | | (per cent) | | | Total (in ₹ crore) | < 1 year | 1 year- 5 year | 5 year- 10 year | >10 years | | PSBs | 0.2 (1.2) | 4.8 (1.1) | 17.8 (43.4) | 71.0 (49.9) | 6.5 (5.6) | | PVBs | 11.0 (7.7) | 11.3 (6.7) | 64.9 (77.8) | 19.3 (0.4) | 4.5 (15.0) | | FBs | 18.7 (10.2) | 3.7 (4.7) | 33.2 (48.0) | 33.6 (23.6) | 29.5 (23.7) | Note: Values in the brackets indicate December 2019 figures
Source: Individual Bank Submissions and Staff Calculations. | 2.33 Any hardening of interest rates would depress investment income under the AFS and HFT categories (direct impact). A parallel upward shift of 2.5 percentage points in the yield curve will lower the CRAR by about 69 basis points at the system level while it would reduce system level capital by 5.5 per cent (Table 2.7). Table 2.7: Interest Rate Risk – Bank groups - Shocks and Impacts
(under shock of 250 basis points parallel upward shift of the INR yield curve) | | | Public Sector Banks | Private Sector Banks | Foreign Banks | All SCBs | | AFS | HFT | AFS | HFT | AFS | HFT | AFS | HFT | | Modified Duration | 2.3 | 2.7 | 1.2 | 1.5 | 1.5 | 2.9 | 1.9 | 2.1 | | Reduction in CRAR (bps) | 82 | 32 | 138 | 69 | | Source: Individual Bank Submissions and Staff Calculations. | e. Equity Price Risk 2.34 An analysis of the impact of a fall in equity prices on bank capital and profits indicates that the system-level CRAR would decline by 57 basis points in the baseline under a 55 per cent drop in equity prices (Chart 2.17). The impact of a drop in equity prices for the overall system is limited as banks typically have a low proportion of capital market exposures on their balance sheets due to regulatory limits. f. Liquidity Risk: Impact of a Deposit Run-off 2.35 The liquidity risk analysis aims to capture the impact of a possible run on deposits and increased demand for unutilised portions of sanctioned / committed / guaranteed credit lines. Banks, in general, may be in a position to withstand liquidity shocks with their high-quality liquid assets (HQLAs)21. 2.36 Under the assumed scenarios, there would be increased withdrawals of un-insured deposits22 and a simultaneous increase in usage of the unutilised portions of sanctioned working capital limits as well as utilisation of credit commitments and guarantees extended by banks to their customers. Using their HQLAs required for meeting day-to-day liquidity requirements, 50 out of the 53 banks in the sample will remain resilient in a scenario of sudden and unexpected withdrawals of around 15 per cent of deposits along with the utilisation of 75 per cent of their committed credit lines (Chart 2.18). II.1.8 Bottom-up Stress Tests - Credit, Market and Liquidity Risk 2.37 The bottom-up stress tests (sensitivity analyses) carried out for select banks23 (sensitivity analyses) with March 31, 2020 as the reference date, also testified to the banks’ general resilience to different kinds of shocks. While confirming the top-down stress tests results in general, the bottom-up stress tests show that, owing to better capitalisation of PSBs, average CRAR remains above 9 per cent though some banks may have to contend with stressed CRAR positions falling below the regulatory minimum of 9 per cent (Chart 2.19). 2.38 In certain scenarios, bottom-up stress tests of the impact of liquidity shocks on select banks’ liquid assets ratios24 show that HQLAs enable banks in the sample to sustain pressures from sudden and unexpected withdrawal of deposits by depositors (Chart 2.20). Banks, on an average, have higher liquid asset ratios compared to the exercise carried out based on March 2019 liquid assets. II.1.9 Bottom-up Stress Tests: Derivatives Portfolio 2.39 A series of bottom-up stress tests (sensitivity analyses) on derivative portfolios of select banks25 was conducted with the reference date of March 31, 2020. The banks in the sample were subjected to four separate shocks on interest and foreign exchange rates, where the shocks on interest rates ranged from 100 to 250 basis points, while 20 per cent appreciation/depreciation shock was assumed for exchange rates. The stress tests were carried out for individual shocks. 2.40 The impact of the sharp moves reflected in mark-to-market (MTM) valuation as a proportion to CET 1 capital (Chart 2.21) are mostly muted for individual banks, particularly PSBs and PVBs. Since risks can only be transferred and not eliminated, a thorough assessment of hedging profile of corporates as given in the disclosures would help understand the true extent of risks, going forward. 2.41 The average net impact of interest rate and exchange rate shocks are in the range of 2.5 per cent of the total capital funds and the profit and loss (P&L) effect is almost symmetric in opposite shocks. A rise in domestic interest rates leads to P&L gains and vice versa, implying that the interest rate positions are in the nature of a net short. Similarly, exchange rate shocks in the form of INR depreciation leads to P&L gains and vice versa, implying that the foreign exchange book is positioned to gain from INR depreciation (Chart 2.22). 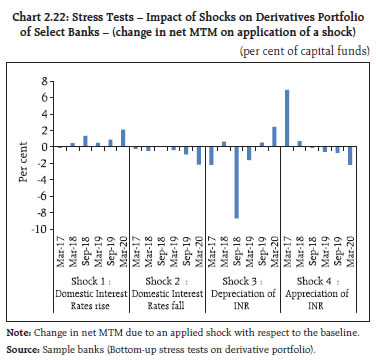 2.42 The battery of stress tests gives plausible scenarios, at the system-level as well as at individual bank level, of the impact of COVID-19 on banks’ balance sheets. In this context, the RBI has instructed banks to assess the impact of COVID-19 under severe but plausible scenarios on their balance sheets, asset quality, liquidity, profitability and capital adequacy for the financial year 2020-21. Banks have also been advised to ensure that such analyses are supplemented with possible mitigating measures, including capital and liquidity planning with the objective of ensuring uninterrupted credit supply to different sectors of the economy. II.2 Scheduled Urban Cooperative Banks 2.43 The performance of scheduled urban cooperative banks (SUCBs) broadly remained stable between September 2019 and March 2020. At the system level26, the CRAR of SUCBs remained at 9.8 per cent for both the quarters. Their GNPAs declined from 10.5 per cent of gross loans and advances to 9.9 per cent and their provision coverage ratios27 increased from 40.9 per cent to 61.4 per cent over this period. SUCBs’ RoAs improved but remained in negative territory in March 2020 at -1.8 per cent as against -3.6 per cent observed in September 2019 whereas liquidity ratios28 remained stable at 34.0 per cent. II.2.1 Stress Test – Credit Risk 2.44 The impact of credit risk shocks on CRAR of SUCBs was simulated under four different scenarios.29 The results show that (i) under a 1 SD shock to GNPAs classified as loss assets, system level CRAR would decline to 9.1 per cent and two SUCBs would fail to achieve the minimum CRAR requirement; in addition to 3 which had CRARs below 9 per cent even before the shock; (ii) under a 2 SD shock to GNPAs classified as sub-standard assets, one additional UCB would fail to achieve the 9 per cent CRAR minimum; and (iii) under a 2 SD shock to GNPAs classified as loss advances, system level CRAR declines to 8.1 per cent and eight more UCBs would fail to maintain the minimum CRAR requirement. II.2.2 Stress Test - Liquidity Risks 2.45 A stress test on liquidity was carried out using two different scenarios of increase in cash outflows in the 1 to 28 day time bucket by i) 50 per cent, and ii) 100 per cent, with cash inflows remaining unchanged. Under the two scenarios, 20 banks and 34 banks, respectively, would face liquidity stress.30 II.3 Non-Banking Financial Companies 2.46 A total of 9,601 NBFCs were registered with the RBI at end-March, 2020 of which 66 were deposit-accepting (NBFCs-D) and 278 were systemically important non-deposit accepting NBFCs (NBFCs- ND-SI). All NBFCs-D and NBFCs-ND-SI, including Government owned NBFCs, are subject to prudential regulations such as capital adequacy requirements and provisioning norms, along with reporting requirements. Although the combined balance sheet size of the NBFCs is about one fifth of that of SCBs, the importance of the former lies in last mile credit delivery and niche segment support in the Indian financial system. II.3.1 Asset Quality and Capital Adequacy 2.47 The GNPA ratio of the NBFC sector declined during successive quarters till December 2019, however, surged in March 2020 quarter. The net NPA ratio was marginally lower in March 2020 quarter than the previous year. The CRAR of the sector stood at 19.6 per cent in March 2020, which was lower than its level a year ago (Table 2.8). II.3.2 Post COVID-19 Response 2.48 Banks and market borrowings account for over 70 per cent of total outside liabilities of the NBFC sector. With the waning of market confidence, the share of long-term market debt [i.e., non-convertible debentures (NCDs)] in total borrowings of the NBFC sector declined from 49.1 per cent at end-March 2017 to 40.8 per cent at end-December 2019. The consequent funding gap was met through bank borrowings, which rose from 23.1 per cent of total borrowings to 28.9 per cent over this period. 2.49 The declining share of market funding for NBFCs is a concern as it has the potential to accentuate liquidity risk for NBFCs as well as for the financial system. Smaller / mid-sized and AA or lower rated / unrated NBFCs have been shunned by both banks and markets, accentuating the liquidity tensions faced by NBFCs which was also reflected in the lacklustre response to the Targeted Long-Term Repo Operations 2.0 (TLTRO 2.0). 2.50 In the aftermath of the IL&FS crisis, NBFCs have been facing differentiation in market access and financial conditions, with only the higher rated entities able to raise funds. They have also started maintaining liquidity cover of two to three months, despite the higher costs. In the context of COVID-19, however, risks to the sector and consequently, systemic risks can intensify. IndAS accounting could impinge on the balance sheet risks, especially asset quality and provisioning; finances of NBFC-MFIs; contagion from Mutual Funds due to redemption pressures and customer confidence. | Table 2.8: Asset Quality31 and CRARs32 of NBFCs | | (Per cent) | | | GNPA Ratio | NNPA Ratio | CRAR | | Mar-2015 | 4.1 | 2.5 | 26.2 | | Mar-2016 | 4.5 | 2.5 | 24.3 | | Mar-2017 | 6.1 | 4.4 | 22.1 | | Mar-2018 | 5.8 | 3.8 | 22.8 | | Mar-2019 | 6.1 | 3.3 | 20.1 | | Sep-2019 | 5.6 | 2.9 | 19.9 | | Dec-2019 | 5.9 | 3.1 | 19.5 | | Mar-2020* | 6.4 | 3.2 | 19.6 | *: Provisional
Source: RBI Supervisory Returns | II.3.3 Stress Tests 2.51 System-level stress tests for the NBFC sector’s aggregate credit risk for the quarter ending December 2019 were carried out under three scenarios: increase in GNPA by (i) 1 SD; (ii) 2 SD; and (iii) 3 SD. It is assessed that the sector’s CRAR would decline from 19.4 per cent to 17.2 per cent in the first scenario, to 16.4 per cent in the second scenario and to 15.2 per cent in the third scenario. 2.52 Stress tests results on individual NBFCs indicate that, under the above-mentioned three scenarios, 11.2 per cent, 14.0 per cent and 19.5 per cent of the companies would not be able to comply with the minimum regulatory capital requirements of 15 per cent. II.4 SMA Ratio Analysis 2.53 A rating mapping of special mention account (SMA) assets has been carried out on Non-PSU obligors, a cohort highly vulnerable to risk aversion, in order to examine the resilience of corporates, especially in view of the regulatory moratorium. The aggregate share of AA and above ratings in the SMA33 category for Non-PSU obligors has been low relative to their presence in the standard category34 for non-financial Non-PSU obligors as on March 2020 (Tables 2.9 & 2.10). The SMA analysis was conducted on aggregate obligors rather than on non-financial obligors, since the presence of financial obligors in the SMA category has been generally sparse. Nonetheless, both standard and SMA asset categories show sizeable and comparable presence of the unrated cohort. Moreover, as noted in Chapter 1, flow of credit to Non-PSU obligors in the rating grade A and below has been somewhat restrained, specifically from PVBs in Q4:2019-20 with the onset of COVID-19. Consequently, the financial health of this cohort is vital for systemic stability. | Table 2.9: Share of Ratings Category in SMA (SMA 1 & 2) Loans to Non-PSU Obligors | | (per cent) | | | Mar-17 | Jun-17 | Sep-17 | Dec-17 | Mar-18 | Jun-18 | Sep-18 | Dec-18 | Mar-19 | Jun-19 | Sep-19 | Dec-19 | Mar-20 | | AAA | 0.0 | 4.2 | 0.0 | 0.2 | 14.7 | 21.5 | 0.0 | 2.1 | 0.0 | 0.0 | 0.7 | 0.0 | 1.8 | | AA | 6.9 | 8.6 | 6.4 | 18.3 | 16.3 | 16.6 | 18.8 | 11.1 | 2.8 | 0.2 | 1.2 | 1.9 | 0.2 | | AA and Above | 6.9 | 12.8 | 6.5 | 18.6 | 31.0 | 38.1 | 18.8 | 13.1 | 2.8 | 0.2 | 1.9 | 1.9 | 1.9 | | A | 17.4 | 12.5 | 15.4 | 14.6 | 15.5 | 5.2 | 2.3 | 9.1 | 14.6 | 7.8 | 3.8 | 5.6 | 13.4 | | BBB | 17.1 | 16.5 | 11.3 | 14.1 | 16.4 | 16.6 | 16.0 | 15.6 | 16.5 | 13.2 | 16.4 | 15.0 | 18.8 | | BB | 12.3 | 11.3 | 16.3 | 12.8 | 12.0 | 13.2 | 18.4 | 17.1 | 12.8 | 18.0 | 15.8 | 18.1 | 9.3 | | B | 4.3 | 5.5 | 5.1 | 3.8 | 4.2 | 3.3 | 6.1 | 7.2 | 5.5 | 6.6 | 6.5 | 9.7 | 6.9 | | C | 2.1 | 1.7 | 1.0 | 1.3 | 0.2 | 0.7 | 5.1 | 1.2 | 1.1 | 3.1 | 0.5 | 0.8 | 1.7 | | D | 20.6 | 18.9 | 26.4 | 18.4 | 10.0 | 10.8 | 17.1 | 20.5 | 23.9 | 26.9 | 30.5 | 19.1 | 24.0 | | Unrated | 19.3 | 20.9 | 18.0 | 16.5 | 10.6 | 12.1 | 16.2 | 16.1 | 22.8 | 24.2 | 24.7 | 29.7 | 24.0 | | Source: Prime database, RBI Supervisory Returns and Staff Calculations. |
| Table 2.10: Share of Ratings category - Standard Loans (0 days past due and SMA-0) to Non-PSU Non-financial Obligors | | (per cent) | | | Mar-17 | Jun-17 | Sep-17 | Dec-17 | Mar-18 | Jun-18 | Sep-18 | Dec-18 | Mar-19 | Jun-19 | Sep-19 | Dec-19 | Mar-20 | | AAA | 3.4 | 3.6 | 4.4 | 4.2 | 3.4 | 2.3 | 4.3 | 4.3 | 5.7 | 5.7 | 6.3 | 6.1 | 6.4 | | AA | 16.2 | 16.5 | 16.3 | 17.8 | 19.4 | 21.2 | 21.2 | 21.1 | 19.9 | 19.9 | 20.4 | 20.4 | 20.6 | | AA and above | 19.6 | 20.0 | 20.7 | 22.0 | 22.8 | 23.5 | 25.5 | 25.4 | 25.6 | 25.6 | 26.7 | 26.5 | 27.0 | | A | 19.2 | 20.5 | 19.9 | 19.5 | 18.4 | 18.5 | 17.6 | 19.5 | 20.3 | 20.2 | 19.8 | 19.3 | 18.9 | | BBB | 18.8 | 18.5 | 18.6 | 16.8 | 16.9 | 18.1 | 17.3 | 17.1 | 15.8 | 16.3 | 15.3 | 17.1 | 15.9 | | BB | 7.9 | 7.1 | 7.3 | 8.5 | 8.6 | 7.7 | 8.7 | 7.4 | 7.8 | 7.3 | 6.8 | 6.4 | 7.2 | | B | 3.2 | 3.2 | 2.9 | 3.0 | 2.8 | 2.8 | 2.9 | 2.8 | 2.7 | 2.6 | 2.8 | 2.8 | 3.8 | | C | 0.2 | 0.2 | 0.3 | 0.1 | 0.1 | 0.1 | 0.4 | 0.2 | 0.1 | 0.1 | 0.1 | 0.2 | 0.3 | | Unrated | 31.1 | 30.6 | 30.2 | 30.1 | 30.3 | 29.2 | 27.6 | 27.6 | 27.8 | 27.8 | 28.5 | 27.5 | 26.8 | | Source: Prime database, RBI Supervisory Returns and Staff Calculations. | 2.54 Given the importance of non-banking financial intermediation in the credit spectrum and the high funding of the sector through banking channels (Chart 2.23), the dispersion of NBFCs and HFCs across the impairment spectrum for given rating grades show a good payment record of NBFCs prior to the imposition of moratorium (Tables 2.11 & 2.12). The impact of the moratorium on private NBFCs/HFCs can be substantial, with proportion of assets under the moratorium for NBFCs averaged between 39-65 per cent based on underlying assets with approximately 50 per cent of the aggregate assets under moratorium as on end April 2020. Based on the disclosures made by NBFCs/ HFCs, the assets under moratorium are dominated by wholesale customers and real-estate developers, although retail portfolios in the micro-loans and auto loan segments have also been affected. Access of NBFCs/HFCs to capital markets, both debt and equity, is of significant importance to the sector. 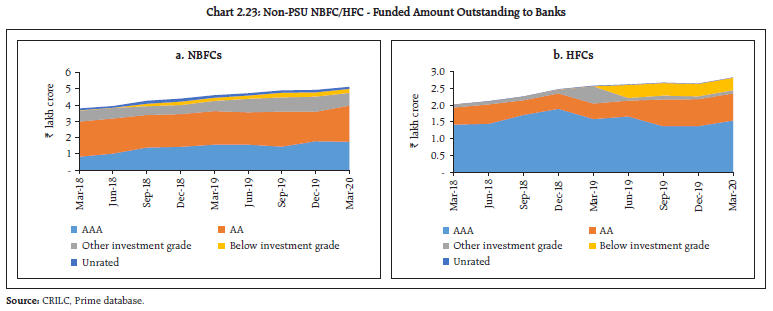
| Table 2.11: Asset Impairment Status of Bank Loans to Non-PSU NBFCs, March 2020 | | (per cent) | | Non-PSU NBFCs | Standard (0 days past due and SMA-0) | SMA (SMA 1/ SMA 2) | Non- performing | | AAA | 99.1 | 0.9 | 0.0 | | AA | 100.0 | 0.0 | 0.0 | | Other investment grade | 88.6 | 11.4 | 0.0 | | Below investment grade | 5.2 | 1.4 | 93.4 | | Unrated | 96.2 | 0.1 | 3.7 | | Source: Prime database, RBI Supervisory Returns and Staff Calculations. |
| Table 2.12: Asset Impairment Status of Bank Loans to Non-PSU HFCs, March 2020 | | (per cent) | | Non-PSU HFCs | Standard (0 days past due and SMA-0) | SMA (SMA 1/ SMA 2) | Non- performing | | AAA | 100.0 | 0.0 | 0.0 | | AA | 100.0 | 0.0 | 0.0 | | Other investment grade | 100.0 | 0.0 | 0.0 | | Below investment grade | 1.1 | 0.0 | 98.9 | | Unrated | 93.4 | 0.0 | 6.6 | | Source: Prime database, RBI Supervisory Returns and Staff Calculations. | 2.55 Given the uncertainty relating to cash flows induced by COVID-19, the short-term maturities of market liabilities of Non-PSU NBFCs/ HFCs become relevant. There are significant near-term maturities across all rating grades (Table 2.13). The partial credit guarantee scheme wherein Government would absorb up to 20 per cent of the first loss assumes critical importance in this context. | Table 2.13: Issuances and Near-term maturities of CPs & NCDs of Non-PSU NBFCs/HFCs | | (₹ crore) | | | Issuances | Maturing | | Mar-20 | Apr-20 | May-20 | Mar-20 | Apr-20 | May-20 | Jun-20 | Jul-20 | Aug-20 | Sep-20 | | AAA | 21,885 | 17,465 | 22,980 | 34,680 | 8,363 | 19,454 | 27,645 | 15,735 | 24,792 | 11,802 | | AA | 7,427 | 3,351 | 7,377 | 19,520 | 6,517 | 7,142 | 8,815 | 4,622 | 5,790 | 4,389 | | Others | 937 | 694 | 138 | 2,885 | 3,413 | 4,037 | 1,658 | 1,887 | 3,589 | 2,559 | | Total | 30,249 | 21,510 | 30,495 | 57,084 | 18,293 | 30,633 | 38,117 | 22,243 | 34,171 | 18,750 | | Source: Prime database, RBI Supervisory Returns and Staff Calculations. | II.5 Interconnectedness II.5.1 Network of the Financial System35 36 2.56 A financial system can be visualised as a network with financial institutions as nodes and bilateral exposures as links joining these nodes. While these links enable efficiency gains and risk diversification, they can become conduits of risk transmission in case of a crisis. Understanding the nuances in propagation of risk through networks is useful for devising appropriate policy responses for safeguarding financial and macroeconomic stability (Box 2.1). Box 2.1: Pandemics to Financial Crises – Importance of Understanding Networks and Contagion Financial network analysis tackles questions relating reasons for the growing interconnectedness of the financial system; whether connections tend to amplify or dampen systemic shocks; and whether the structure of the network matters. This helps to identify structural features relevant for setting policy (Glasserman and Young, 2016). Further, attempts were made to understand how the network structure interacts with other potential sources of contagion. One aspect that came out emphatically during the global financial crisis (GFC) is that the health of individual financial institutions may not ensure the health of the financial system as a whole. Given interconnectivity, extreme stress can disrupt normal functioning of the markets and asset market illiquidity could lead to solvency issues and finally result in contagion – akin to virus spreading from the infected to the healthy through various forms of contact. In the run-up to the GFC, leverage levels had increased, reliance on short-term funding was high and capital buffers at some banks were extremely thin. All of these factors affect the stability of the financial system to varying degrees. The key issue is how the network of obligations relates to these potential sources of contagion, and whether it serves to amplify or dampen them. Network connections can be net positive for the financial system by providing opportunities for investment, risk diversification and liquidity management. At the same time, network connections can also have a negative effect by creating channels through which shocks can spread, and thus leading to contagion. Foreseeing financial contagion is, however, a challenge, involving balancing of the efficiency inducing aspects of financial networks, on the one hand, and not reacting to false alarms on the other. Financial networking related concepts require adaptation for application in the pandemic domain. While networked entities are inevitably affected by a default in one of the elements in the chain, pandemic transmission is probabilistic - a healthy person coming in contact with an infected one will catch the infection with a certain probability. Such probabilistic connections imply that contagion impact is best approximated through a pooled approach rather than through a case by case one. In this regard, it is somewhat similar to modelling of asset price “bubbles” in behavioural finance wherein asset price movements induce psychological effect in others probabilistically and not deterministically. The analogy between pandemics and financial crises goes back to the Asian financial crisis - “Asian flu” - for the first time. The use of the term contagion seldom applied to crises in the financial markets before the global financial crisis. The utility of urban agglomerations (or networks), which have currently turned themselves into epicentres of COVID-19 pandemic transmission, comes up for scrutiny. Urban agglomeration is cost saving, with associated network effects, leading to economies of scale. Elements which, in the natural course of business, allow the seamless flow of expertise and creative inputs flowing from one domain to another related domain, leads to links for spread of contagion in the context of a pandemic. References Andrew G Haldane (2009). “Rethinking the financial network” Speech by Executive Director, Financial Stability, Bank of England, at the Financial Student Association, Amsterdam (April 28, 2009). Glasserman and Young (2016). Contagion in Financial Networks, Journal of Economic Literature, 54(3), 779– 831. Robert Peckham (2013). Economies of Contagion: Financial Crisis and Pandemic, Economy and Society, 42:2, 226-248. Ulrich Beck, Scott Lash, Brian Wyne (1992), Risk Society-Towards a New Modernity, Sage Publications. | 2.57 The total outstanding bilateral exposures37 among the entities in the financial system marginally declined during 2019-20 (Chart 2.24 a). 2.58 Notwithstanding a secular decline in share, SCBs had the largest bilateral exposures in the Indian financial system in March 2020. SCBs’ lending to and borrowing from other entities (including other SCBs) stood at 44.6 per cent of total lending and borrowings in the system (Chart 2.24 b). Among bank groups, PSBs had a net receivable position vis-à-vis the entire financial sector, whereas PVBs had a net payable position and FBs were evenly balanced (Charts 2.25 and 2.26).
2.59 AMC-MFs veered away from trend performance and registered a sizable decline in their share during 2019-20, while their AUM fell. On the other hand, the share of AIFIs increased during the year as deposits from SCBs, borrowings from AMC-MFs and refinancing to PVBs and HFCs expanded. The shares of NBFCs, HFCs, insurance companies and pension funds also increased during 2019-20 and stood at 14.2 per cent, 8.9 per cent, 8.8 per cent and 1.6 per cent, respectively, in March 2020 (Chart 2.24 b). 2.60 In terms of inter-sectoral38 exposures, AMC-MFs, followed by insurance companies, were the biggest fund providers in the system, while NBFCs were the biggest receivers of funds, followed by HFCs. Among the entities which received funds from the financial system, PVBs recorded a decline of 22 per cent, while payables of NBFCs and HFCs increased marginally (Chart 2.26). 2.61 Among the fund providers to the financial system, AMC-MFs recorded a sharp decline in their receivables from the financial system, which increased for PSBs and insurance companies (Chart 2.26). a. Inter-bank market 2.62 The size of the inter-bank market (both fund-based39 and non-fund-based40) has been persistently declining over the last few years. Fund-based inter-bank exposures as a share of total assets of the banking system moderated further during the year due to excess liquidity in the banking system as well as due to the impact of LCR norms, which incentivise secured funding over unsecured inter-bank market funding. (Chart 2.27). 2.63 PSBs remained the dominant players in the inter-bank market, followed by PVBs and FBs as at end-March 2020 (Chart 2.28). 2.64 Around 70 per cent of the fund-based inter-bank market was short-term (ST) in nature, in which ST deposits had the highest share, followed by ST loans. The composition of long-term (LT) fund-based inter-bank exposure shows that LT loans constituted slightly more than half of LT exposure followed by LT deposits (Chart 2.29). 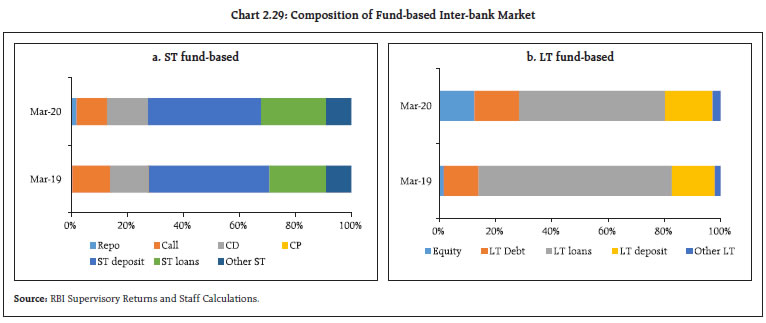 2.65 The inter-bank market typically has a core-periphery network structure41 42. At end-March 2020, there were 4 banks in the inner-most core and 9 banks in the mid-core circle. This is in line with the pattern seen during the last 5 years, with the number of banks in the inner-most core ranging between 2 and 5. These are usually the biggest PSBs or PVBs. Most foreign banks and almost all old private banks are usually in the outermost periphery, making them the least connected banks in India. The remaining PSBs and PVBs, along with a few major FBs, make up the mid and outer core. The merger of some PSBs with effect from April 2020 would largely impact the mid-core and outer core (Chart 2.30). 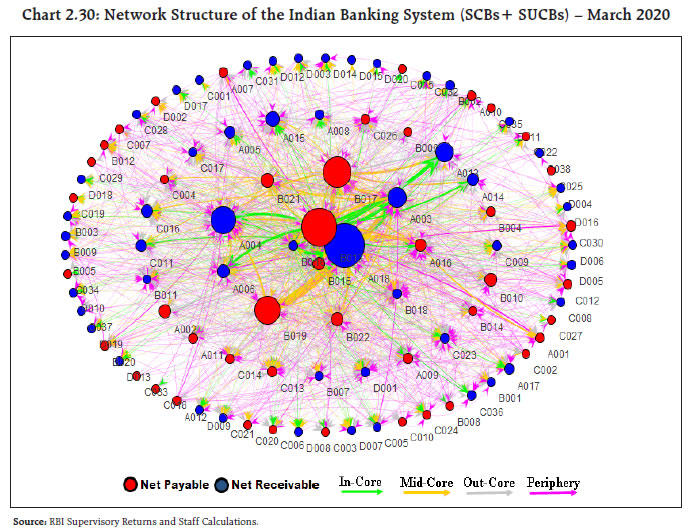 2.66 The degree of interconnectedness in the banking system (SCBs), as measured by the connectivity ratio43, has been declining slowly over the last few years. This is in line with a shrinking inter-bank market, as mentioned earlier. The cluster coefficient44, which depicts local interconnectedness (i.e., tendency to cluster), has remained almost constant over the last 5 years (Chart 2.31). b. Exposure of AMCs-MFs 2.67 Notwithstanding the recent decline in AUM, AMC-MFs’ gross receivables were around ₹7.86 lakh crore (29.5 per cent of their average AUM) whereas their gross payables were around ₹0.68 lakh crore as at end-March 2020. 2.68 The top recipients of their funding were SCBs followed by NBFCs, HFCs and AIFIs. Their receivables from SCBs, which had gone up sharply in 2018-19, registered a decline in 2019-20. In absolute terms, however, SCBs, NBFCs and HFCs have all seen a decline in their payables to AMC-MFs. In contrast, AIFIs’ reliance on AMC-MFs increased as they expanded refinancing provided to other financial institutions. Funding from AMC-MFs was a big way of subscription to debt and CDs issued by AIFIs. (Chart 2.32 a). 2.69 Instrument-wise, AMC-MFs’ receivables saw a sharp increase in the share of equity funding, especially in recent quarters which, however, reversed in Q4: 2019-20, but was compensated by an increase in debt funding. AMC-MFs continued to show preference for CDs over CPs (Chart 2.32 b). c. Exposure of Insurance Companies 2.70 Insurance companies are the second largest net providers of funds to the financial system (gross receivables were ₹5.93 lakh crore and gross payables were ₹0.24 lakh crore in March 2020). 2.71 SCBs were the top recipients of their funds, followed by NBFCs and HFCs. LT debt and equity accounted for almost all the receivables of insurance companies, who had only limited exposure to short-term instruments. The share of LT debt, which had been falling, gradually saw a reversal in 2019-20 as these companies subscribed to debt issued by NBFCs and AIFIs (Chart 2.33 a and b). d. Exposure of AIFIs 2.72 Gross receivables of AIFIs increased by around 16 per cent y-o-y to ₹ 3.18 lakh crore as at end March 2020. The top recipients of funds provided by them were SCBs (primarily PVBs), followed by HFCs and NBFCs. Instrument-wise, these funds primarily took the form of loans – both LT and ST refinancing purposes (Chart 2.34 a and b). e. Exposure to NBFCs 2.73 NBFCs were the largest net borrowers of funds from the financial system, with gross payables of ₹8.84 lakh crore and gross receivables of ₹0.89 lakh crore as at end-March 2020. They obtained more than half of the funds from SCBs, followed by AMC-MFs and insurance companies (Chart 2.35 a). 2.74 The choice of instruments in the NBFC funding mix reflects the increasing role of LT Loans (provided by SCBs and AIFIs) and LT debt (held by insurance companies and AMC-MFs) and a declining share of CPs (subscribed to by AMC-MFs and SCBs) (Chart 2.35 b). f. Exposure to HFCs 2.75 HFCs were the second largest borrowers of funds from the financial system, with gross payables of around ₹5.91 lakh crore and gross receivables of ₹0.45 lakh crore as at end-March 2020. HFCs’ borrowing profile was similar to that of NBFCs, except that AIFIs played a significant role in providing funds to HFCs. The share of AMC-MFs in funding HFCs has come down sharply in the last quarter. In contrast, the share of SCBs has increased (Chart 2.36 a). 2.76 As is the case of NBFCs, LT debt, LT loans, and CPs were the top three instruments through which HFCs raised funds from the financial system, though their funding mix has been in a flux in the last six quarters. Reliance on CP (subscribed to by AMC-MFs and, to a lesser extent, by SCBs) has been on a consistent decline over the last six quarters. This was compensated by an increasing share of LT loans (from banks and AIFIs) and LT debt (Chart 2.36 b). 2.77 The aggregate funding by PSBs for stressed NBFCs/HFCs is increasing (Table 2.14 and Chart 2.26). This has implications for contagion if there is an adverse selection bias in NBFCs’/HFCs’ credit portfolio. Also, an over-reliance on bank funding makes the NBFCs uncompetitive over a host of financial products, especially in those where the sector has to compete with banks and hence NBFCs’ portfolio choices may tend to have an adverse selection bias45. | Table 2.14: Net Funding Sources of Select Classes of Financial Intermediaries from Financial System | | (₹ crore) | | | Sep-19 | Mar-20 | | Users of Funds | | PSB | PVB | NBFC | HFC | PSB | PVB | NBFC | HFC | | Source of Funds | AIFIs | -54,249 | 1,35,195 | 8,063 | 42,956 | -84,353 | 97,172 | 7,904 | 45,555 | | PSBs | - | 1,22,443 | 2,50,694 | 1,53,810 | - | 1,33,892 | 3,02,375 | 1,67,220 | | PVBs | -1,22,443 | - | 84,518 | 55,889 | -1,33,892 | - | 90,529 | 44,442 | | AMCs | 1,03,736 | 3,33,158 | 2,06,488 | 1,51,440 | 91,248 | 2,37,978 | 1,74,517 | 1,29,605 | | Source: RBI Supervisory Returns and Staff Calculations. | II.5.2 Contagion Analysis46 2.78 Contagion analysis uses network technology to estimate the systemic importance of different banks. The failure of a bank which is systemically important leads to greater solvency and liquidity losses for the banking system which, in turn, depend on the initial capital and liquidity position of banks along with the number, nature (whether it is a lender or a borrower) and magnitude of the interconnections that the failing bank has with the rest of the banking system. a. Joint Solvency47-Liquidity48 Contagion Losses for SCBs due to Bank Failure 2.79 In this analysis, the impact of discrete shocks on the banking system is seen in terms of the number of bank failures that take place and the amount of solvency and liquidity losses that are incurred. 2.80 A contagion analysis of the banking network49 based at end-March 2020 position indicates that if the bank with the maximum capacity to cause contagion losses fails, it will cause a solvency loss of 4.30 per cent of total Tier 1 capital of SCBs and liquidity loss of 0.30 per cent of total high quality liquid assets (HQLA) of the banking system. Lower losses as at end-March 2020 relative to a year ago reflect a better capitalised public sector banking system and a shrinking inter-bank market (Table 2.15). | Table 2.15: Contagion Losses due to Bank Failure – March 2020 | | Trigger | % of Tier 1 capital of the Banking System | % of HQLA | Number of Banks defaulting due to solvency losses | Number of Banks defaulting due to liquidity losses | | Bank 1 | 4.30 | 0.30 | 1 | 0 | | Bank 2 | 3.23 | 0.35 | 1 | 0 | | Bank 3 | 1.87 | 2.47 | 0 | 2 | | Bank 4 | 1.74 | 1.65 | 0 | 4 | | Bank 5 | 1.72 | 1.01 | 0 | 0 | Note: Top five ‘Trigger banks’ have been selected on the basis of solvency losses caused to the banking system.
Source: RBI Supervisory Returns and Staff Calculations. | b. Solvency Contagion Losses for SCBs due to NBFC/ HFC failure 2.81 As noted earlier, NBFCs and HFCs are the largest borrowers of funds from the financial system. A substantial part of this funding comes from banks. Therefore, failure of any NBFC or HFC will act as a solvency shock to their lenders which can spread by contagion. 2.82 An analysis of the possible solvency contagion losses50 to the banking system caused by idiosyncratic failure of any NBFC indicates that, as at end-March 2020, contagion losses on account of failure of the top three PSU NBFCs ranged between 4.3 per cent to 5 per cent of the banking system’s Tier-1 capital. Furthermore, Non-PSU NBFCs with the maximum capacity to cause solvency losses to the banking system could knock off 2.7 per cent of the latter’s total Tier 1 capital but it would not lead to failure of any bank (Table 2.16). | Table 2.16: Contagion Losses due to Non-PSU NBFC Failure – March 2020 | | Trigger | Solvency Losses as % of Tier -1 Capital of the Banking System | Number of Defaulting banks due to Solvency Losses | | NBFC 1 | 2.71 | 0 | | NBFC 2 | 2.17 | 0 | | NBFC 3 | 1.88 | 0 | | NBFC 4 | 1.57 | 0 | | NBFC 5 | 1.29 | 0 | Note: Top five ‘Trigger NBFCs’ have been selected on the basis of solvency losses caused to the banking system.
Source: RBI Supervisory Returns and Staff Calculations. | 2.83 Failure of the HFC with the maximum capacity to cause solvency losses to the banking system will knock off 6.77 per cent of the latter’s total Tier 1 capital but without failure of any bank (Table 2.17). | Table 2.17: Contagion Losses due to HFC Failure – March 2020 | | Trigger | Solvency Losses as % of Tier -1 Capital of the Banking System | Number of Banks Defaulting due to solvency losses | | HFC 1 | 6.77 | 0 | | HFC 2 | 3.64 | 0 | | HFC 3 | 1.65 | 0 | | HFC 4 | 1.63 | 0 | | HFC 5 | 1.20 | 0 | Note: Top five ‘Trigger HFCs’ have been selected on the basis of solvency losses caused to the banking system.
Source: RBI supervisory returns and staff calculations. | 2.84 Although SCBs’ lending to NBFCs and HFCs has gone up as noted earlier (Charts 2.35 and 2.36; Table 2.14), the losses as at end-March 2020 were lower than a year ago due to a better capitalised public sector banking system and a shrinking inter-bank market. c. Solvency Contagion Losses51 for SCBs due to Macroeconomic Shocks 2.85 The contagion impact of the failure of a bank is likely to be magnified if macroeconomic shocks result in distress in the banking system in a generalised downturn in the economy. Macroeconomic shocks cause some SCBs to fail the solvency criterion, which then acts as a trigger for further solvency losses. In the previous iteration, the shock was applied to the entity that could cause the maximum solvency contagion losses. In this iteration, however, the initial impact of macroeconomic shocks on individual bank’s capital was taken from the macro-stress tests in which a baseline, three (medium, severe and very severe) adverse scenarios were considered for March 202152. 2.86 Initial capital loss due to macroeconomic shocks is 8.80 per cent, 12.60 per cent, 17.16 per cent and 18.78 per cent of Tier 1 Capital for baseline, medium, severe and very severe stress scenarios, respectively. The number of banks that fail to maintain Tier I adequacy ratio of 7 per cent due to macroeconomic shocks are 5 in the baseline, 6 each in medium and severe stress scenarios and 7 in the very severe stress scenario. At the end of March 2020, these banks had low Tier 1 capital (either already below 7 percent or marginally higher). 2.87 Additional solvency losses to the banking system due to contagion (over and above the initial loss of capital due to the macro shocks), in terms of Tier 1 capital of the banking system is 4.09 per cent in the case of baseline and medium stress scenarios and 4.15 and 4.18 per cent in case of severe stress and very severe stress scenarios, respectively. Under such conditions, two additional banks fail due to contagion in the baseline scenario, severe and very severe stress scenarios, while one additional bank fails in the medium stress scenario. The contagion impact is low because these are relatively smaller banks with limited borrowings in the inter-bank market and also because other banks are well capitalised. Going forward, merger of two of the failing banks with stronger banks (which became effective on April 01, 2020) will further increase systemic resilience (Chart 2.37). 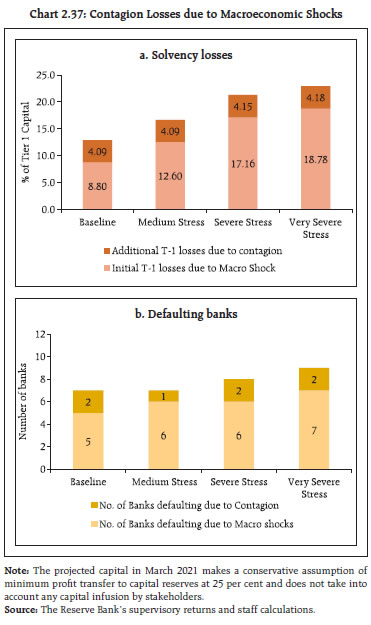 2.88 In sum, in the wake of COVID-19 induced disruptions, the regulatory dispensations extended across regulatory jurisdictions are intended to minimise the risks in an effort to protect solvency of the overall system. As a consequence, there will inevitably be an increased stress in the financial system. Given the importance of the overall system to function as a going concern, the policy measures have ensured the resilience of the financial system. 2.89 The banking system may need to augment its capital to cater to a post-COVID-19 revival in the economy. A shrinking inter-bank market along with higher capitalisation have moderated the inter-bank contagion risks. While the exposure of mutual funds to NBFCs/HFCs moderated, the same of banks increased. Mutual funds have to improve their liquidity framework to contain spillovers.
|