Khaijamang Mate, Kaushiki Singh, Bichitrananda Seth, Indrani Manna, Neeraj Kumar, Prayag Singh Rawat and Sangita Misra* This paper focuses on the role of social sector spending in improving developmental outcomes. It situates India in a cross-country assessment of the progress made with regard to sustainable development goals (SDGs). It reviews trends in states’ social sector expenditure and SDG outcomes, in particular, education and health, while drilling down into spatial distribution patterns. Analytical findings support the growth enhancing role of human capital formation and the important role that education and health expenditures play in improving primary enrolments and in reducing infant mortality rates. Spending through certain centrally sponsored schemes has also been productive in improving the SDG outcomes, particularly in the current decade. The paper also provides evidence on convergence which augurs well for sustainable growth. Going forward, the focus of education and health expenditures should be on improving secondary enrolment, learning levels among students and quality of health services so as to eliminate the existing gap with respect to SDG target. While persevering with fiscal consolidation, channelising spending towards SDGs coupled with improving the efficiency of such expenditures may be crucial to meet the financing gap. JEL Classification : H5, H72, I20, I10, Q01 Keywords : Social sector expenditures, public spending, education, health, sustainable development goal Introduction With the global economy experiencing a broad-based strengthening of growth, the narrative is shifting towards anchoring fiscal policy to medium-term sustainability. This is sought to be achieved by re-orienting public expenditure towards growth-enhancing capital and social sector expenditures, particularly for countries with limited fiscal space (IMF, 2018). The overall objective is to entrench macroeconomic stability by harvesting benefits for medium-term growth through accumulation of physical and human capital and mitigating inequality. Human capital development is investment-intensive, and returns are not immediate. Theoretically, public provision of merit goods like education and health services is justified on the basis of externalities and the difference between private and social returns (Musgrave, 1996). It is this non-rivalry and non-excludability characterising consumption and investment of human capital which makes it a core responsibility of the public sector. Besides, there is no guarantee of an equitable provision of these basic services under the market mechanism. In India, the interface of fiscal policy with the citizenry is the maximum at the sub-national level, and it is in this context that this paper derives its motivation. Investing in human capital has now become a global priority. The Addis Ababa Action Agenda1 (AAAA) provided a global framework for financing sustainable development. With the year 2015 marking the end of the 15- year window for achieving the Millennium Development Goals (MDGs), the United Nations General Assembly adopted on September 25, 2015 a new set of 17 Sustainable Development Goals (SDGs) and 169 associated targets to be achieved by 2030. While the MDGs have been described as ‘the greatest anti-poverty push in history’, the SDGs are envisaged as agents for transforming the world (UNDP-World Bank, 2016). Addressing people, the planet, peace, prosperity, and partnership, the SDGs embrace the view that development needs to be economically, socially and environmentally sustainable. Unlike the MDGs, the SDG framework does not distinguish between developed and developing nations. Beginning with the Chinese Presidency in 2016, the G20 has committed itself to aligning its work with the 2030 Agenda in its efforts to achieve sustainable, balanced and inclusive growth. The Indian economy has been undergoing structural transformation over the past three decades as it steps up its trajectory of growth, with its average GDP growth rising from 5.5 per cent during the 1990s to above 7 per cent during 2001-2018.2 Yet, its progress with respect to the human development index (HDI) score has been modest, especially in education (SDG 4) and health (SDG 3). Investment in these sectors is critical for enhancing the effectiveness of income distribution policies and reaping the demographic dividend. The investment required, however, is substantial. In particular, for India, the social investment required for implementing the SDG agenda could be up to 10 per cent of the gross domestic product (GDP) (UNESCAP, 2017). Against this backdrop, this paper addresses the role of social sector expenditures, dwelling analytically on specific facets of this common thread that impinge on the quality of economic development in India. Section II covers the international perspective, with cross country comparisons, particularly for various SDG targets and human development indices. Section III offers a detailed analysis of trends in social sector expenditure in India, including centrally sponsored schemes (CSS) and SDG outcomes across states. While Section IV explores the nature of the link between social sector expenditure and the different SDG outcomes, evidence supporting convergence across states with respect to social sector expenditures and SDG outcomes is provided in Section V. Taking stock of the gap vis-a-vis SDG targets for India, Section VI provides estimates of financing gaps in health and education expenditures by 2030. Concluding observations are set out in Section VII. Section II
International Comparison With the adoption of MDGs for the period 2000-2015, many countries mainstreamed them into their national and sub-national development plans and strategies. Whereas about 50 per cent of the countries have met the MDG target for poverty reduction (Chart 1)3, countries have been less successful in ameliorating non-income deprivations such as access to quality education or basic health services that can lay the ground for sustained poverty reduction and shared prosperity. Addressing capability deprivation and mitigating the vulnerability of falling back into poverty have become pressing issues in many countries, especially those in which the bottom 40 per cent of the population saw a decline in their incomes. Other issues have also emerged such as combining growth with reduction in the level of environmental externalities and carbon emissions which were not conceived as part of the MDGs. From MDGs to SDGs SDGs (2015-2030) offer a transformative, universal framework to address three interlinked dimensions of global existence – people; the planet; and prosperity – while laying out an inclusive and robust development path for the world to follow over the next 15 years. They are applicable for developed and developing countries alike, with monitoring frameworks at three different levels – global; regional; and national. While global and regional partnerships are being pursued, countries have started taking concrete steps at the national level to integrate SDGs into their policy frameworks and mechanisms (Annex 1). In India, the responsibility for overseeing SDG implementation has been assigned to the National Institution for Transforming India (NITI Aayog), which has mapped goals and targets to various nodal ministries as well as flagship programmes. State governments are also engaged in developing roadmaps for achieving the SDGs, with several of them having already published their plans. Draft indicators for tracking the SDGs have been developed and placed in the public domain by the Ministry of Statistics and Programme Implementation for wider consultation. SDG Index and Progress of SDGs among Countries The UN Sustainable Development Solutions Network (SDSN) has created a prototype index that measures the performance of 149 countries in achieving SDGs, with a baseline measurement taken in 2015. Three Scandinavian countries (Sweden, Denmark and Finland) top the SDG Index, but their scores remain below the maximum score of 100 due to less than satisfactory scores on at least one SDG, the climate change and other environmental SDGs. The distribution of scores is bi-modal, with a fat left tail reflecting concentration of countries with scores below the median score of 66 (Chart 2). SDG and India India ranks 113th with a score of 58.1 on the SDG index underlining the serious need for concerted efforts to achieve the SDGs (Table 1). India’s progress towards the 17 SDG targets is uneven across goals, with the individual SDG indices ranging from 33.1 to 93.4.4 While India fares well in terms of eliminating poverty (SDG 1), responsible consumption and production (SDG 12) and Climate Action (SDG 13), among others, its score remains below 50 with regard to eliminating hunger (SDG 2), gender equality (SDG 5) and infrastructure (SDG 9) (Chart 3). With regard to quality education (SDG 4) and good health (SDG 3), India’s score remains modest.5
| Table 1: SDGs Index Ranking | | Country | Rank | Score* | | 1 | 2 | 3 | | Sweden | 1 | 85.6 | | Denmark | 2 | 84.2 | | Japan | 11 | 80.2 | | United Kingdom | 16 | 78.3 | | Canada | 17 | 78.0 | | USA | 42 | 72.4 | | Israel | 52 | 70.1 | | Brazil | 56 | 69.5 | | Russian Federation | 62 | 68.9 | | China | 71 | 67.1 | | Sri Lanka | 81 | 65.9 | | Bhutan | 83 | 65.5 | | Nepal | 104 | 61.6 | | South Africa | 107 | 61.2 | | India | 113 | 58.1 | | Bangladesh | 117 | 56.2 | | Pakistan | 119 | 55.6 | | Afghanistan | 146 | 46.8 | | Liberia | 148 | 42.8 | | Chad | 150 | 41.5 | *Arithmetic Mean of SDG scores of each country.
Source: Sachs et.al., 2017. | Social Sector Expenditure – A Comparison Social sector performance is often linked to financial investments in the sector (De and Endow, 2008; Jung and Thorbecke, 2003). In terms of financial resources allocated to the social sector, developed economies allocate, on average, a fifth of their GDP to the sector. The benefit-to-cost ratio of social programmes between 2011 and 2014 in Asia (excluding India) and Latin America (excluding Chile) was, however, higher than that of Africa and developed countries – 0.21 as opposed to 0.15 in developed countries and 0.10 in Africa. India spends about 8 per cent of GDP on the social sector. A comparison across the G20 countries shows that there is scope for improvement in India’s expenditure on education and health and the gains from additional spend could potentially be substantial (Chart 4).
Section III
State Finances and SDG Outcomes: Trends Recognising the role of human capital in achieving sustainable development and taking cognisance of the relatively low rankings for India with respect to SDG goals, this section examines trends in social sector expenditures, in particular education and health, their productivity and SDG outcomes across states. Trends in Social Sector Expenditure States’ social sector expenditure (SSE)6 averaged 5.4 per cent of GDP in India in the pre-global financial crisis period, rising since 2010-11 to about 8.0 per cent of GDP in 2017-18 (RE) (Chart 5). The Constitution entrusts the primary responsibility of health and education to states, with about 80 per cent of the national expenditure on these heads being incurred by them. The Union Government began actively spending on health and education from the late 1990s and early 2000s, providing specific purpose transfers and grants under centrally sponsored schemes (CSS) on areas that have inter-state externalities.7 Expenditure on education and health services (including medical, public health and family welfare) witnessed a decline as percentage of GDP in the 2000s vis-a-vis the 1990s (Table 2). In line with increase in overall social sector expenditures, expenditure on education and health have also risen since 2010-11, but at a moderate pace that could only compensate for the decline (as a percentage of GDP) in the 2000s. Furthermore, while social sector spending has been acyclical in India at the state level, education spending turns out to be pro-cyclical and pronouncedly so during periods of negative output gaps and for bigger states (Kaur et al., 2013). At a disaggregated level, there are large variations across states. Only for about 13 states, social sector expenditures have risen in the period 2010-2018 over the 1990s. (Chart 6). States tend to devote much less financial resources to health expenditure than they do to education: health spend was in the range of 0.5-4.0 per cent of GSDP as against 1.6-8.4 per cent of GSDP for education in 2017-18. Furthermore, within social sector expenditures, education and health expenditures have risen in the current decade vis-à-vis 1990s for only about 9 states (Chart 7a and 7b). | Table 2: Composition of Social Sector Expenditure (as per cent of GDP) - All States | | Item | 1990-91 to 1999-2000 | 2000-01 to 2009-10 | 2010-11 to 2017-18 (RE) | | 1 | 2 | 3 | 4 | | Total Social Sector Expenditure | 5.5 | 5.4 | 6.6 | | 1. Education | 2.5 | 2.3 | 2.6 | | 2. Medical and Public Health | 0.7 | 0.5 | 0.6 | | 3. Family Welfare | 0.1 | 0.1 | 0.1 | | 4. Water Supply and Sanitation | 0.4 | 0.4 | 0.3 | | 5. Housing | 0.1 | 0.1 | 0.2 | | 6. Urban Development | 0.1 | 0.3 | 0.4 | | 7. Welfare of SCs, STs and OBCs | 0.3 | 0.3 | 0.4 | | 8. Labour and Labour Welfare | 0.1 | 0.0 | 0.1 | | 9. Social Security and Welfare | 0.2 | 0.3 | 0.6 | | 10. Nutrition | 0.1 | 0.1 | 0.2 | | 11. Relief on Natural Calamities | 0.1 | 0.2 | 0.2 | | 12. Food Storage and Warehousing | 0.1 | 0.1 | 0.1 | | 13. Rural Development | 0.7 | 0.6 | 0.8 | | 14. Others | 0.1 | 0.1 | 0.1 | | Source: Budget Documents. | Grants and Centrally Sponsored Social Sector Schemes Another vital source of financial resources for states is grants-in-aid from the centre8 which addresses issues relating to horizontal equity given differentials in tax bases of states. The fourteenth Finance Commission (FC-XIV) award being a milestone in the history of resource transfers to states led to a substantial rise in untied or unconditional transfers to states, facilitating flexible decision-making consistent with their own priorities. In terms of outlay, the growth in aggregate resource transfer to states in nominal terms (both statutory, as recommended by the Finance Commissions, and non-statutory) has decelerated in 2017-18 (RE) after peaking in 2016-17, although as a proportion to GDP it has been rising since 2015-16 (Chart 8). 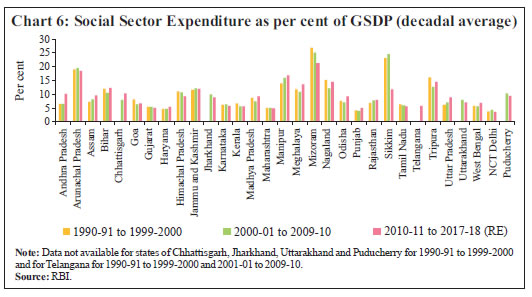 An important source of non-statutory transfers is the centrally sponsored schemes (CSS)9. Notwithstanding the progressive reduction in the number of CSS programmes over the years from a high of 360 by the end of the ninth plan in 2002 to 66 after the restructuring in 2013-1410 and further to 28 in 2016-1711, the outlays under these schemes have been steadily increasing from 0.4 per cent of GDP in 2001-02 (RE) to 1.7 per cent of GDP in 2017-18 (RE).
SDG Indicators: Trends Against the backdrop of these social sector expenditure trends across states, SDG outcome indicators have been examined in brief in a state-wise framework. This analysis speaks of the issues of large-scale inter-state inequalities and geographic differences in provision of health and education services that have been highlighted as major contributory factors to India’s low human development (HDR 2016). Gross Enrolment Ratio (GER)12 In terms of gross enrolment, which is the most widely used education indicator (SDG 4), enrolment at primary and upper primary levels at present is high among most states and it significantly exceeds that of secondary enrolment levels in almost all of them (Chart 9). While there has been a movement towards higher enrolment in secondary levels in recent years, its level at around 80, on an average, causes states to fall short of the SDG target of full enrolment. Inadequate faculty resources, poor school facilities at higher education levels, low access to inexpensive support services, inadequate vocational training options and uncertain benefit-to-cost ratios in comparison to the effort needed results in absenteeism and discontinuation at higher levels of education. 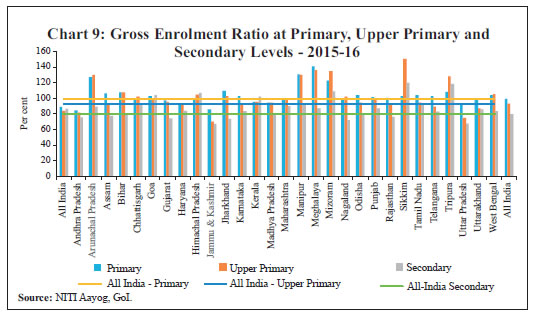 Considering the slow-moving nature of the outcome variables, the decadal averages have been analysed across states. While primary GER has shown maximum improvement during the 1990s, enrolment at the upper primary levels has improved during 2000s13 (Chart 10). The secondary GER that had remained close to 50 till the 2000s has shown significant improvement during the current decade. Enrolment levels are often not a true reflection of actual education standards and learning among students. Despite high enrolment ratios, particularly at primary levels, absenteeism and low retention rates are a common feature leading to lower learning levels as well. The proportion of children in Standard V who can read a Standard II text is below 50 per cent for many states, with the ratio declining between 2014 and 2016 for some of them (ASER 2016) (Chart 11). Infant Mortality Rate14 The infant mortality rate (IMR) is the indicator that captures various administrative and social lacunae in the provision of pre and post-natal care for mother and child, lack of proper paramedical resources, medical negligence and lack of family planning. As such, it is an important indicator to assess SDG 3 on good health and well-being. No major changes have been observed in the trends in this indicator across the first two decades – the 1990s and the 2000s – for most states; however, in the current decade so far, there is perceptible improvement (Chart 12). A few states (Kerala, Manipur and Nagaland) remain close to the SDG target of 12 per 1000 live births. Maternal Mortality Rate Unlike IMR, maternal mortality rates (MMR) - another indicator to assess SDG 3 - have witnessed overwhelming changes. There has been a general decline in MMR for most states which had high MMR to start with. Bihar, Kerala Madhya Pradesh, Rajasthan, Uttar Pradesh and West Bengal have shown large improvements, with their MMRs reducing by more than half across almost three decades (Chart 13). To sum up, notwithstanding the progress in the education and health SDG indicators over the last few decades, India needs to work harder to achieve the SDG targets. Even while outcome levels remain modest, there are substantial variations across states. The overall modest levels of achievement on the SDGs front can be a manifestation of relative variation in social sector expenditure across states that has been explored in a cross-state analysis in the subsequent section.
Section IV
Social Sector Expenditures and SDG Indicators: The Link From a policy perspective, a healthy and educated citizenry is an asset to democratic institutions.15 Theoretical and empirical estimates also support the growth enhancing role of human capital formation for India (Annex 4). With the role of human capital formation being firmly established, it may be pertinent to empirically validate whether social sector expenditures contribute towards human capital formation via improving SDG outcomes. This has been intensively examined in cross-country empirical frameworks, but the results are varied (Filmer and Pritchett, 1999; Gupta et al., 2002; Gupta and Verhoven, 2001). Given this lack of consensus in the literature on productivity of social sector expenditures, efforts have gone into establishing a long-run relationship between economic growth and social expenditures such as education, health and social security/welfare (Alam et al., 2010). For the period 1985-2001, panel data analysis for Indian states suggests that public spending on education has been more productive than that on health (Kaur and Misra, 2003). More recent studies have incorporated the inherent linkages between the health status of children and their educational achievements in India through a simultaneous equation framework, yielding the finding that poor health status as proxied by high infant mortality is responsible for lower enrolment rates and high dropout rates at the primary level (Bhakta, 2014). Moreover, states appear to be spending their resources more efficiently on education than on health, with governance16 across states playing an important role in determining efficiency differentials (Mohanty and Bhanumurthy, 2018). Decadal analysis of social sector expenditures and SDG indicators suggests that states’ spending on education seems to have worked towards improving enrolment only at the primary level and somewhat at the upper primary level over the decades (Chart 14). However, the same cannot be said for enrolment at the secondary level and overall learning levels among students (as provided by the proportion of children of Standard V who can read a standard II level text), hinting at role of other factors and also indicating a desirable shift in focus of education expenditures from primary to secondary enrolment and further towards improving quality of education. With regard to health expenditures, they seem to have worked in reducing IMR across decades (Chart 15). Given the rationalisation of centrally sponsored schemes as well as their improved efficiency post 2000s, an attempt has been made to corroborate the results stated in the previous para by a scheme-wise analysis of currently operational CSS in an input-output indices framework. The analysis is conducted for important CSS that have seen reasonable/robust growth in their expenditures in the current decade, viz., Sarva Shiksha Abhiyan (SSA), National Rural Health Mission (NRHM), Mid Day Meal Scheme (MDMS), National Rural Drinking Water Programme (NRDWP) and Swachh Bharat Mission (SBM). The performance of five CSS have been measured through the construction of input and outcome indices for each scheme for all states and union territories with certain exemptions.17 Input indices for different states have been constructed by using the expenditure on each scheme as per equation 1.18 Given that output indicators are different for different CSS, the overall outcome index for each CSS is arrived at by taking the arithmetic mean of the range of output indices computed by using equation 2.
where, Index takes value between 0 to 1. The state-wise analysis throws up in general a positive relationship between the input and the outcome indicators for most CSS under consideration (Chart 16). Two CSSs which have shown strong and significant relationships between input and output indices are National Rural Health Mission (NRHM) and National Rural Drinking Water Programme (NRDWP). The NRHM shows favourable effects in Rajasthan, Tamil Nadu, Karnataka, Andhra Pradesh, Uttarakhand and Maharashtra, with improvement in health indicators such as number of institutional deliveries, infant mortality rates, maternal mortality rates, medical staff and specialists as well as number of hospitals. The NRDWP has also helped in improving availability of potable water. Other schemes, viz., the Sarva Shiksha Abhiyan (SSA) and Swachh Bharat Mission (SBM) are also showing a positive correlation, though insignificant. As regards SBM, the low significance of the correlation co-efficient may be attributed to the fact that it was just launched in 2014 and may require some more time to visibly show the outcomes. Section V
Social Sector Expenditures and Outcomes: Evidence of Convergence across States As witnessed in section III, there are large divergences across states with respect to their SDG outcomes, necessitating differential focus across states. Considering that the proportion of children in the age group 0-14 years is higher for certain states than their respective population shares, the need to harness the demographic dividend could be more pressing in these states vis-à- vis others. Convergence/catching up across States An attempt has been made to analyse whether gaps in social sector expenditures and outcome indicators have narrowed over the years, thus helping the process of convergence across states and reducing inequality among them. The idea of ‘beta convergence’ - that poor economies grow faster than rich ones - is popularly used to test convergence across nations and sub-national entities.20 In the available empirical literature, the beta convergence methodology has been applied to study regional divergences in India (Ghosh et al., 1998), spatial convergence of public expenditure (Garg, 2015), and fiscal convergence across states (Raut, 2017). The hypothesis being tested is that there is convergence in terms of SDG indicators of states for education and health if initially poor performing states (i.e., low value of indicators) grow at a faster rate than high performers. The econometric estimation for this beta convergence involves specification of the following cross state equation: where T is the length of time interval, Yit is value of the indicator of state i at time t, and Yi0 is the the value of the indicator at the initial time period, thus, y axis in effect measures the growth rate of the outcome indicator. Convergence (or divergence) of an indicator depends on the value of β – a negative value refers to convergence while a positive value shows divergence (Raut, 2017). Taking the base year as 2005-06 and calculating average annual growth rates till 2015-16, it is observed that the SDG indicators are converging (Chart 17, Table A6.1 of Annex 6). For health, the infant survival rate (ISR) - a variant of the infant mortality rate (IMR) - is taken so as to make it a positive indicator of health which satisfies the above specification with negative β signifying convergence. ISR is obtained by the following formula: The scatterplot diagram of annual average growth rates of ISR versus the initial level of ISR (2005-06) shows negative correlation, implying spatial convergence (Chart 17). The ISR for states which were not doing well in terms of health criteria, is growing faster than for those that were doing well initially. States are achieving higher levels of ISR over time; states with relatively high IMR/low ISR in 2005 such as Odisha, UP have the highest growth rates. Similar analysis for the education outcome indicator, i.e., primary net enrolment ratio also confirms evidence of convergence, which is particularly high for Jharkhand and Bihar. 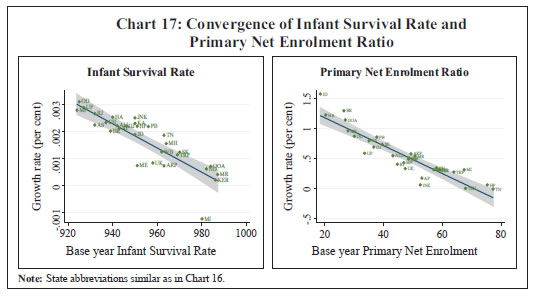 Thus, using this standard beta convergence methodology, socio-economic indicators are observed to have exhibited convergence between 2005-06 and 2015-16, implying that states which have fallen behind in terms of indicators have grown at a faster rate and caught up with the better performing states. This phenomenon has been observed in both development indicators as well as in public expenditure under various socio-economic heads and is immune to addition of other control variables like per capita income growth and share of education/health expenditure in GSDP (Table A6.2 of Annex 6). Inequality across States While the empirical literature has largely focussed on cross-country impacts of social sector spending on income inequality (Anderson et al., 2017; Haile and Niño-Zarazúa, 2017), the effects of social sector spending on inequality across states in terms of social sector outcome has not received adequate attention. This lacuna is particularly acute for India, where interest has been drawn to the estimation of health inequality and its relationship with income inequality (Joe et al., 2008) or assessing inequality within a particular state, across districts or between different spending groups/gender (Bhadra, 2015, Chakraborty et al., 2013). Concentration curve21 (CC) has emerged as a standard tool to assess inequality. Inequality in health - in terms of health status or health care facilities - is one of the central problems of developing countries.22 As higher income is associated with better health status, it is likely that worsening of health indicators is largely concentrated among the poorer sections of society. Weak health status leads to reduction in productivity of workers as well as loss of income/wages. Besides, health care facilities provided by the private sector are costly and unaffordable by the poor, necessitating governmental provision. Health inequality is estimated using the standard concentration curve (CC) approach (O’Donnell et al., 2008). The CC essentially plots the cumulative infant mortality (in per cent) against the cumulative live births (in per cent) ranked by public expenditure on health to GSDP ratio in ascending order, i.e., going from lowest to highest. States are grouped into five categories – low spending; second; middle; fourth; and high spending. If the infant mortality rate is equally distributed across states, the concentration curve will coincide with the equality line. If poor health is concentrated in the low spending group, the health CC would lie above the equality line and distance between CC and equality line determines the degree of inequality, which can also be estimated through a Concentration Index (CI).23 For comparative purposes, CC and CI are estimated for 2005 and 2015. The CC suggests that between 2005 and 2015, inequality has changed gears from above to below the line of equality (Chart 18). In 2005, the CC was above the equality line, implying that lower infant mortality rates were largely concentrated in the higher spending states. In 2015, on the contrary, lower spending states appear to be catching up with higher spending states. This is substantiated by the substantial deviation of the concentration curve from the equality line in favour of lower spending states.
| Table 3: Mean Infant Mortality Rate, Ranked by Public Spending on Health | | Per 1000 births | | | 2005 | 2015 | | 1 | 2 | 3 | | Low Spending | 56.3 | 26.7 | | 2nd | 48.8 | 28.2 | | Middle | 48.2 | 44.7 | | 4th | 44.4 | 29.8 | | High Spending | 31.0 | 25.0 | The shift in the CC against the higher spending states was not on account of increase in IMR in these states, but due to a sharper reduction of IMR in low spending states during the decade (Table 3). While the middle spending states are still having high IMR notwithstanding some decline, the higher spending states were already at a low base, leading to shallower reduction in IMR. The findings suggest a change in the nature of inequality in 2015 vis-à-vis 2005. While in 2005, the inequality was essentially due to high infant mortality rate (IMR) in low spending states, this has changed in 2015, with inequality being essentially due to reduction in IMR for low spending states. A mapping of the average IMRs across spending quintiles reveals that there have been sharp gains in the first two quintiles (low spenders) and modest gains in the uppermost quintile (highest spenders). Section VI
Achieving SDG Targets in 2030: Current Gap and Future Resources As documented in the previous sections, there has been substantial progress with regard to achieving the social development goals along with evidence of convergence and catching up across states. Nevertheless, the gap to meet the SDG targets remains significant. An assessment of deviations in major social indicators from the desired SDG levels can provide a gauge of the size of improvement that states will have to undertake with regard to achieving SDG targets in the coming twelve years. In terms of educational indicators such as enrolment at primary level, several states have already attained the target, viz., Meghalaya, Manipur, Mizoram, Arunachal Pradesh among others. Likewise, states of Sikkim, Meghalaya, Mizoram, Manipur, Arunachal Pradesh and Tripura have achieved the target of middle level gross enrolment. Nevertheless, in terms of secondary enrolment, the gap still remains significant for most of the states except Sikkim, Tripura, Mizoram, Goa, Himachal Pradesh and Kerala (Chart 19). In terms of IMR, Manipur, Nagaland and Kerala have already attained the target level of 12 deaths per 1000 live births of infants. In terms of MMR, except Maharashtra, Tamil Nadu and Kerala, most of the states are far away from the SDG target of 70 per 100,000 live births (Chart 20). Thus, many states may have to make considerable efforts to narrow the gap between achievements and SDG targets in health. Drawing upon this gap analysis, an attempt has been made to estimate the likely resource requirements for attaining the SDG goals on health and education by 2030. Using the ordinary least squares (OLS) regression method, the relationship between real per capita spending by centre and states taken together on health and education and their respective outcome indices for the period 1999 to 2017 are estimated and the desired funding gaps (over and above baseline budget projections) are derived for the period 2018 to 2030. Health and education indices have been sourced from human development indices sub-components for health and education. Nominal expenditures are converted to real by using WPI indices (2011-12 base year). Population projections have been sourced from the medium variant of the United Nations. The models have been checked for suitable diagnostic checks, viz., serial correlation and other parameter stability. 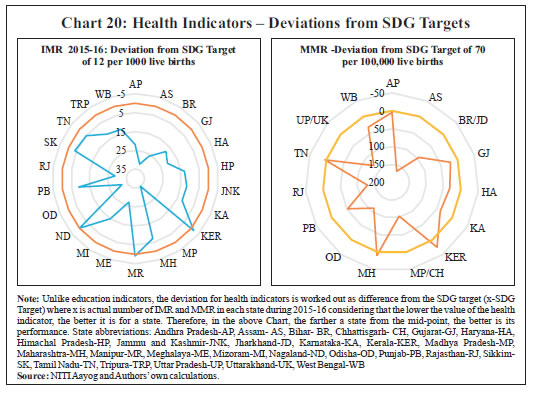 Based on our exercise, the incremental general government public expenditure24 required to achieve the 2030 targets for health and education are ₹12.1 trillion and ₹53.6 trillion, respectively. It may be noted that these estimates are in line with those estimated for India by a UNDP supported study by Bhamra et al., (2015) of ₹19 trillion and ₹46 trillion25 for health and education, respectively.26 Considering that secondary enrolment gap at present remains significant as highlighted in Chart 19 earlier, the focus going forward should be to route education expenditure more towards secondary enrolment and improvement of the learning levels. Given these additional financing requirements coupled with the recently observed fiscal stress of centre and certain state governments, it may be important to insulate such expenditures from getting crowded out by other committed expenditures. Furthermore, this also highlights the need to expand the fiscal space of centre and states substantially either via expenditure reprioritisation or innovative revenue-generating measures. Section VII
Concluding Observations Drawing on the analysis of the levels, trends, distribution and productivity of public expenditures in India (including spending under CSS) with respect to health and education, this paper finds that there has been a considerable progress in achieving SDGs, particularly in the current decade; yet we need to gear ourselves to meet the 2030 SDG targets. Empirical analysis in this paper supports the view that investment in human capital formation like education and health can contribute to higher growth. States’ social sector expenditures have contributed towards improvement in SDG outcomes over the decades justifying the need for higher social sector expenditures. The focus may have to be on improving learning levels among students, besides enrolment. More recently, higher spending on certain CSS schemes has favourably impacted the SDG indicators. A major comforting evidence from this paper is that inter-state variations among states in terms of both social sector expenditures and outcomes are narrowing, bringing about greater convergence. States with low expenditures and SDGs are catching up with the others, which augurs well for eventually boosting the effectiveness of social sector spending. The new equilibrium is closer to the SDG goals, though there is still a distance to cover as shown in the paper in terms of the current gaps between SDG outcome indicators and their respective targets. The additional financing requirement to meet the SDG targets by 2030 is estimated at ₹12.1 trillion and ₹53.6 trillion for health and education, respectively. Spending on education and health in India during 2016-17 was below the world average. Currently, there is an acute lack of balance in the allocation of public social expenditure between recurring costs and asset creation on one hand, and the disproportionate pre-emption by salary and maintenance expenditure, on the other. In the context of education, for instance, a reorganisation of expenditure towards better learning, vocational training and teachers’ training programmes may help in improving efficiency of public expenditure and quality of education. The Right to Education Act (2010) routed through the Sarva Shikhsha Abhiyan (SSA) has, in fact, sought to focus on non-salary expenditures and, therefore, should generate better results going forward, not just in terms of enrolment but also in terms of overall learning levels. Similarly, other efforts on achieving SDG targets need to expand on dimensions like efficiency and quality of service delivery. With regard to health expenditures, the Ayushman Bharat National Health Protection Scheme announced this year should, if implemented effectively, provide a circuit-breaker by helping more than 500 million people with insurance coverage of ₹5 lakh for each family. While persevering with fiscal consolidation, channelising spending towards SDGs might be critical. Stabilising and generating higher revenues through the goods and services tax (GST) while reprioritising expenditures towards social spending and improving their efficiency could help attain SDG targets.
References Abdih, Yasser, and Frederick L Joutz. (2008). “The Impact of Public Capital, Human Capital, and Knowledge on Aggregate Output.” IMF Working Paper No. 08/218. Acemoglu, Daron. (2009). Introduction to Modern Economic Growth. Princeton, N.J.: Princeton University Press. Alam, Shaista, Abida Sultana, and Mohammad S. Butt. (2010). “Does Social Expenditures Promote Economic Growth?: A Multivariate Panel Cointegration Analysis for Asian Countries.” European Journal of Social Sciences 14 (1): 44-54. Anand, Rahul, Magnus Saxegaard, and Shanaka J Peiris. (2010). “An Estimated Model with Macrofinancial Linkages for India.” IMF Working Paper No. 10/21. Anderson, Edward, Maria Ana Jalles D’Orey, Maren Duvendack, and Lucio Esposito. (2017). “Does Government Spending Affect Income Inequality?: A Meta-Regression Analysis.” Journal of Economic Surveys 31 (4): 961–987. ASER. (2016). Annual Status on Education Report. Pratham. Barro, Robert J. (1997). Determinants of Economic Growth: A Cross-Country Empirical Study. Cambridge, MA: MIT Press. Barro, Robert J. (2001). “Human Capital and Growth.” The American Economic Review 91 (2): 12-17. Becker, Gary, Elisabeth M Landes, and Robert T Michael. (1977). “An Economic Analysis of Marital Instability.” Journal of Political Economy 85 (6): 1141-87. Bernanke, Ben. (2006). “A Message from Chairman Bernanke.” Speech delivered at the Federal Reserve Bank of Dallas. July. Bhadra, Kaushik K. (2015). “Inequality Effects for Fiscal Policy: Analysing the Benefit Incidence on Health Sector in India.” NIPFP Working Paper No. 158. Bhakta, Runu. (2014). “Impact of Public Spending on Health and Education of Children in India: A Panel Data Simultaneous Equation Model.” Indira Gandhi Institute of Development Research WP-2014-049. Bhamra, Anshul, Harshini Shanker, and Zeenat Niazi. (2015). Achieving the Sustainable Development Goals in India: A Study of Financial Requirements and Gaps. United Nations Development Programme and Ministry of Environment, Forest and Climate Change, Government of India. Bhanumurthy, N R, H K Amarnath, Manish Prasad, Shiney Chakraborty, and Richa Jain. (2017). Divergences in Human Development Outcomes in Madhya Pradesh: The Role of Fiscal Policy and Governance. New Delhi: National Institute of Public Finance and Policy. Chakraborty, Lekha S., Yadawendra Singh, and Jannet Farida Jacob. (2013). “Analyzing Public Expenditure Benefit Incidence in Health Care: Evidence from India.” Levy Economics Institute of Bard College, Working Paper No. 748. De, Anuradha, and Tanuka Endow. (2008). “Public Expenditure on Education in India: Recent Trends and Outcomes.” Research Consortium on Educational Outcomes and Poverty (RECOUP) Working Paper No. 18. Collaborative Research and Dissemination (CORD). Filmer, Deon, and Lant Prichett. (1999). “The Impact of Public Spending on Health: Does Money Matter?” Social Science and Medicine 49: 1309-1323. Garg, Sandhya. (2015). “Spatial Convergence in Public Expenditure across Indian States: Implication of Federal Transfers.” Indira Gandhi Institute of Development Research, Mumbai Working Papers 2015-028. Ghate, Chetan, Radhika Pandey, and Ila Patnaik. (2013). “Has India Emerged? Business Cycle Stylized Facts from a Transitioning Economy.” Structural Change and Economic Dynamics 24: 157-172. Ghosh, Buddhadeb, Sugata Marjit, and Chiranjib Neogi. (1998). “Economic Growth and Regional Divergence in India, 1960 to 1995.” Economic & Political Weekly 33 (26): 1623-1630. Government of India (GoI). (2011), “Report of the Committee on Restructuring of Centrally Sponsored Schemes (Chairman Shri B.K. Chaturvedi).” Planning Commission, Government of India, September. Gupta, Sanjeev, and Marijn Verhoeven. (2001). “The Efficiency of Government Expenditure: Experiences from Africa.” Journal of Policy Modeling 23 (4): 433-467. Gupta, Sanjeev, Marijn Verhoeven, and Erwin R Tiongson. (2002). “The Effectiveness of Government Spending on Education and Health Care in Developing and Transition Economies.” European Journal of Political Economy 18 (4): 717–737. Haile, Fiseha, and Miguel Niño-Zarazúa. (2017). “Does Social Spending Improve Welfare in Low-income and Middle-income Countries?” Journal of International Development 30 (3): 367-398. Haveman, Robert, and Barbara Wolfe. (1994). Succeeding Generations: On the Effects of Investments in Children. Russel Sage Foundation. Human Development Report (HDR). (2016). Human Development Report 2016: Human Development for Everyone. United Nations Development Programme. International Monetary Fund (IMF). (2018). “Fiscal Monitor.” April. Joe, William, U S Mishra, and K Navaneetham. (2008). “Health Inequality in India: Evidence from NFHS 3.” Economic & Political Weekly 43 (31): 41-47. Jung, Hong-Sang, and Erik Thorbecke. (2003). “The Impact of Public Education Expenditure on Human Capital, Growth, and Poverty in Tanzania and Zambia: A General Equilibrium Approach.” Journal of Policy Modeling 25 (8): 701-725. Kaur, Balbir, and Sangita Misra. (2003). “Social sector expenditure and attainments: An Analysis of Indian states.” Reserve Bank of India Occasional Papers 24 (1 & 2): 105-43. Kaur, Balbir, Sangita Misra, and Anoop K.Suresh. (2013). “Cyclicality of Social Sector Expenditures: Evidence from Indian States.” Reserve Bank of India Occassional Papers 34 (1 & 2). Leeuwen, Bas van. (2007). Human Capital and Economic Growth in India, Indonesia, and Japan: A Quantitative Analysis, 1890-2000. Utrecht: Utrecht University. Lucas, Robert Jr. (1988). “On the Mechanics of Economic Development.” Journal of Monetary Economics 22 (1): 3-42. Mohanty, Ranjan K, and N.R Bhanumurthy. (2018). “Assessing Public Expenditure Efficiency at Indian States.” NIPFP Working Paper No. 225. Murphy, Gavin, and Iulia Traistaru-Siedschlag. (2007). “The Effects of Human Capital on Output Growth in ICT Industries: Evidence from OECD Countries.” Economic and Social Research Institute (ESRI) WP184. Musgrave, Richard. (1996). “The Role of the State in Fiscal Theory.” International Tax and Public Finance 3 (3): 247-258. O’Donnell, Owen, Eddy van Doorslaer, Adam Wagstaff, and Magnus Lindelow. (2008). Implementation, Analyzing Health Equity Using Household Survey Data: A Guide to Techniques and Their Implementation. Washington D.C.: The World Bank. Pelinescu, Elena. (2015). “The Impact of Human Capital on Economic Growth.” Procedia Economics and Finance 22: 184 – 190. Raut, Dirghau Keshao. (2017). “Sigma and Beta Convergence in Revenues and Expenditure across Indian States.” VISION: Journal of Indian Taxation 4 (2): 39-63. Reserve Bank of India. (2018). “Handbook of Statistics on Indian States.” Romer, Paul M. (1990). “Human Capital and Growth: Theory and Evidence.” Carnegie-Rochester Conference Series on Public Policy 32: 251-286. Sachs, Jeffrey, Guido Schmidt-Traub, Christian Kroll, David Durand- Delacre, and Katerina Teksoz. (2017). “Global Responsibilities: International spillovers in achieving the goals.” SDG Index and Dashboards Report 2017. New York: Bertelsmann Stiftung and Sustainable Development Solutions Network (SDSN). Solow, Robert M. (1956). “A Contribution to the Theory of Economic Growth.” Quarterly Journal of Economics. Oxford Journals 70 (1): 65-94. UNDP-World Bank. (2016). Transitioning from the MDGs to the SDGs. United Nations Development Programme (UNDP) and the World Bank Group (WBG). UNESCAP. (2017). Achieving the Sustainable Development Goals in South Asia: Key Policy Priorities and Implementation Challenges. United Nations Economic and Social Commission for Asia and Pacific, May. Wagstaff, Adam, Pierella Paci, and Eddy van Doorslaer. (1991). “On the Measurement of Inequalities in Health.” Social Science & Medicine 33 (5): 545-557. Wei, Min. (2004). “Human Capital, Business Cycles and Asset Pricing.” Working Paper. Colombia University. Wolla, Scott. (2016). “Invest in Human Capital to Build a Better Future.” In Economic Literacy for Life: Today’s Lessons = Tomorrow’s Financial Stability and Success, 2016 Annual Report. Federal Reserve Bank of St. Louis.
Annex 1: Implementing Strategy of SDGs by Select Countries | | Country | SDGs Implementing Strategy | | 1. | Bangladesh | Country identified nine of eleven goals of SDGs in its 7th Five Year Plan (2016-2020); the remaining two goals are embedded in the SDG targets but have been elevated as priorities. | | 2. | Chad | Established a structure, or coordination body under the auspices of the Prime Minister’s Office (PMO), with the involvement of sectoral ministries, including the Ministry of Finance and Foreign Affairs. | | 3. | Colombia | The President declared a law to align their national development plan with the SDGs. A high-level commission (HLC) was constituted, chaired by the national planning department with ministerial/other sectors support to produce an analysis of the existing gaps in SDG implementation. | | 4. | Ethiopia | The Office of the First Lady partnered with government ministries and NGOs to empower girls and women to develop entrepreneurial skills and provide basic training to connect them with the export market. | | 5. | Germany | A process to align its National Sustainability Strategy to the Agenda 2030 goals and targets started and annual progress report takes it into account. SDG is being implemented by the Federal Cabinet, the State Secretaries’ Committee, the Sustainable Development Council and the Parliamentary Advisory Council. | | 6. | Ghana | A high level inter-ministerial committee has been established for SDGs implementation. A platform consisting of 18 clusters; one for each of the 17 goals and an additional one for advocacy on the SDGs has been launched to promote collaboration and experience sharing among different sectoral groups to build synergy. | | 7. | India | The responsibility for overseeing SDG implementation has been assigned to the NITI Aayog, which has mapped goals and targets to various nodal ministries as well as flagship programmes with draft indicators developed by the Ministry of Statistics and Programme Implementation. State governments are also engaged in developing roadmaps for achieving the SDGs, with several of them having already published their plans. | | 8. | Mexico | A Technical Committee has been set up in the President’s Office to follow-up and monitor the MDGs. This Committee monitors the SDGs. | | 9. | Sweden | A commission has been set up to facilitate the integration of the SDGs into a comprehensive national action plan and promote the exchange of information and knowledge between the various stakeholders. | | 10. | The United States of America | An inter-agency process that includes agencies and departments has been put in place for the necessary policies and actions for SDG implementation. It addresses both international and domestic issues and meetings are organised through the White House, and involve the National Security Council and Domestic Policy Council. | | 11. | Uganda | The Office of the First Lady founded a National Strategy for the Advancement of Rural Women in Uganda and plans to expand and scale agriculture programmes in pursuit of a national agriculture plan that emphasizes women’s empowerment. | Source: (i) http://www.worldbank.org/
(ii) http://www.thefinancialexpress-bd.com. |
| Annex 2: Central Government Allocation for Major CSS over the years | | (₹ Billion) | | Centrally Sponsored Schemes | 2015-16 | 2016-17 | 2017-18 (RE) | 2018-19 (BE) | Average 2015-19 | | 1 | 2 | 3 | 4 | 5 | 6 | | 1. Sarva Shiksha Abhiyan (SSA) | 217 | 217 | 235 | 261 | 232 | | 2. National Rural Health Mission (NRHM) | 183 | 198 | 255 | 243 | 220 | | 3. Integrated Child Development Services (ICDS) | 168 | 159 | 200 | 231 | 189 | | 4. Mid Day Meal Scheme (MDMS) | 91 | 95 | 100 | 105 | 98 | | 5. National Rural Drinking Water Programme (NRDWP) | 44 | 60 | 71 | 70 | 61 | | 6. Swachh Bharat Mission (SBM) | 75 | 126 | 193 | 178 | 143 | | 7. Mahatma Gandhi National Rural Employment Guarantee Scheme (MGNREGS) | 373 | 482 | 550 | 550 | 489 | | 8. National Social Assistance Progam (NSAP) | 86 | 89 | 87 | 100 | 90 | | 9. Umbrella Scheme for Development of Scheduled Castes (USDSC) | 42 | 49 | 51 | 52 | 48 | | 10. Umbrella Scheme for Development of Scheduled Tribes (USDST) | 29 | 33 | 35 | 38 | 34 | | 11. Pradhan Mantri Awas Yojna (PMAY) | 116 | 210 | 290 | 275 | 223 | | 12. Pradhan Mantri Gram Sadak Yojna (PMGSY) | 183 | 179 | 169 | 190 | 180 | | Source: Union Budget Documents. |
| Annex 3: Current Centrally Sponsored Schemes | | Serial No. | Centrally Sponsored Schemes/ Ministry/ Department | | (A) | Core of the Core Schemes | | 01 | National Social Assistance Program | | 02 | Mahatma Gandhi National Rural Employment Guarantee Program | | 03 | Umbrella Scheme for Development of Scheduled Castes | | 04 | Umbrella Programme for Development of Scheduled Tribes | | 05 | Umbrella Programme for Development of Minorities | | 06 | Umbrella Programme for Development of Other Vulnerable Groups | | (B) | Core Schemes | | 07 | Green Revolution | | 08 | White Revolution | | 09 | Blue Revolution | | 10 | Pradhan Mantri Krishi Sinchai Yojna | | 11 | Pradhan Mantri Gram Sadak Yojna | | 12 | Pradhan Mantri Awas Yojna (PMAY) | | 13 | National Rural Drinking Water Mission | | 14 | Swachh Bharat Mission | | 15 | National Health Mission | | 16 | National Education Mission | | 17 | National Programme of Mid-Day Meal in Schools | | 18 | Umbrella ICDS | | 19 | Mission for Protection and Empowerment for Women | | 20 | National Livelihood Mission- Ajeevika | | 21 | Jobs and Skill Development | | 22 | Environment, Forestry and Wildlife | | 23 | Urban Rejuvenation Mission: AMRUT and Smart Cities Mission | | 24 | Modernisation of Police Forces | | 25 | Infrastructure Facilities for Judiciary | | 26 | Border Area Development Programme | | 27 | Shyama Prasad Mukherjee Rurban Mission | | 28 | Rashtriya Swasthya Bima Yojna | | Source: Union Budget Document. |
Annex 4: Role of Human Capital: Theoretical Underpinningsa Seminal work of Lucas (1988) and Romer (1990) has firmly established the role of human capital accumulation in endogenous growth models. Including human capital in the Solow model (Solow, 1956) has shown that higher human capital accumulation is associated with higher physical capital accumulation (Acemoglu, 2009). There is also an influential strand of literature that illuminates the social or non-market effects of human capital accumulation, establishing a strong positive link between an individual’s own education attainment and education of the next generation, and own health and family health status (Haveman and Wolfe, 1994), improving fertility choices, reducing participation in criminal activities and enhancing marriage stability (Becker et al., 1977). Furthermore, a simple real business cycle (RBC) model incorporating human capital provides the wherewithal for generating estimates of the human capital impact on output and consumption. Empirical estimates of human capital impact on output proliferate in the literature. Employing a panel of 28 countries, it is observed that increasing the number of employees with secondary education by 1 percentage point raises output by 0.04 per cent (Pelinescu, 2015). In the case of information and communication technology (ICT) industries, in a sample of 20 OECD countries for the period 1980-2002, a unit rise in human capital is found to increase output by 0.2 (Murphy and Traistaru-Siedschlag, 2007). The impact of human capital stock on output in India is estimated at 0.02 (Leeuwen, 2007). Given the heterogeneity of human capital measures used, the empirical estimates of human capital impact on output have ranged between 0.02 and 0.2 depending on the definition of human capital that is used. An attempt is made here to update the estimate of human capital multiplier for India by providing micro-foundations to the concept. A two-sector business cycle modelb is thus envisaged in which a representative agent accumulates physical (k) and human capital (h) according to the following laws of motion: The two major equations emanating from the first order condition of the optimisation exercise are the intertemporal Euler equation and the intratemporal labour supply condition. The Euler’s equation depicts the trade-off between lower consumption today in order to achieve higher levels of consumption tomorrow. The labour supply equation states that effective labour supply varies positively with wages but negatively with consumption. The firm’s optimisation problem is to maximise profits subject to a technology constraint given below: zt is the exogenous productivity shock that follows an autoregressive stochastic process. Finally, the aggregate resource constraint that closes the economy is given as: Model Calibration The model parameters are calibrated to data or information from past studies. The depreciation parameters for capital are set at 0.025 and 0.0125, as in Anand et al. (2010) . The share of capital in output is fixed at 0.25, while the discount factor is 0.99. The returns to scale parameter is set at 0.05 in line with Wei (2004). As a first step to solving the non-linear theoretical model, the model is linearised around a non-stochastic steady state. This produces a set of equations involving leads and lags of endogenous variables and exogenous variables such as Where x={c,u,e,h,k,r,w} is a vector of endogenous variables, g={z,m} is a vector of exogenous variables and F, G, H, L and M are vectors of non-linear parameters. The system of equations has a recursive solution of the form Impulse Responses The model is simulated by computing the Taylor approximations of the decision and transition functions generating impulse responses to the two shocks. A one standard deviation shock to human capital in the model leads to higher output through the production function, consumption and gradual rise in investment (Chart A4.1). Output rises by 0.1 unit and consumption by 0.25 unit on impact (impact multiplier). Hours worked decline due to the wealth effect of higher returns on physical capital. The estimate of the short-term impact of human capitalc on output for India, as estimated above at 0.1, is within the range of estimates in the literature for similar studies. While empirical estimates of the impact multiplier of human capital on output, consumption and investment turn out to be small, the total effect of human capital (taking into account both direct and indirect impact) could be higher. In human capital driven endogenous growth models, the estimated long run elasticity of output with respect to human capital or skill adjusted labour is higher (Abdih and Joutz, 2008; Lucas, 1988).
Annex 5: Empirical Results of Section IV | Table A5.1: Regression Results for Social Sector Outcomes and Expenditures (Ref: Charts 14 and 15) | | Dependent Variables | Constant | Education expenditure- GSDP | GSDP growth | R-squared | No. of cases | | (1) Primary GER | 87.80*** | 5.396*** | 0.0139 | 0.29 | 72 | | | (8.30) | (5.29) | (0.02) | | | | (2) Upper Primary | 50.20*** | 1.198 | 1.927* | 0.10 | 72 | | | (4.22) | (1.04) | (2.40) | | | | (3) Secondary GER | 29.65** | -0.832 | 1.352 | 0.05 | 71 | | | (2.69) | (-0.77) | (1.78) | | | | (4) Learning outcome | 57.35*** | -0.625 | -0.0441 | 0.01 | 52 | | | (8.40) | (-0.66) | (-0.13) | | | | | Constant | Medical expenditure- GSDP | GSDP growth | R-squared | No. of cases | | (5) IMR | 78.51*** | -9.895** | -1.570 | 0.18 | 84 | | | (6.33) | (-3.38) | (-1.79) | | | t statistics in parentheses
* p < 0.05, ** p < 0.01, *** p < 0.001 |
| Table A5.2: Correlation Coefficient between Input and Output Indices of Select CSS (Ref: Chart 16) | | | SSA | NRHM | SBM | MDMS | NRDWP | | Correlation Coefficient | 0.15 | 0.82*** | 0.16 | 0.21 | 0.58*** | | * p < 0.05, ** p < 0.01, *** p < 0.001 |
Annex 6: Empirical Results of Section V Table A6.1: Convergence Analysis of Social Expenditure and Indicators
(without control variables) | | | Constant | Slope (beta coefficient) | R- squared | N. of cases | | (1) Real per capita | -1.418* | -2.808*** | 0.48 | 26 | | Expenditure on Education | (-2.39) | (-4.69) | | | | (2) Real per capita | -4.900*** | -2.956*** | 0.49 | 26 | | Expenditure on Health | (-4.23) | (-4.80) | | | | (3) Upper Primary | 1.644*** | -0.023*** | 0.83 | 30 | | Net Enrolment Ratio | -17.06 | (-11.82) | | | | (4) Gender Parity Index | 0.078*** | -0.001*** | 0.47 | 22 | | | -4.47 | (-4.22) | | | | (5) Infant Survival Rate | 0.044*** | -0.000*** | 0.73 | 29 | | | -8.92 | (-8.59) | | | t statistics in parentheses
* p < 0.05, ** p < 0.01, *** p < 0.001 |
| Table A6.2: Convergence Analysis (using control variables: growth in per capita income and share of expenditure in GSDP) | | | Constant | Slope (beta coefficient) | Growth in per capita income | Share of education/ medical expenditure in GSDP | R-squared | N. of cases | | (1) Upper Primary | 1.574*** | -0.021*** | -0.006 | 0.053 | 0.87 | 26 | | Net Enrolment Ratio | (8.60) | (-11.54) | (-0.48) | (1.68) | | | | (2) Gender Parity Index | 0.070*** | -0.001*** | -0.001 | 0.001* | 0.61 | 20 | | | (4.71) | (-4.49) | (-0.92) | (2.19) | | | | (3) Infant Survival Rate | 0.038*** | -0.000*** | 0.000 | -0.000* | 0.803 | 26 | | | (7.15) | (-6.62) | (0.68) | (-2.60) | | | t statistics in parentheses
* p < 0.05, ** p < 0.01, *** p < 0.001 |
|