Since the assessment presented in the last month’s Article, more evidence has been turned in to show that the Indian economy is pulling out of COVID-19’s deep abyss and is reflating at a pace that beats most predictions. Although headwinds blow, steadfast efforts by all stakeholders could put India on a faster growth trajectory. Over the month gone by, more evidence has been turned in to show that the Indian economy is pulling out of COVID-19’s deep abyss and is breaking out amidst winter’s lengthening shadows towards a place in the sunlight. First, the National Statistical Office’s (NSO) end-November release delivered a pleasant surprise – the pandemic-imposed retrenchment of Q1:2020-21 turned out to be much shallower in Q2 and the economy is reflating at a pace that beats most predictions (Chart 1). Second, the update of the economic activity index (EAI) in the nowcasting assessment presented in last month’s Bulletin (Kumar, 2020) indicates that real GDP growth is expected to break out into positive territory in Q3 - albeit, to a slender 0.1 per cent. Third, the fourth bi-monthly resolution of the monetary policy committee (MPC) did maintain status quo on the policy rate and stance; but a powerful message was conveyed: growth projections - the intermediate target under a flexible inflation targeting framework and the most potent communication tool - were revised upwards by 200 basis points from October and if they hold, the Indian economy will clock a growth rate of 14.2 per cent in the first half of 2021-22 on top of 0.4 per cent in the second half of 2020-21 (Chart 2). 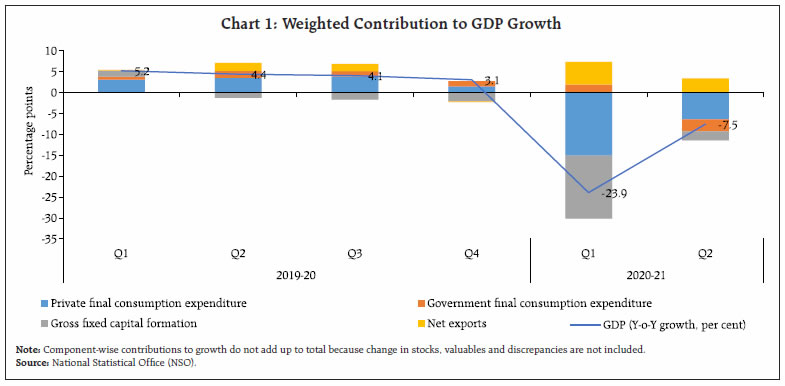 Two important forces are conspiring to bless this turning of the page on the virus. First, India is bending the COVID infection curve: since mid-September, barring localised surges, infections are slanting downwards week after week, and the recovery rate1 is nudging 95 per cent. A battery of vaccine candidates has successfully hit not only trial status but also suitability for transportation/trials/usage in India (Table 1). Second, it is now getting clearer that there is a system to the fiscal stimulus, a ‘method’ if you will. Starting out with liquidity/guarantee and cash/kind support to the economy - the need of the hour when the pandemic struck and displaced crores from their lives and livelihoods - it is transiting in a calibrated fashion to supporting investment and consumption demand. The fiscal measures have been sequenced in a designed shift in focus from consumption expenditure in Pradhan Mantri Garib Kalyan Package (PMGKP) to investment expenditure in Aatma Nirbhar 2.0 and 3.0 (Chart 3). On the whole, the above-the-line fiscal stimulus will likely boost growth by close to 2 per cent of GDP in 2020-21 (see Box I in the subsequent Article on Government Finances). In other words, it is prudent to look beyond the volatility inherent in high frequency indicators. Companies are doing so already – an analysis of 12-months ahead forward earnings reveals improvement in the outlook for a large number of companies (Chart 4). Sectors such as auto and capital goods, which had been hit hard by the lockdown are expecting a turnaround in forward earnings. Healthcare, information technology (IT) and fast moving consumer goods (FMCG) companies are sighting stronger earnings outlook. Moreover, intrinsic strength in the manufacturing and services sectors is being built as debt servicing capacity is getting reinforced and leverage is being brought down. India’s farm sector is also forging ahead, backed by path-breaking marketing reforms. There are admittedly headwinds that can potentially circumscribe India’s tryst with a brighter future – good news still shines through in the sift of high frequency indicators to which we now turn. The article is organised into five Sections. Section II assesses the current global economic and financial market developments. Section III extracts underlying trends embedded in high frequency indicators. Section IV reviews evolving financial market conditions, and the last Section sets out concluding observations. 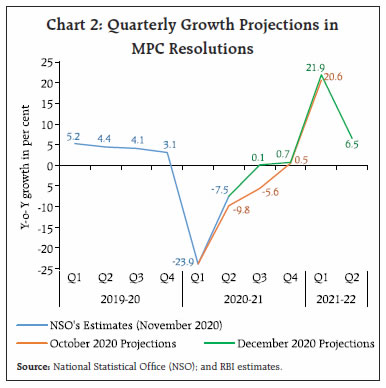
| Table 1: COVID-19 Vaccines | | Company | Type | Doses | How effective | Storage | | Oxford Uni-AstraZeneca | Viral Vector (genetically modified virus) | 2 | 62-90% | Regular fridge temperature | | Moderna | RNA (part of virus genetic code) | 2 | 95% | -20°C upto 6 months | | Pfizer-BioNTech | RNA | 2 | 95% | -70°C | | Gamaleya (Sputnik V) | Viral Vector | 2 | 92% | Regular fridge temperature | | CanSinoBIO (Ad5-nCoV) | Recombinant adenovirus type 5 vector | | | | | Sinopharm: Beijing Institute of Biological Products, Wuhan Institute of Biological Products | Inactivated SARS-CoV-2 (vero cells) | | | | | CoronaVac Sinovac | Inactivated SARS-CoV-2 | | | | | BBV152 (Covaxin) Bharat Biotech, Indian Council of Medical Research | Inactivated SARS-CoV-2 | | | | | NVX-CoV2373[145] Novavax | SARS-CoV-2 recombinant spike protein nanoparticle | | | | | Source: World Health Organisation (WHO). |
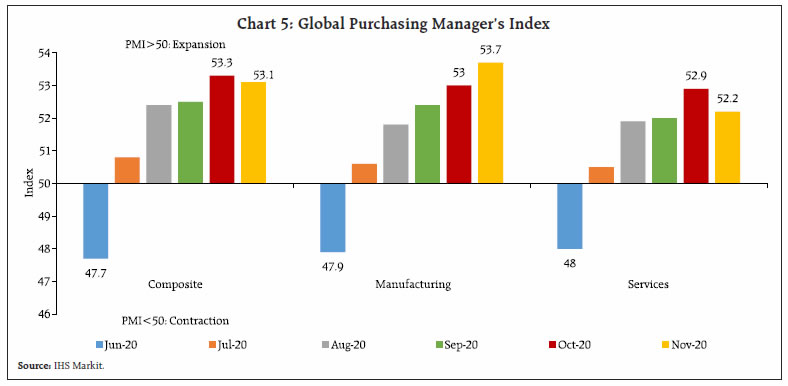
II. The Global Setting Even as second waves of virus outbreaks checked the pace of the global recovery, the outcome of the US elections and the news about COVID-19 vaccines being more than 90 per cent effective in late-stage clinical trials ignited global markets. Risk appetite has roared back, sending deluges out of safe haven assets into stock markets and emerging market economies. There is growing confidence that an end to the health pandemic is in sight and prospects for the global economy are finally looking up on a viable basis. At the same time, recognition of logistical challenges in deploying vaccines widely around the world has tempered this robust optimism. On November 19, the United Nations Conference on Trade and Development (UNCTAD) sounded a sombre note of caution - a viable vaccine will not halt the spread of economic damage, which will be felt long into the future, especially by the poorest and most vulnerable, as an additional 130 million people could descend into extreme poverty. 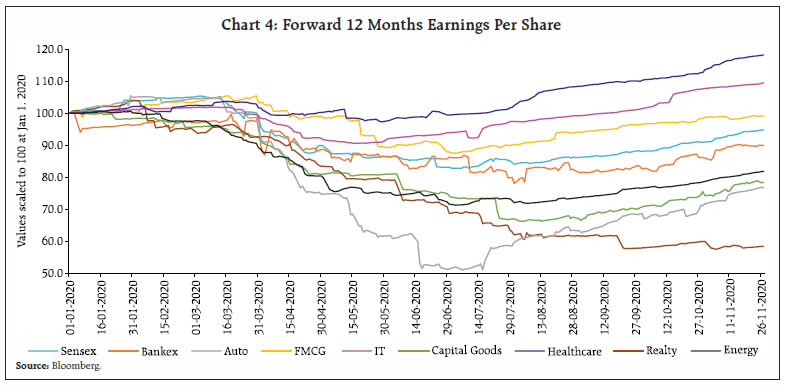 On the assumption that renewed virus outbreaks remain contained, and that the prospect of a widely available vaccine towards the end of 2021 helps to support confidence, the December 2020 Economic Outlook of the Organisation for Economic Cooperation and Development (OECD) projects global GDP to decline by 4.2 per cent in 2020, followed by a gradual but uneven recovery that raises global GDP by 4.2 per cent in 2021 and by 3.7 per cent in 2022 (Table 2). By the end of 2021, global GDP would be at pre-pandemic levels, but performance would differ markedly across the main economies. On India, the OECD has noted that one of the world’s earliest and toughest lockdowns helped to slow the diffusion of the virus. Real GDP is expected to contract by 10 per cent in 2020-21 and rebound thereafter but it may take almost two years for GDP to get back to pre-pandemic levels. Digital technologies are seen as a bright spot. Overall, the global economic outlook still remains uncertain, with the recovery in activity hesitant. Reflecting these vicissitudes, the global composite purchasing managers’ index (PMI) moderated to 53.1 in November 2020 from a two-year high of 53.3 a month ago (Chart 5). Manufacturing output expanded for the fifth successive month in November. Global service sector business activity rose at a slightly slower rate than in October. Consumer services contracted for the tenth consecutive month. Reflecting the disruptions imposed by the second wave of infections and the hit to demand, global trade has been adversely impacted. According to the UNCTAD, global trade, which plunged 19 per cent year-on-year (y-o-y) in Q2 2020, remained in contraction in Q3 with a decline of about 4.5 per cent. Shallower contractions are expected to continue in Q4, with a decline of about 3 per cent on a similar basis, unless economic activity deteriorates further into a widely expected double dip. Crude oil prices, which have been losing steam since September on waning demand prospects, picked up in November on the back of ‘vaccine optimism’ and on possibilities of extension of production cuts by Organisation of the Petroleum Exporting Countries (OPEC) plus in the near term. Averaging US$ 43.23 per barrel in November 2020, they traded 6.8 per cent above their level a month ago. Gold prices ticked up in early November on uncertainty related to the US presidential elections and surges in infections. Over the rest of the month, however, prices corrected and declined by 5.4 per cent during the month as a whole as the vaccine trials and upbeat US manufacturing data triggered risk-on sentiments. On a year-to-date basis, i.e., over end-December 2019, gold prices have increased by 17.1 per cent. 
 Equity markets, which were alternating up to early November between brief rallies and sharp sell-offs, surged past previous highs on vaccine developments, with investor appetite rotating towards sectors that had been severely hit by the pandemic, on top of the enthusiasm created by improving business conditions (Chart 6). Valuations were stretched during the month and diverged from underlying macroeconomic conditions as well as from the state of corporate finances. In the corporate market segments, credit spreads compressed further, approaching pre-pandemic lows amidst some volatility. On the other hand, banks tightened lending standards. With central bank support being maintained, government bond yields remained unusually low, although US yields hardened at the long end. As a corollary, yields softened in most EMEs. With the intensifying search for yield, sentiment towards EMEs improved and portfolio flows into these economies strengthened. The US dollar weakened in November, lifting EME currencies in particular, although some differentiation was evident in favour of tech-heavy EMEs and those more deeply involved in manufacturing global value chains. In contrast, the currencies of countries more reliant on commodity exports saw a limited rebound. Overall, the US dollar weakened by 2.3 per cent in November, taking its cumulative year-to-date depreciation to 4.7 per cent. EME currencies represented by the Morgan Stanley Capital International Emerging Markets (MSCI-EM) index appreciated by 1.6 per cent year-to-date and by 2.2 per cent in November alone. According to the Institute of International Finance (IIF), portfolio flows to EMEs stood at $76.5 billion in November, almost equally shared by equity and debt (US$39.8 billion and US$ 36.7 billion, respectively). Q4 2020 is likely to be the strongest quarter for EME inflows since Q1 2013, i.e., since just before the taper tantrum.  III. Domestic Developments Developments in India suggest a growing differentiation from global conditions in several aspects. By December 10, 2020 the number of total infections was 97,96,769 with 1,42,186 fatalities, but with 92,90,834 individuals cured/discharged. The doubling rate2 has decreased to 208.6 days vis-à-vis 3.5 days before the lockdown was imposed on March 25 (Chart 7). The mortality rate is 1.5 per cent, which is significantly lower than the world death rate (2.2 per cent). The recovery rate in India has also improved from around 5 per cent at the start of the lockdown to around 94.8 per cent on December 10. At the time of going to print, the number of active cases had dropped below 4 lakh, the first time since July. Although still a significant risk, India is the only country other than Argentina, which has not been subjected to a ‘second wave’. Mobility continues to normalise – the Google mobility index points to increasing movements around groceries and pharmacies in November, crossing the baseline set in February. Mobility around residential places continued to fall, while it stagnated around workplaces and increased around areas of recreation and retail shops, though at a level lower than the pre-pandemic baseline. These indications are corroborated by the Apple mobility index, that moved past its baseline set on January 13, 2020, led by the cities of Pune, Hyderabad and Bangalore. Early data for December so far (up to December 6) shows mobility near normal in all cities (Chart 8). The movement of goods also picked up in November, as reflected in an increase of 8.1 per cent y-o-y in the issuance of e-way bills – intra-state by 9.6 per cent; and inter-state by 6.0 per cent – although exhaustion of pent-up demand with reduced festivities produced some moderation.
Aggregate Demand High frequency indicators, which tend to exhibit some ebb and flow in tracking immediate developments, plateaued in November relative to the preceding month, but in sum they indicated that aggregate demand remained in expansion. As per preliminary estimates, electricity consumption for November 2020 increased for the third successive month in 2020-21 growing by 3.5 per cent y-o-y on top of 11.1 per cent in the preceding month. While consumption of petrol accelerated by 5.0 per cent, diesel consumption slipped into contraction zone, but due to unfavourable base effects. In the festival season between mid-October to mid- November, e-tailers – led by Flipkart and Amazon – grossed ₹58,000 crore, registering a growth of 65 per cent. With domestic spending being maintained, collections under the goods and services tax (GST) remained above the ₹1 lakh crore mark in November for the second time in the financial year, recording a 1.4 per cent y-o-y increase (Chart 9). Consumer sentiment improved in November 2020 round of the Reserve Bank’s consumer confidence survey (CCS) from an all-time low in the previous round. Households are now more confident about the year ahead, with expectations of improvement in the general economic situation, employment conditions, income scenario and spending. This has been corroborated by the Refinitiv-Ipsos Primary Consumer Sentiment, which rallied by 2.6 percentage points in November 2020 on the back of improving employment confidence, economic expectations, personal financial conditions and the investment climate. Employment conditions also improved during November. The Centre for Monitoring Indian Economy (CMIE) reported from its household survey that 40.03 percent of India’s working age population participated in the labour market by being employed or by searching for employment while being available for work. Consequently, the unemployment rate declined to 6.51 in November 2020 from 6.98 in October 2020, a sequential fall across both rural and urban areas. Reflecting this positive movement, the PMI employment index for services turned positive for the first time in nine months to 50.4 in November 2020 (46.8 in October 2020). According to the TeamLease Employment Outlook Report for Q3:2020-21, large and medium-size businesses continued to lead in the overall intent to hire; however, it was small size businesses, i.e., the Small and Medium Enterprises (SMEs), that have recorded the most significant growth. Under the Mahatma Gandhi National Rural Employment Guarantee Act (MGNREGA), employment demand from 25 per cent of the households remained unmet in November 2020, indicative of the desire to regain livelihoods. 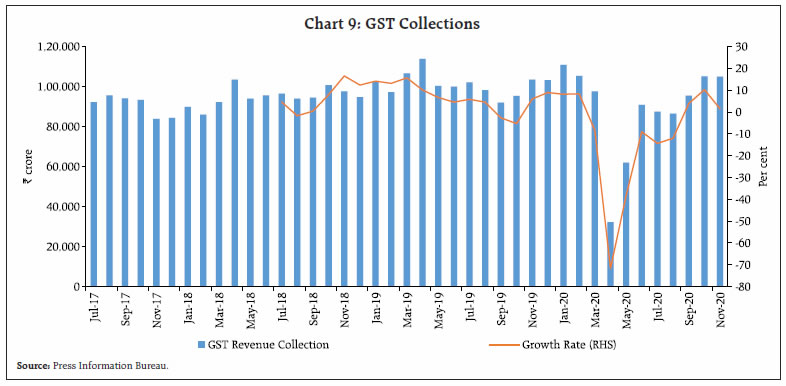 Turning to external demand, although total merchandise exports at US$ 23.5 billion declined by 8.7 per cent y-o-y in November in the provisional data of the Ministry of Commerce and Industry, non-oil exports maintained pre-COVID-19 levels for the third consecutive month (Chart 10). Sectors like drugs and pharmaceuticals, agriculture, pharmaceuticals and iron ore showed resilience. Imports declined for the ninth successive month though the pace of contraction has been moderating more recently. Oil imports declined by 43.4 per cent in November 2020, but essentially driven by soft international crude prices. On the other hand, non-oil imports have returned broadly to pre-COVID levels as domestic demand has started to normalise. The trade deficit widened to US$ 9.9 billion in November 2020, the highest in the current financial year. Going forward, the performance-linked incentive scheme (PLI) has been extended to ten sunrise sectors including pharmaceuticals, electronics/technology products, telecom and networking products and solar cells, which should boost merchandise exports and India’s participation in the global value chain. Aggregate Supply Aggregate supply conditions continued to improve through November 2020 on the back of the uptick in agriculture and manufacturing activity. Within the services sector too, there was a revival in construction, but contact-intensive services remained subdued and below pre-COVID levels. 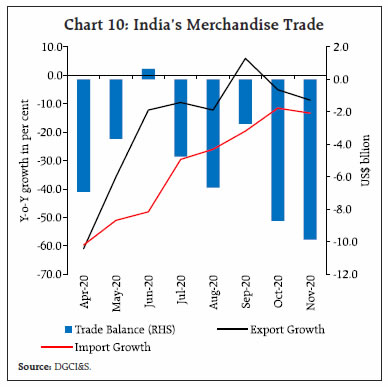 Agriculture has remained resilient and robust in the face of the pandemic. By December 4, 2020, 430.6 lakh hectare or 69.4 per cent of rabi sowing over the normal acreage has been completed, higher by 3.9 per cent than the coverage at this time a year ago (Table 3). Adequate reservoir levels have aided sowing – as on December 3, reservoir levels stood at 80 per cent of full capacity as against the decennial average of 66 per cent. Wheat sowing increased by around 0.8 per cent y-o-y, mainly in Madhya Pradesh (14.9 per cent), and Punjab (3.2 per cent). There has also been an impressive improvement in acreage of pulses and oilseeds this year. Meanwhile, procurement of kharif rice was 22.1 per cent higher than a year ago, taking the cereals (rice and wheat) buffer stock to 2.4 times the norm by December 1, 2020. Turning to industrial activity, the manufacturing purchasing managers’ index (PMI) remained in expansion zone in November, although at 56.3, it slipped below a decadal high it had touched in the preceding month (Chart 11). The December 12 release of the index of industrial production for October indicated an expansion for the second consecutive month to its highest pace in the current financial year. Firms responding to the Reserve Bank’s industrial outlook survey (IOS) in its 91st round were hopeful that the upturn that commenced in Q2:2020-21 would gain momentum. Their optimism was based on the availability of finance, coupled with a recovery in external demand and ongoing improvements in the job scenario. | Table 3: All India Crop Situation - Rabi (2020-21) as on December 4, 2020 | | (In lakh hectares) | | Crop Name | Normal area | Sowing as on date | Percentage variation | | Full season | As on date | This year (2020) | Last year (2019) | Over normal (as on date) | Over last Year | | 1. Wheat | 303.3 | 198.8 | 204.4 | 202.7 | 2.8 | 0.8 | | 2. Rice | 41.8 | 9.8 | 9.6 | 10.0 | -2.6 | -4.0 | | 3. Coarse Cereals | 57.1 | 41.2 | 33.0 | 35.6 | -19.9 | -7.2 | | a. Jowar | 33.4 | 26.1 | 20.9 | 21.2 | -19.7 | -1.1 | | b. Barley | 6.4 | 5.7 | 4.9 | 5.8 | -13.3 | -14.8 | | c. Maize | 17.4 | 8.9 | 6.6 | 8.1 | -25.0 | -18.0 | | 4. Total Pulses | 144.9 | 114.3 | 116.6 | 103.0 | 2.0 | 13.2 | | a. Gram | 92.8 | 78.3 | 82.2 | 70.7 | 5.0 | 16.2 | | b. Lentil | 14.2 | 13.1 | 13.1 | 12.1 | -0.3 | 8.4 | | c. Peas | 8.8 | 7.5 | 8.2 | 7.2 | 10.2 | 14.7 | | d. Kulthi (Horse Gram) | 2.2 | 3.7 | 3.1 | 3.9 | -15.6 | -19.5 | | e. Urad | 8.9 | 3.8 | 3.4 | 3.5 | -10.3 | -3.0 | | f. Moong | 9.9 | 1.4 | 0.9 | 0.9 | -38.6 | -2.2 | | g. Lathyrus | 4.0 | 2.8 | 2.4 | 2.1 | -15.5 | 11.4 | | I. Total Foodgrains (1+2+3+4) | 547.1 | 364.1 | 363.5 | 351.3 | -0.2 | 3.5 | | 5. Oilseeds | 73.2 | 66.7 | 67.1 | 63.2 | 0.5 | 6.2 | | a. Rapeseed & Mustard | 59.4 | 59.5 | 61.8 | 57.4 | 3.9 | 7.7 | | b. Groundnut | 7.3 | 2.6 | 2.1 | 2.3 | -18.0 | -8.1 | | c. Sunflower | 2.4 | 1.2 | 0.6 | 0.6 | -54.6 | -9.9 | | d. Sesame | 0.0 | 0.2 | 0.2 | 0.3 | -19.6 | -26.2 | | e. Safflower | 1.2 | 0.6 | 0.4 | 0.3 | -26.9 | 35.0 | | f. Linseed | 2.7 | 2.3 | 1.8 | 2.1 | -22.8 | -12.4 | | All- Crops (1+2+3+4+5) | 620.3 | 430.8 | 430.6 | 414.4 | -0.1 | 3.9 | Normal Area as on date: Average area during the corresponding period of 2014-15 to 2018-19.
Normal Area: Average area during the period of 2014-15 to 2018-19.
Note: Area figures are as per eye assessment of state Agriculture Departments.
Source: Ministry of Agriculture and Farmers’ Welfare | Within the services sector, a marked improvement has been underway, with several indicators exhibiting sharp upticks. The services PMI for November at 53.7 expanded for the second consecutive month, driven by an increase in new domestic work intakes. The construction sector, in particular, exhibited distinct signs of improvement in Q3:2020-21. An important coincident indicator of construction activity – the consumption of steel – accelerated by 11.0 per cent in November, reversing the contraction of 2.6 per cent in October. In sync, cement production emerged out of contraction in October 2020 at 2.8 per cent and is expected to expand further in November. Trading activity indicated by E-way bills, remained in growth mode in November, but moderated vis-à- vis the high levels touched amidst festivals in the preceding month. Transportation services were strongly supported by a growth of 9.0 per cent in railway freight traffic, extending the expansion that began in August 2020. Passenger traffic remained on track, improving on a month-on-month basis out of the steep contraction imposed by the lockdown. According to the Investment Information and Credit Rating Agency (ICRA), there was a revival in domestic air travel demand as passenger traffic at 62.0 lakh in November 2020 registered a sequential growth of 19 per cent. With people increasingly preferring personal mobility to avoid contact, passenger vehicle sales registered an acceleration for the fourth consecutive month in November. Barring the leading manufacturer of passenger cars, all other original equipment manufacturers (OEMs) posted high growth during the month, with a significant contribution from rural sales. Vehicle registrations in November, however, reflected a more cautious optimism. 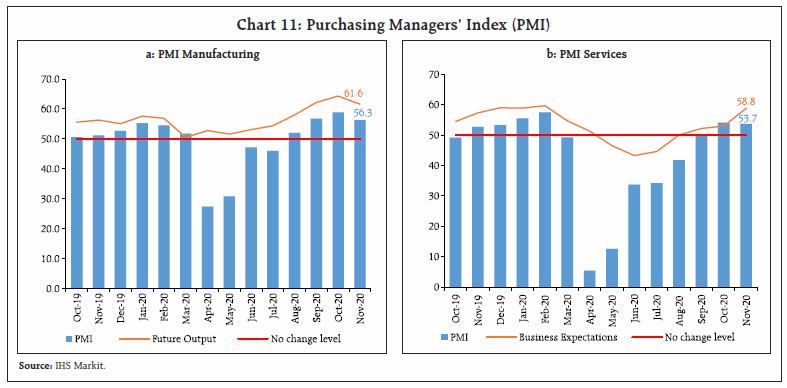 Inflation CPI headline inflation eased to 6.9 per cent in November from 7.6 per cent a month ago, primarily on account of a moderation in food inflation by 1.3 percentage points on a sequential basis; however, inflation remained elevated and above the upper tolerance threshold. The high frequency food price data available for December so far (till December 16, 2020), from the Ministry of Consumer Affairs, Food and Public Distribution (Department of Consumer Affairs), indicate some softening of price pressures in respect of onions, potatoes, tomatoes, tur, masoor, rice and wheat. Price increases in edible oils have continued unabated in December. Overall, on the basis of the DCA data, essential food prices increased by 0.5 per cent in December so far as compared to 2.0 per cent in November (Table 4). | Table 4: DCA Essential Commodity Prices | | S. no | Commodities | Weight in CPI | ₹ per Kg. | Month-over-month (per cent) | | Dec-19 | Nov-20 | Dec-20* | Oct-20 | Nov-20 | Dec-20* | | (1) | (2) | (3) | (4) | (5) | (6) | (7) | (8) | (9) | | I | Cereals (Rice + Wheat) | 6.9 | 31.8 | 32.9 | 32.7 | -0.2 | 0.5 | -0.8 | | | Rice | 4.4 | 33.5 | 35.0 | 34.8 | 0.4 | 0.4 | -0.7 | | | Wheat & Atta | 2.6 | 29.0 | 29.3 | 29.1 | -1.2 | 0.5 | -0.9 | | II | Pulses | 2.0 | 83.0 | 97.4 | 97.1 | 5.8 | 1.9 | -0.3 | | | Tur/Arhar Dal | 0.8 | 88.4 | 106.6 | 105.6 | 10.2 | 2.0 | -0.9 | | | Urad Dal | 0.3 | 96.4 | 106.4 | 107.3 | 5.0 | 2.4 | 0.8 | | III | Edible Oils | 3.0 | 106.6 | 124.6 | 128.8 | 1.7 | 2.6 | 3.3 | | | Mustard Oil | 1.3 | 113.7 | 132.7 | 137.0 | 1.7 | 3.1 | 3.3 | | | Refined Oils | 1.3 | 93.0 | 109.9 | 114.5 | 1.8 | 2.5 | 4.1 | | IV | Vegetables (POT) | 2.2 | 46.6 | 48.0 | 42.7 | 12.9 | 8.6 | -11.0 | | | Potato | 1.0 | 25.4 | 44.6 | 41.7 | 7.7 | 12.8 | -6.4 | | | Onion | 0.6 | 95.0 | 59.3 | 48.1 | 59.0 | 18.0 | -18.9 | | | Tomato | 0.6 | 29.0 | 41.2 | 38.3 | -12.4 | -9.3 | -7.0 | | V | Sugar | 1.1 | 39.2 | 40.0 | 40.0 | -0.4 | -0.4 | 0.0 | | VI | Milk | 6.4 | 44.9 | 47.1 | 47.3 | 0.1 | 0.4 | 0.5 | | VII | Weighted average price | 22.9 | 59.2 | 64.8 | 65.1 | 2.1 | 2.0 | 0.5 | *: Based on prices during December 1- December 16, 2020.
Note: Weighted average price denotes average price of 22 essential food items weighted by their share in CPI basket.
Source: Department of Consumer Affairs, GoI and RBI staff estimates. | In the petroleum products category, excise duties and state taxes kept pump prices elevated. The firming up of international crude prices in the second fortnight of November has started to push up domestic pump prices on a daily basis from November 20, 2020. In December so far, petrol and diesel prices saw an increase of 2.4 per cent and 3.6 per cent respectively. LPG prices after remaining stable during July-November 2020, registered an increase of ₹100 per cylinder in December, dispelling the calm and exacerbating pressures on strained household budgets. Kerosene prices registered a further increase of around ₹1 per litre in December on rising international prices (Table 5). A combination of rising international commodity prices and increasing pass-through to domestic manufactured goods and services prices, firms striving to recoup lost incomes by raising margins, and demand normalising is adding to core inflation pressures. In the manufacturing PMI for November, input prices have moved up further and will inevitably pass through into selling prices as slack in the economy reduces and demand gains traction. Consequently, output prices could strengthen beyond the hitherto moderate increases, and still weak pricing power that has characterised them so far. This was also visible in the CPI for November with CPI excluding food and fuel inflation remaining elevated at 5.8 per cent in November as against 5.9 per cent in October. IV. Financial Conditions System liquidity expanded further in November 2020 as average daily net absorptions under the liquidity adjustment facility (LAF) increased to ₹5,63,589 crore, despite a substantial increase in currency in circulation (CiC) due to festival-related currency demand. The surplus liquidity was absorbed through overnight reverse repos, with total absorption placed at ₹6,76,413 crore as on November 30, 2020. As announced in the Statement on Developmental and Regulatory Policies on October 9, banks that had availed of funds earlier under targeted long-term repo operations (TLTRO and TLTRO 2.0) were given the option of reversing these transactions before maturity. Accordingly, banks repaid ₹37,348 crore. The Reserve Bank conducted one outright open market operation (OMO) purchase in State Development Loans (SDLs) and injected durable liquidity of ₹10,000 crore on November 5, 2020. With a view to distributing liquidity across the maturity spectrum of the yield curve, the Reserve Bank conducted three simultaneous purchase and sale of securities under open market operations (special OMOs) for ₹10,000 crore each on November 12, 19 and 26, 2020. | Table 5: Petroleum Product Prices (Average of four major metros) | | Item | Unit | Domestic Prices | Month-over-month (per cent) | | Dec-19 | Nov-20 | Dec-20 | Nov-20 | Dec-20 | | Petrol | ₹/litre | 77.64 | 84.13 | 86.12^ | 0.3 | 2.4 | | Diesel | ₹/litre | 68.77 | 74.73 | 77.43^ | 0.6 | 3.6 | | Kerosene | ₹/litre | 28.80 | 22.17 | 23.21 | 3.3 | 4.7 | | LPG | ₹/cylinder | 699.88 | 604.63 | 704.63* | 0.0 | 16.5 | ^: Based on prices during December 1-16, 2020
*: Applicable from December 15, 2020
Note: Average of prices charged by Indian Oil Corporation Limited (IOCL) in four major metros (Chennai, Delhi, Mumbai and Kolkata).
Source: IOCL, Petroleum Planning and Analysis Cell (PPAC), GoI and RBI staff estimates. |
 Monetary and credit conditions have eased during 2020-21 so far and will facilitate the revival of economic activity. Reserve money (RM), adjusted for the first-round impact of changes in the cash reserve ratio (CRR), increased by 19.3 per cent on y-o-y basis as on November 27, 2020 (11.9 per cent a year ago). With aggregate deposits recording a growth of 10.8 per cent for the fortnight ended November 20, 2020, money supply (M3) grew by 12.5 per cent (9.8 per cent a year ago) [Chart 12]. Scheduled Commercial Banks’ (SCBs) credit to the commercial sector grew y-o-y by 5.8 per cent as on November 20, 2020, up from 5.1 per cent y-o-y growth in the last fortnight of the preceding month, driven largely by positive momentum. Reflecting the impact of TLTROs, scheduled commercial banks’ investments in commercial paper, bonds/debentures and shares of corporate bodies during the year 2020- 21 (up to November 20) increased by ₹850 crore as against a decline of ₹24,611 crore during the same period last year. The surplus liquidity conditions in the banking system have pushed the money market rates further down in November. In the overnight uncollateralised segment, the weighted average call rate (WACR) has dipped below the reverse repo rate from the last week of October 2020. In the collateralised segments – market repo and tri-party repo – rates trailed below the call rate by 29 basis points (bps) and 32 bps, respectively. In the near-term segments, i.e., certificates of deposit and 91-day treasury bills, rates remained at sub-reverse repo rate levels. The discount rate on commercial paper has dipped below the LAF reverse repo rate on many occasions and touched a low of 3.14 per cent on November 26, 2020 (Chart 13). The volatility in the overnight money market, which had peaked in the month of March 2020, has come down in the last couple of months (Chart 14). 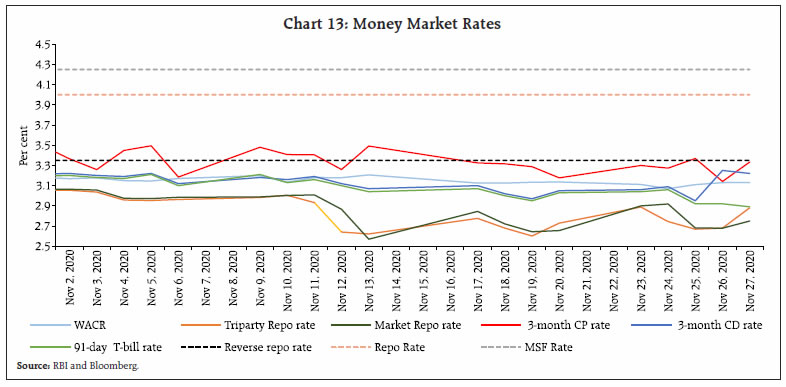 The surplus liquidity resulted in moderation of yields across financial markets, particularly in money and corporate bond markets (Table 6). The yield on 10-year G-sec benchmark (5.77 GS 2030) closed at 5.91 per cent on November 27, 2020. The cut off yield of the new 10-year G-sec benchmark was determined at 5.85 per cent in the primary market auction held on November 27, 2020, which was lower than the traded yield on the existing 10- year benchmark. With the continuous softening of financial conditions driven by liquidity and other measures taken by the Reserve Bank, corporate bond spreads receded to pre-COVID levels across most of the rating categories (Table 7).
| Table 6: Financial Markets - Rates and Spread | | Instrument | Interest Rates (per cent) | Spread (bps) (over corresponding risk-free rate) | | As on Oct 29, 2020 | As on Nov 27, 2020 | Variation (in bps) | As on Oct 29, 2020 | As on Nov 27, 2020 | Variation | | (1) | (2) | (3) | (4 = 3-2) | (5) | (6) | (7 = 6-5) | | CP (3-month) | 3.89 | 3.33 | -56 | 71 | 44 | -27 | | Corporate Bonds | | | | | | | | (i) AAA (1-yr) | 4.00 | 3.86 | -14 | 36 | 30 | -6 | | (ii) AAA (3-yr) | 4.90 | 4.64 | -26 | 28 | 17 | -11 | | (iii) AAA (5-yr) | 5.60 | 5.59 | -1 | 22 | 28 | 6 | | (iv) AA (3-yr) | 5.84 | 5.50 | -34 | 122 | 103 | -19 | | (iv) BBB-minus (3-yr) | 9.79 | 9.47 | -32 | 517 | 500 | -17 | | 10-yr G-sec | 5.88 | 5.91 | 3 | - | - | - | | Sources: CCIL: F-TRAC; FIMMDA; and Bloomberg. |
| Table 7: Corporate Bond Spread | | Ratings | 3-year Corporate Bond Spread | Variation | | Pre-COVID | Post-COVID | | 31-Dec-19 | 31-Jan-20 | 28-Feb-20 | 27-Nov-20 | | 1 | 2 | 3 | 4 | 5= (4-1) | 6= (4-2) | 7= (4-3) | | (Basis Points) | | AAA | 59 | 60 | 90 | 17 | -42 | -43 | -73 | | AA+ | 103 | 104 | 128 | 69 | -34 | -35 | -59 | | AA | 136 | 140 | 167 | 103 | -33 | -37 | -64 | | AA- | 175 | 178 | 207 | 150 | -25 | -28 | -57 | | A+ | 315 | 278 | 307 | 300 | -15 | 22 | -7 | | A | 345 | 328 | 357 | 325 | -20 | -3 | -32 | | A- | 425 | 378 | 407 | 400 | -25 | 22 | -7 | | BBB+ | 475 | 403 | 432 | 425 | -50 | 22 | -7 | | BBB | 500 | 428 | 457 | 450 | -50 | 22 | -7 | | BBB- | 550 | 453 | 482 | 500 | -50 | 47 | 18 | Note: The period after declaration of COVID-19 as pandemic on March 11, 2020 by the World Health Organisation (WHO) is considered as post-COVID.
Source: FIMMDA. | The transmission of policy repo rate changes to deposit and lending rates of scheduled commercial banks has improved since March 2020, reflecting the combined impact of the liquidity surplus, the accommodative monetary policy stance, the introduction of external benchmark-based pricing of loans, weak credit demand conditions and the lagged impact of policy rate cuts. The median term deposit rate, which reflects the prevailing card rates, has registered a sizable decline of 143 bps during March to November 2020. The 1-year median MCLR declined by 90 bps in the same period. The Indian equity market staged a V-shaped recovery with the BSE Sensex increasing by 69.9 per cent up from its low of 25,981 on March 23, 2020 to close at 44,150 on November 27, 2020. Domestic equity markets scaled fresh highs in November 2020, supported by encouraging reports on the vaccine, the outcome of the US elections and stimulus measures announced by the Government (Chart 15). This has raised the forward Price-to-Earnings (PE) ratio to 27.2 at end-November 2020 from its long-term average of 17.4 (Chart 16).
The rally in equities was driven by a surge in banking and financial sector stocks following better than expected Q2:2020-21 earnings results and increasing prospects of swift recovery (Chart 17). Foreign portfolio investment (FPI) inflows in November 2020 were at an all-time high, largely driven by equity purchases of US$ 9.6 billion, much higher than US$ 2.5 billion in the preceding month (Chart 18). In the foreign exchange market, the Indian rupee (INR) depreciated modestly by 1.0 per cent against the US dollar during November 2020 over October 2020, although it ended the month 2.2 per cent above its level at end March 2020. In terms of both the 36-currency trade-weighted nominal and real effective exchange rate indices, the INR depreciated by 1.9 per cent in November 2020 from its level a month ago. A relatively narrow trade deficit along with robust capital flows led to accretion in reserves to the tune of US$ 97.0 billion since end-March 2020. At the end of November 2020, reserves were at a level of US$ 574.8 billion, equivalent to 16.8 months of imports and alternatively, more than fully covering India’s outstanding external debt at the end of June 2020 (Chart 19). Digital transactions exhibited a sustained recovery and momentum picked up in November 2020, supported by both wholesale and retail transactions (Table 8). In the retail segment, national electronic funds transfer (NEFT) transactions volume grew 24.6 per cent y-o-y in November 2020, much higher than the growth (13.9 per cent) recorded a month ago. The growth in the value of NEFT transactions in November 2020 (27.9 per cent) was higher than that recorded in October 2020 (20.1 per cent). Unified payment interface (UPI) transactions surged to approximately 2.2 billion in November 2020, maintaining momentum in both volume and value terms. Among other digital transaction modes, national electronic toll collection (NETC) held on to a buoyant growth trajectory and immediate payment service (IMPS) showed stronger growth in November 2020 than in the previous month. In the wholesale segment, real time gross settlement (RTGS) transactions recorded acceleration in volume terms. 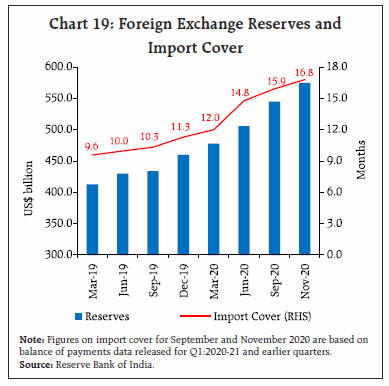
| Table 8: Payment Transactions in 2020-21 | | (in ₹ crore) | | | RTGS | NEFT | UPI | IMPS | | Apr-20 | 64,43,653 | 13,06,406 | 1,51,141 | 1,21,141 | | May-20 | 70,41,869 | 14,81,750 | 2,18,392 | 1,69,402 | | Jun-20 | 86,51,978 | 19,06,586 | 2,61,835 | 2,06,951 | | Jul-20 | 83,35,279 | 19,63113 | 2,90,538 | 2,25,775 | | Aug-20 | 72,92,380 | 19,30,552 | 2,98,308 | 2,35,137 | | Sep-20 | 94,89,066 | 21,65,515 | 3,29,032 | 2,48,662 | | Oct-20 | 84,96,046 | 22,35,389 | 3,86,107 | 2,74,645 | | Nov-20 | 79,87,655 | 22,18,252 | 3,90,999 | 2,76,459 | | Source: RBI. | V. Conclusion Abstracting from the inherent flux in high frequency indicators, the underlying trend would reveal that the pick-up in momentum of economic activity that commenced with the onset of the second half of 2020-21 is sustained. The absence of the dreaded ‘second wave’ of pandemic in India so far has imparted elevation to this momentum in an environment of supportive macroeconomic policies, spurring a faster unlock and normalisation of the economy. Already, contractions forecast by various agencies for the year as a whole are being trimmed, and if the current momentum is maintained, the bounce back expected in the last quarter of the year may be stronger than postulated under baseline assumptions. With the policy emphasis now shifting towards the more durable drivers of the economy, it is apposite now for private investment to turn its focus away from precautionary and deleveraging considerations to capex, capacity utilisation and building of new capacities. Both experience and empirical evidence have shown that recoveries led by investment turn out to be durable and lift both consumption spending and exports in their wake. The reforms in the domain of agricultural marketing and labour codes will bolster the efficiency and productivity gains. Financing conditions are conducive. In the time of the pandemic, financial saving of households and corporations have risen, waiting to be intermediated into productive investments rather than passive holdings of Statutory Liqidity Ratio (SLR) and non-SLR paper. With economic activities turning around, bank credit is slowly gaining traction. Forward earnings point to an improved outlook for companies. The supply of foreign saving is increasing, and foreign investment is upbeat on India. ‘Invest India’ – the national investment promotion and facilitation agency, emerged as the winner of the 2020 United Nations Investment Promotion Award. Also, financial conditions embodied in interest rates are perhaps at their easiest in decades. Pandemics spread fear and risk aversion, but they also uncover new opportunities and new avenues for animal spirits. At the same time, efforts need to be redoubled to excoriate the ‘worm in the apple’ – inflation – before it hurts the impulses of growth that are taking root. Efficient, effective and timely supply management, including checking runaway retailer margins and reducing the incidence of indirect taxes on consumers, can break the back of the inflation pressures before they incipiently broaden and work against the intent of fiscal and monetary stimuli. Well-coordinated country-wide logistics would usher in a smooth but swift distribution of vaccines up to the last mile. Although still significant headwinds persist on the path to a durable recovery, steadfast efforts by all stakeholders could help in recouping lost incomes and/or putting back India on a faster growth trajectory.
|