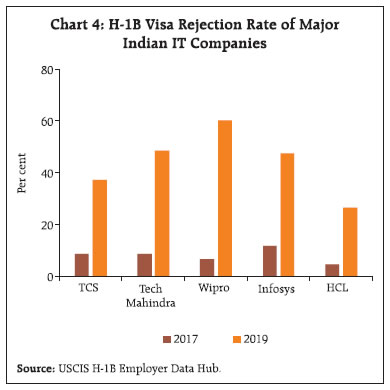
India’s balance of payments position in 2018-19 came under pressure from higher current account deficit (CAD) as well as lower net capital inflows. The widening of the CAD was on account of a higher trade deficit that largely reflected an adverse shift in terms of trade. The impact was, however, partially offset by modest rise in services and robust remittances receipt from overseas Indians. Even though foreign direct investment financed about half of the CAD, net capital inflow turned deficient to finance the CAD as there were net portfolio outflows and decline in trade credit. As a result, the foreign exchange reserves of the country declined by US$ 3.3 billion (on BoP basis). Introduction India’s external sector faced persistent global headwinds in 2018-19. As a result, CAD which averaged 1.3 per cent of GDP during 2013-14 to 2017-18 rose to 2.1 per cent of GDP. Trade tensions increasingly took a toll on business confidence and financial market sentiment which tightened financial conditions for vulnerable emerging markets in the spring of 2018. Net outflows of foreign portfolio investments (FPI) mainly led to net capital flows falling short of the funding requirements of CAD. This resulted in modest depletion of foreign exchange reserves during the year. This article delineates developments under various components of balance of payments during the year. Section II focuses on factors that drove movements in various components of the current account deficit in 2018-19. Section III discusses financial flows, followed by Section IV which summarises the article. II. Current Account The current account in the balance of payments covers all cross-border transactions relating to goods and services trade, receipt or payment of income from investments (primary income), and unilateral transfers (secondary income). Historically, India’s current account balance is largely driven by movements in the goods trade account (Chart 1). In 2018-19 also, higher deficit in goods trade mainly widened the current account deficit (Table 1). Trade Account - Goods The global economic environment remained adverse for exports of goods while higher prices of key import commodities expanded the import bill during 2018-19. Notwithstanding the uptrend in international crude oil prices that boosted export of petroleum products, the impact of tepid world goods trade volume growth partly a result of escalation of trade tensions and the associated increase in policy uncertainty impacted overall export growth. On BoP basis, non-oil export growth decelerated from 9.2 per cent in 2017-18 to 7.1 per cent in 2018-19, dragged down mainly by three major sectors, viz., gems and jewellery, readymade garments and marine products. By contrast, electronic goods, engineering goods, petroleum products and chemicals recorded higher shipments. | Table 1: India’s Balance of Payments - A Summary of Current Account | | (US$ billion) | | Item | 2017-18 | 2018-19 | | Credit | Debit | Net | Credit | Debit | Net | | I. Goods and Services | 504.1 | 586.5 | -82.5 | 545.2 | 643.6 | -98.3 | | I.a Goods | 309.0 | 469.0 | -160.0 | 337.2 | 517.5 | -180.3 | | I.b Services | 195.1 | 117.5 | 77.6 | 208.0 | 126.1 | 81.9 | | II. Primary income | 18.9 | 47.5 | -28.7 | 21.8 | 50.7 | -28.9 | | III. Secondary income | 69.4 | 6.9 | 62.5 | 76.6 | 6.6 | 70.0 | | Current Account | 592.4 | 641.0 | -48.7 | 643.7 | 700.9 | -57.2 | | Memo: (as % of GDP) | | | | | | | | Trade balance (goods) | | | -6.0 | | | -6.6 | | Trade balance (goods and services) | | | -3.1 | | | -3.6 | | Current Account Balance | | | -1.8 | | | -2.1 | | Source: RBI. | Import growth decelerated in 2018-19 despite a sharp rise in oil import bill. This was mainly caused by a decline in gold prices and lower growth in non-oil non-gold imports. Crude oil, being the largest item of import in the import basket, makes India’s trade account vulnerable to movements in international prices. During 2018-19, owing to tight supply conditions and relatively stronger global economic activity in H1:2018-19, global oil inventories fell rapidly and pushed up prices to over US$ 80 per barrel in early October. Subsequently, waivers granted by the US to major oil importers from Iran and higher production in Saudi Arabia and Russia eased oil prices, which helped in reducing India’s trade deficit in H2:2018-19. Nevertheless, India’s oil import bill rose by US$ 32.3 billion during the year. Renewed strength of the US dollar scaled down the global demand for gold as a safe haven asset which eased global gold prices. This helped reduce the value of gold imports. Within non-oil non-gold imports, a sharp fall in pearls and precious stones, vegetable oil, pulses and metalliferrous ores contributed to lower import growth. As imports grew faster than exports, the trade deficit (goods) widened to 6.6 per cent of GDP in 2018-19 from 6.0 per cent a year ago (Chart 2). Of the incremental increase of 0.6 percentage points in trade deficit, 0.5 percentage point was due to unfavourable movement in net terms of trade (ToT) and 0.1 percentage point was due to change in gross terms of trade (i.e., import volume growing faster than export volume). Services The globally interconnected production networks, especially in the pre-global financial crisis period, amplified cross-border trade not only in goods but also in services. Global trade in services increased from 9.2 per cent of global GDP in 2000 to 12.4 per cent in 2008 and then further to 13.1 per cent in 2018 (World Development Indicators, World Bank). In line with the expanding share of services in domestic Gross Value Added (GVA), India’s services exports too have increased, enabling an increase in its share in global services exports. India figures among the top ten global exporters and importers of services. A cross-country comparison of leading exporters of services shows that India’s services export growth during 2013-18 (average) was the third highest after Ireland and Japan (Chart 3). In 2018-19, surplus generated by services exports at US$ 81.9 billion could offset 45.5 per cent of goods trade deficit. India’s net services export growth moderated to 5.6 per cent in 2018-19 from 13.5 per cent in 2017-18. This was despite software exports, the largest contributor to net services exports, growing at a faster pace, surviving difficult global market conditions. Deceleration in growth in net export of services was contributed mainly by higher import of travel and business services. 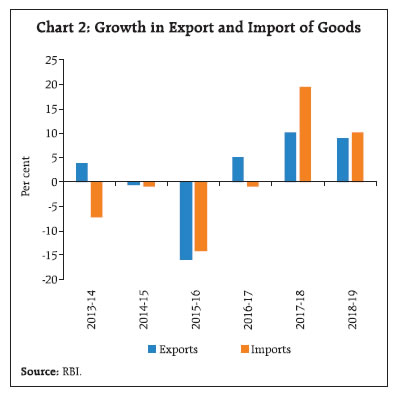 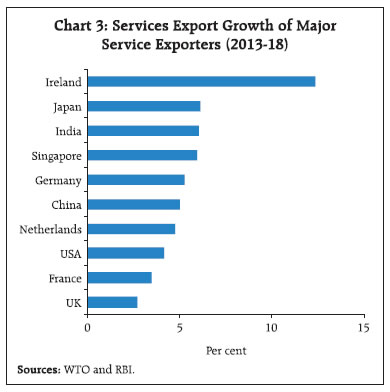 Software exports retained their share of 40 per cent in total exports of services in 2018-19 despite the global business environment turning more challenging during the year. The domestic IT companies faced increasing costs pressure due to higher local hiring in export destinations and lesser scope for labour cost arbitrage as well as higher visa fees and compliance burden associated with enhanced scrutiny of visa applications in the USA. This was discernible from the H-1B visa denial rate, which increased significantly for major indian IT companies during the year (Chart 4). Nevertheless, strong performance of banking, financial services and insurance (BFSI) verticals helped net export of software services to grow by 7.6 per cent during the year. Growth in exports of travel services – the second largest contributor to net services exports – remained muted at 0.3 per cent due to slower growth in in-bound tourist arrivals. By contrast, import of travel services rose sharply, in line with growing number of departures of Indian nationals from India. Accordingly, net exports of travel services declined by 23.8 per cent during the year. As India’s foreign trade volume increases, cross-border trade of transport services also tends to increase. Owing to higher payments towards imports than exports of transport services for the second consecutive year, there was a net import of transport services to the tune of US$ 1.1 billion in 2018-19. | Table 2: India’s Trade in Services | | | 2017-18 | 2018-19 | | Credit | Debit | Net | Credit | Debit | Net | | Services | 195.1 | 117.5 | 77.6 | 208.0 | 126.1 | 81.9 | | | (18.8) | (22.6) | | (6.6) | (7.3) | | | Of which: | | | | | | | | Travel | 28.4 | 19.5 | 8.8 | 28.4 | 21.7 | 6.7 | | (22.0) | (18.6) | | (0.3) | (11.2) | | | Transport | 17.4 | 17.6 | -0.2 | 19.5 | 20.5 | -1.1 | | (10.0) | (24.6) | | (11.6) | (16.6) | | | Insurance | 2.5 | 1.7 | 0.8 | 2.7 | 1.8 | 0.9 | | (13.6) | (13.7) | | (6.2) | (5.3) | | | Software | 77.3 | 5.1 | 72.2 | 83.5 | 5.8 | 77.7 | | (4.0) | (43.3) | | (7.9) | (13.1) | | | Business | 37.3 | 36.6 | 0.7 | 39.1 | 40.4 | -1.3 | | (13.4) | (13.3) | | (4.7) | (10.3) | | | Financial | 5.2 | 5.5 | -0.4 | 4.9 | 3.5 | 1.4 | | (1.3) | (-5.4) | | (-5.9) | (-37.0) | | | Communication | 2.1 | 1.0 | 1.1 | 2.6 | 1.1 | 1.4 | | (-11.7) | (4.8) | | (22.1) | (18.4) | | | Note: Figures in parentheses are percent change (y-o-y) basis. |
 India turned a net importer of business services in 2018-19 from being a net exporter in the preceding two years. Business services include services provided for ‘professional and management consultancy’, ‘technical & trade related’ and ‘research and development (R&D)’ activities. While services delivered on account of these activities fetched receipts of US$ 39.1 billion, resident entities made payments of US$ 40.4 billion for import of these services, leading to a net import of US$ 1.3 billion during the year primarily on account of net payments for technical and trade related services. Within this segment, India was a net exporter of both ‘professional and management consultancy’ and ‘R&D services’ during the year. Other net exporter segment of services were insurance and financial services which together contributed US$ 2.2 billion to net export of services during the year. Going forward, the scope of expansion in services trade, especially software, business and financial services has further widened as economies are transitioning towards digitalisation. With greater emphasis on self-reliance in recent years, India’s professionals have acquired expertise and skill catering to a wide-ranging spectrum of IT services suitable for developed as well as developing countries. In such a milieu, India is rightly placed to reap the benefits of this transition on the back of its revealed comparative advantage (RCA) in software services. Primary Income The primary income forms an important part of the current account and includes all amount payable and receivable to non-resident entities in return for providing temporary use of labour, financial resources or non-produced non-financial assets. Given India’s net international financial liabilities to the rest of the world (i.e., negative net international investment position), there has been a persistent outgo from the primary income account of the balance of payments. The net outgo increased marginally to US$ 28.9 billion in 2018-19 from US$ 28.7 billion a year ago (Chart 5). 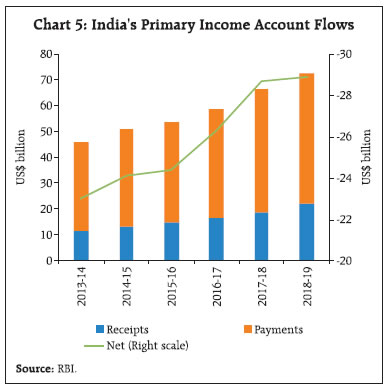 In the primary income account, 93 per cent of total outgo was attributable to investment income payments. Investment income is the return for providing financial assets and consists of dividends and withdrawals from income of quasi-corporations, reinvested earnings, and interest. These transactions primarily reflect the servicing of debt and non-debt liabilities of the economy. Interest payments on debt liabilities (payment of interest of FDI enterprises to their parent company abroad, FII debt holdings, external commercial borrowings (ECBs), trade credits, bank overseas borrowings, non-resident deposits) and dividend pay outs on non-debt liabilities (investment in equity and investment fund shares) accounted for around three-fourth of total investment income outgo in 2018-19 (Chart 6). The ratio of income outflow to the corresponding stock of non-resident assets or debt and non-debt liabilities of the country in the preceding year has remained largely range bound around 6 per cent (Chart 7). India’s primary income receipts were largely in the form of interest earned on foreign assets of residents including foreign currency assets deployed abroad by the Reserve Bank. Secondary Income In the case of India, secondary income mainly represents cross-border transfers (remittances) by expatriates sending a part of their income to support their families. With world’s largest diaspora (UN Migration Report 2019), India retained its position as the top recipient of cross-border remittances in 2018 (Chart 8). In tandem with global recovery in remittances, India’s inward remittances (private) also increased by 10.5 per cent in 2018-19 on the back of increase in international crude oil prices and improved nominal income conditions in the US which is one of the major source country for inward remittances apart from the Gulf countries (Chart 9). Rupee depreciation of 7.8 per cent against the US dollar during 2018-19 also augured well for remittance flows to India. Another factor that seems to have boosted remittance inflows was higher amounts of transfers by migrants from Kerala to their families back home in the wake of the flooding disaster faced in the state.1 As India’s outbound remittance are comparatively miniscule relative to in-bound remittances, there has been a persistent net surplus position in this account which could offset about 39 per cent of the goods trade deficit in 2018-19. 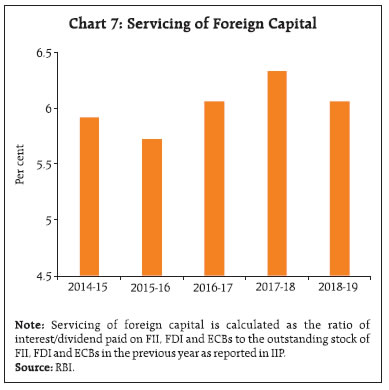 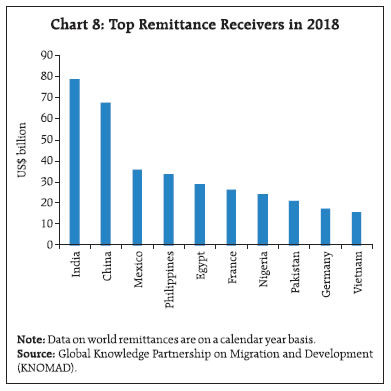 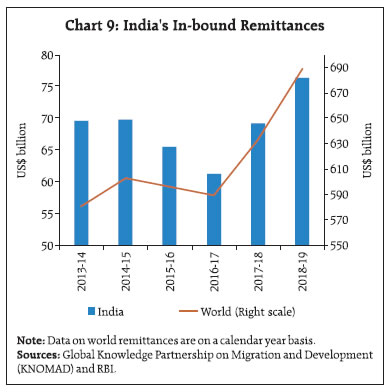 India has retained the top global position in receiving remittances since 2008 followed by China, Mexico and Philippines. In 2018, India received 11 per cent of the global remittances. The pro-cyclicality of India’s remittances with respect to income of the migrant workers in the source country has been established empirically by various studies. Component-wise, India’s remittances are primarily in the form of family maintenance and local withdrawals, accounting for more than 90 per cent of total receipts (Chart 10). While workers’ remittances are made for meeting consumption needs of their families in the home country, local withdrawals of non-resident Indian (NRI) deposits are also accounted as transfer receipts. While NRI deposits are an important source of capital and form a part of the capital account in the balance of payments (BoP), when withdrawn domestically such deposits no longer form part of external liability and are instead treated as unrequited transfers. 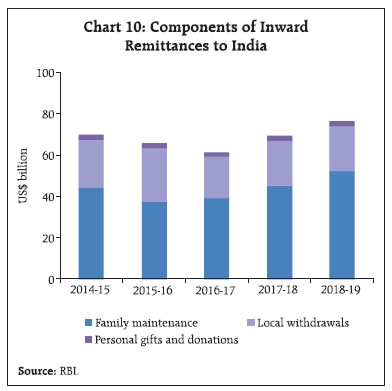 Composition of CAD CAD broadly followed the trend in the trade deficit. As trade deficit was significantly higher in first three quarters, CAD to GDP ratio exceeded 2 per cent. In Q4, however, with the easing of international crude oil prices, the trade deficit narrowed and contributed to a lower CAD. The CAD for the year as a whole widened to 2.1 per cent of GDP from 1.8 per cent a year ago, primarily on the back of higher trade deficit (Chart 11). While the erosion in net terms of trade caused by higher commodity prices (e.g., crude oil, coal and fertilisers) added 0.5 percentage point of GDP to the incremental increase in CAD during 2018-19, higher import volumes contributed another 0.1 percentage point. In other words, CAD widened on the back of both rise in international commodity prices and a faster rise in import volumes than exports during the year. An improvement in net invisibles, helped in restricting the CAD during the year (Chart 12). III. Financial Flows A deficit in the current account is sustainable when financed by foreign capital inflows involving transfers of both non-financial and financial assets between residents and non-residents. In 2018-19, foreign capital flows moderated as global headwinds weighed on investor sentiment leading to outflow of foreign portfolio investments. Consequently, the CAD could only be partly financed by net capital flows, resulting in a modest drawdown of foreign exchange reserves (Chart 13). The composition of capital flows, however, improved with an increase in the share of non-debt creating flows on account of robust inflows under foreign direct investment (FDI). Foreign Direct Investment Global FDI flows declined in 2018 as moderating rates of return and less favourable investment climate took a toll along with one-off factors like the US tax reform which led to large repatriation of accumulated investments by the US multinational enterprises (MNEs) (World Investment Report (WIR),UNCTAD 2019). However, with considerable domestic policy initiatives directed at improving the ease of doing business, India remained among the top 10 largest FDI recipient countries in 2018. Based on announced greenfield projects, India was the second largest recipient of capital investment behind China in the Asia Pacific region in 2018 (FDI Intelligence Report, Financial Times 2019). Higher FDI flows augur well not only for India’s exports but also for increased participation in the global value chains (GVCs) (Box I). 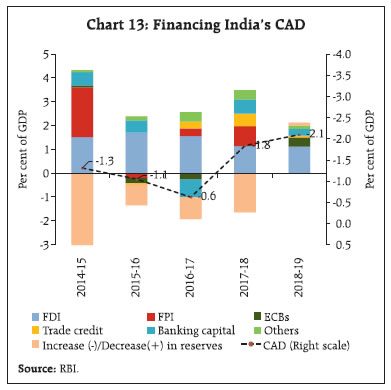 Net FDI flows to India increased to US$ 43.3 billion in 2018-19 from US$ 39.4 billion in 2017-18 led by higher equity investment, reinvested earnings by the existing companies and inter-corporate debt between parent and subsidiaries of multinational enterprises (MNEs). However, net inflows increased only marginally due to higher overseas direct investment by India in 2018-19 (Chart 14). India’s manufacturing sector and finance, banking, insurance, construction, computer and electricity generation attracted majority of FDI equity while investment in communication, retail and wholesale trade, business services and transport recorded a decline. Singapore and Mauritius continued to remain the top sources of FDI to India accounting for more than 50 per cent of total equity inflows (Chart 15). The share of Mauritius, however, halved following the amendment of the double tax avoidance agreement (DTAA) in 2016 according to which capital gains arising out of shares acquired during April 2017 to March 2019 are subject to 50 per cent of prevailing tax rate and after April 2019 will be fully taxable under Indian tax laws. The investment from Singapore, the US, the UK and Japan increased. Despite the amendment of the DTAA with Singapore, investment through the Singapore route remained robust as transparent financial system, cheaper access to funds and better ease of doing business in Singapore make it a preferred country to re-route investment.  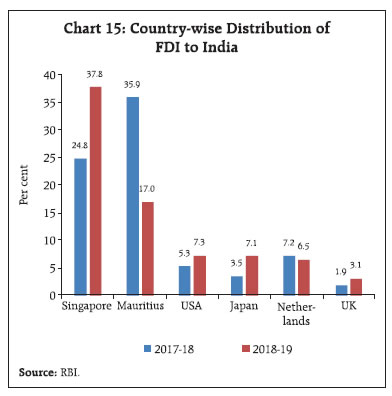 Box I: Foreign Direct Investment to Enhance India’s Participation in the Global Value Chain With trade liberalisation, declining transport costs and improving communication technologies since the mid-1990s, global production has become more fragmented as products undergo several value-enhancing intermediate stages spread across countries before conversion to final product. The global value chain (GVC) enables firms to optimise their production processes and reduce cost of production by restructuring their operations internationally. Historically, developed countries have remained more integrated through greater participation in the GVC. However, rising FDI and emergence of transnational corporations (TNCs) have facilitated greater integration of various emerging market and developing economies (EMDEs) by enhancing their participation at various stages of GVC. It is important in this context to explore the nexus between trade and foreign investment (World Investment Report, UNCTAD 2013). The GVC indicator measuring the participation of each sector j in a given country n in the cross-national trade of intermediate goods is defined as:  where FVAjn is the foreign value added (backward linkage) and IVAjn is the indirect domestic value added (forward linkage) in both sector j and country n, divided by total sector-country exports (Amendolagine et al., 2017). While backward linkage indicates the share of foreign inputs embedded in the country’s exports, forward linkage is the share of the domestic country’s exports used as an input for the importing country’s exports. Sum of these gives the GVC participation level of a country, which is considered an important indicator of the extent to which a country’s exports are integrated into international production networks. Empirical research shows that this integration tends to bring about economic benefits in terms of enhanced productivity, sophistication and diversification of exports (OECD, 2015). While heterogeneity in the GVC participation across countries tends to be primarily determined by structural factors ranging from geography, market size, level of development, studies have shown that policy reforms in trade, FDI, labour and infrastructural development have played a key role in enhanced participation (OECD, 2015). Foreign investment is also found to alter host economies’ export composition and enhances their participation in the GVC (Ekholm et al., 2007, Damijan et al., 2013 and Buelens & Tirpák, 2017). 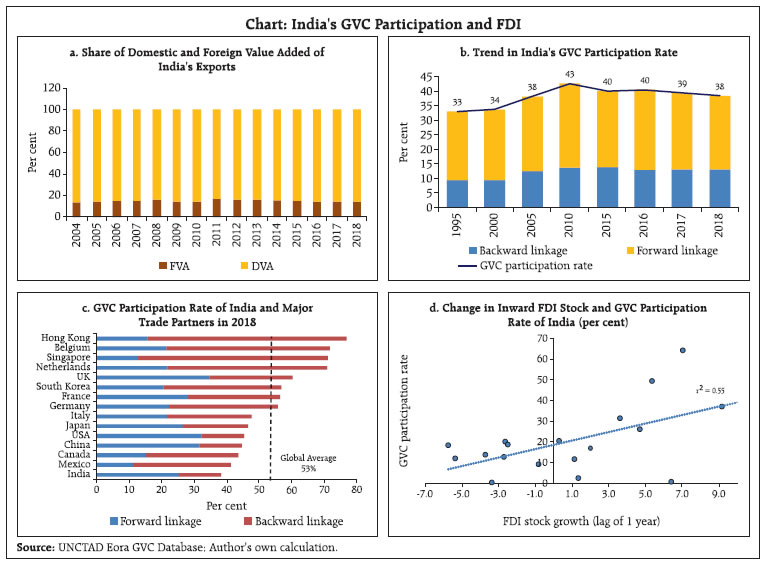 Historically, India’s exports are dominated by domestically resourced inputs. With domestically produced wider set of intermediate goods and dominance of services exports, domestic value added to total exports is more dominant than foreign inputs (Chart a). Composition of India’s export basket can explain India’s stronger forward linkages in the global supply chain relative to the backward linkage (Chart b). This implies a smaller upstream component in India’s GVC participation. India’s GVC participation rate improved during 1995 to 2010 but dwindled somewhat thereafter. India’s GVC participation level continues to be lower than other major economies (Chart c). Source-wise, China, the US, Germany, Russia and the UK occupy the top positions accounting for 42 per cent of total value addition in India’s exports. Similarly, Germany, Netherlands, China, Belgium and Singapore are the top users of India’s inputs for exports to their trade partners through GVC. In the case of India, FDI policy has been liberalised over the years. In a cross-country perspective, several studies highlight the importance of the trade-generating effect of FDI primarily through intra-firm trade (Markusen, 2002). India’s GVC participation rate is found to be positively associated with the growth in inward FDI stock with a correlation coefficient of 0.55 for the period 2001-2018 (Chart d). This is despite the fact that FDI in India is primarily confined in services and telecommunication, not in manufacturing. Thus, domestic policies that help attract FDI would constitute an indirect way to deepen India’s GVC participation. Going forward, the on-going trade war between the US and China has increased the scope for diversification of global FDI and manufacturing away from China. EMEs like India can reap this opportunity by ensuring a conducive business environment for foreign investors which may, in turn, help strengthen domestic manufacturing base for exports and improve GVC participation. In fact, a recent UBS Evidence Lab CFO Survey (2019) finds India as a favoured investment destination for foreign investors ahead of other peer Asian economies. Recent measures announced to encourage FDI in contract manufacturing and single brand retail bode well for improving India’s GVC participation. Given the size and diversification of domestic economy as well as global opportunities, there is immense potential to improve GVC participation by moving up in the global value chain. This, however, needs to be realised by attracting further FDI and undertaking domestic structural reforms. References Amendolagine, Vito, Presbitero Andrea F., Rabellotti Roberta, Sanfilippo Marco, Seric Adnan (2017), ‘FDI, Global Value Chains, and Local Sourcing in Developing Countries’, IMF Working Paper No. WP/17/284. Buelens Christian, Tirpak Marcel (2017), ‘Reading the footprints: how foreign investors shape countries’ participation in global value chains’, ECB Working Paper Series No. 2060, May. Damijan, J., Kostevc, C., & Rojec, M. (2013), ‘Global Supply Chains at Work in Central and Eastern European Countries: Impact of FDI on export restructuring and productivity growth’, LICOS Discussion Paper 332/2013. Ekholm, K., Forslid, R., & Markusen, J. R. (2007), ‘Export-Platform Foreign Direct Investment’, Journal of the European Economic Association, Vol.5, No.4 (June 2007), 776-795. Kowalski, P. et al. (2015), ‘Participation of Developing Countries in Global Value Chains: Implications for Trade and Trade-Related Policies’, OECD Trade Policy Papers, No. 179, OECD Publishing, Paris Markusen, J. (2002). Multinational Firms and the Theory of International Trade. MIT Press. UNCTAD (2013), ‘Global Value Chains: Investment and Trade for Development’, World Investment Report. UNCTAD (2018), ‘Investment and New Industrial Policies’, World Investment Report. | India’s outward FDI expanded in line with the simplification of the procedures for outbound investments from India since 2004. In 2018-19, the rise in net outward FDI was due to a sharp increase in overseas equity investment by Indian entities. Of the total net outward FDI equity flows of US$ 4.4 billion, Singapore remained the top destination country due to favourable business environment for Indian entities. There has, however, been a compositional shift towards developed countries viz., the US, the UK and Russia following the amendment of the DTAA with Singapore, Mauritius and Cayman Islands. Indian entities largely invested in financial, insurance, banking, manufacturing, wholesale trading and agriculture and mining– which together accounts for 90 per cent of the total outward FDI reported during the year. According to a survey of investment promotion agencies (IPAs) by the United Nations Conference on Trade and Development (UNCTAD), India is expected to be among the top ten source countries for FDI during 2019 to 2021 period (WIR,UNCTAD 2019). 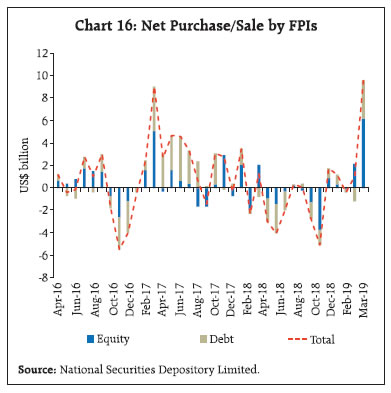 Foreign Portfolio Investment Driven by geo-political tensions and country-specific domestic policy uncertainties portfolio investment flows declined significantly worldwide in 2018 (WIR, UNCTAD 2019). Concerns on rising crude oil prices, geopolitical uncertainties, trade tensions, coupled with domestic political uncertainties, depreciating rupee led to the reversal of portfolio flows from India during April-December 2018-19. In Q4:2018-19, however, portfolio investors turned net buyers infusing US$ 11.5 billion, driven by dovish US monetary policy, enhanced liquidity in the global markets and positive growth outlook for India post-budget. This, coupled with easing of domestic norms including enhanced limits for investment in government securities and easing of minimum residual maturity augured well for the investors. In 2018-19, on a net basis, FPIs pulled out US$ 2.2 billion, as against a net purchase of US$ 22.2 billion a year ago, primarily on account of net sales in the debt segment (Chart 16). Sector-wise, the highest FPI outflow was from the sovereign sector (i.e., G-Secs) in the debt segment followed by automobile and auto-components, metals and mining, capital goods, telecom services and construction materials in the equity segment (Chart 17). As at end-March 2019, FPI utilised 68.6 percent of investment limits in central government securities, 6.5 percent in State Development Loans (SDLs) and 75.9 per cent in corporate debt. Other Investment Apart from foreign investments, external commercial borrowings, short term trade credit and net banking capital including non-resident deposits (NRD) are important sources of foreign capital. In 2018-19, ECBs (excluding inter-corporate loans by affiliated enterprises) recorded net inflows of US$ 9.8 billion after three successive years of outflows with increase in fresh borrowings and lower repayments (Chart 18). A slew of measures to liberalise ECBs including rationalisation of all-in-cost of ECBs, expansion of list of eligible borrowers, removal of sector-wise borrowing limits augured well for the borrowers. Removal of sectoral limits for all eligible borrowers up to US$ 750 million and approval of oil marketing companies to raise up to US$ 10 billion for working capital increased the attractiveness of ECBs. The top borrowing sectors included financial services, petroleum and petroleum products manufacturing, iron and steel, power generation, transmission and distribution in 2018-19. In terms of utilisation, ECBs were raised mainly for the purpose of refinancing of earlier loans, import of capital goods, raw materials, acquisition of goods and on-lending to sub-borrowers. Within ECBs, however, flows of rupee denominated bonds were almost negligible in 2018-19 relative to their level a year ago. 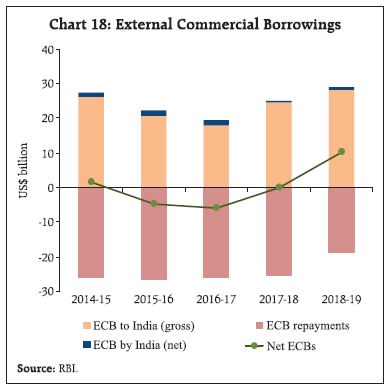 Short-term trade credits, extended for imports directly by overseas suppliers, banks and financial institutions for maturities of up to five years, decelerated in 2018-19. The decline was evident both in total disbursement and repayments, indicating slowdown in trade credit activity in general, driven by both demand and supply side factors. Discontinuation of trade credit instruments, Letters of Undertaking (LOUs) / Letters of Comfort (LOCs) in March 2018 led to transition towards standardised instruments, viz., Letter of Credit or Standby Letter of Credit (SBLC) by banks and realignment of trade credit from buyers’ credit towards suppliers’ credit. Consequently, there was a decline in fresh disbursals and rise in relative cost for small and marginal importers which acted as a deterrent for trade credit demand. Accordingly, trade credit to import ratio fell to 8.4 per cent in 2018-19 from 21.4 per cent in 2017-18 (Chart 19). 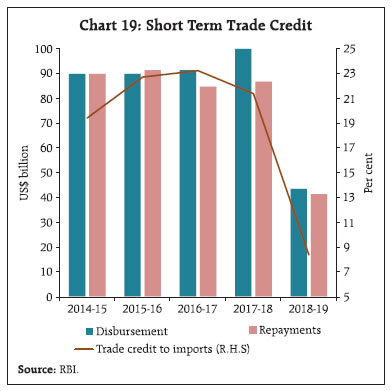 Flows under banking capital, mainly driven by non-resident deposits and movements in net financial assets held abroad by commercial banks in India, moderated in 2018-19. The decline was led by increased net foreign currency asset holdings of banks to take advantage of better arbitrage opportunities in the overseas inter-bank market. Net inflows of non-resident deposits, however, increased to US$ 10.4 billion in 2018-19 from US$ 9.7 billion a year ago benefiting from the depreciation of the Indian Rupee against the US dollar and also improved income conditions in source countries, particularly in the Gulf region due to increase in crude oil prices (Chart 20). Net inflows under the non-resident external rupee account (NRE), which accounted for about 70 per cent of total flows of non-resident deposits, continued to remain stable. Reserve Assets As net capital inflows recorded during 2018-19 fell short of the financing requirement of India’s CAD, there was a depletion of US$ 3.3 billion of the foreign exchange reserves as against an accretion of US$ 43.6 billion in 2017-18 on a BoP basis (i.e., excluding valuation effects). The foreign exchange reserves in nominal terms (including the valuation effects) decreased by US$ 11.7 billion in 2018-19 as against an increase of US$ 54.6 billion during the same period of the preceding year. Nominal change in reserve included a valuation loss of US$ 8.3 billion largely due to the appreciation of the US dollar against major currencies, excluding which depletion of reserve amounted to US$ 3.3 billion in 2018-19 (on BoP basis) (Chart 21). IV. Conclusion Slowdown in global demand, higher global crude oil prices, subdued global trade activity and geo-political uncertainties took a toll on India’s external sector as the CAD widened to its highest level since 2012-13. External financing conditions also remained adverse as global financial conditions tightened amidst global financial markets re-pricing risks on a combination of global and country-specific factors that sparked off scrambles for safe havens and sell-offs which led to capital outflows from EMEs including India. Over a greater part of the year 2018-19, FPIs turned net sellers in the domestic capital market. Along with a sharp fall in trade credit, overall net capital inflows declined during the year. Consequently, after six consecutive years of annual accretions, foreign exchange reserves were used to partly finance the CAD. References External Commercial Borrowings (ECB) Policy – New ECB Framework, https://www.rbi.org.in/Scripts/BS_CircularIndexDisplay.aspx?Id=11456 Financial Times (2019), ‘Global Greenfield Investment Trends’, The FDI Report 2019. IMF (2019), ‘Growth Slowdown and Precarious Recovery’, World Economic Outlook. UNCTAD (2019), ‘Special Economic Zones’, World Investment Report. World Bank Washington, D.C (2019), ‘Recent Developments and Outlook’, Migration and Development Brief 30.
|