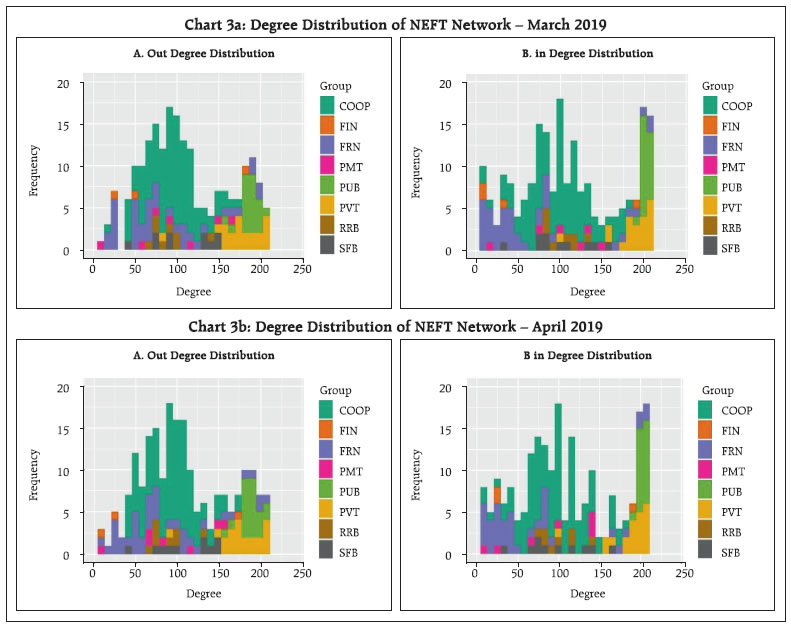
As a first attempt in the Indian context, we examine the network topology of the NEFT system and analyse financial interconnectedness using network metrics of centrality. Using bilateral transaction information for each participating institution aggregated for March and April months of 2019, we build a network graph depicting the linkages. We use these data to explore the connections between various groups of banks in order to identify patterns. We also seek prominent players in the payment network in order of their systemic importance using a non-parametric methodology. Introduction In the context of financial stability, central banks and regulators have increasingly realised that it is critically important to understand the underlying interconnectedness among banks and financial institutions in the architecture of financial system. Accordingly, the supervisory and regulatory framework for financial stability has acquired substantial rigour with the use of advanced theoretical and empirical models for measuring interconnectedness and identifying systemically important financial institutions. Since the global crisis in 2008, network models have emerged as a tool for analysis of interbank financial exposures. The recent literature has accordingly emphasised the role of network analysis of interbank payment transactions in complementing the existing framework for financial stability analysis (Caccioli et al., 2018). Where central banks are the operators of payment and settlement infrastructure, as in India, a comparative advantage is that it is relatively easier to acquire clean, structured and accurate data that are crucial for network analysis. Surprisingly, therefore, there has been little research on the interconnectedness of participating entities in the payment system in India. The motivation for this study is to bridge this gap as a first attempt in the Indian context. We use the National Electronic Fund Transfer (NEFT) system as a case study. Operated by the Reserve Bank of India (RBI), it is India’s largest payment system by volume and a game changer in the retail payments sphere. We examine the network topology of the NEFT system and analyse financial interconnectedness using network metrics of centrality. Using bilateral transaction information for each participating institution aggregated for March and April months of 2019, we build a network graph depicting the linkages. We use these data to explore the connections between various groups of banks in order to identify patterns. We also seek prominent players in the payment network in order of their systemic importance using a non-parametric methodology (Jaramillio et al., 2014). In summary, our findings show that out of the public sector, private sector and foreign banks that constitute around 83 per cent and 87 per cent of the total transactions by value on NEFT in the month of March and April respectively, the flow from private sector to public sector banks is very large, with public sector banks being net receivers in the system. We also present evidence of strong connections between public and public sector, and between private sector banks, nascent role of co-operative banks and newly established payment banks in NEFT. The rest of the article is structured into five sections. Following a brief introduction of the NEFT system in Section II, the literature on application of network science to financial economics is reviewed in Section III. The methodology and data are set out in Section IV. Empirical results and rankings of the top 20 most influential banks are presented in Section V. Section VI concludes the article with some policy perspectives. II. Primer on NEFT System NEFT traces its origin to the erstwhile Electronic Funds Transfer (EFT), the first payment system that enabled one-to-one fund transfers, which was introduced in India in the late 1990s. It was operational at 15 major centres in the country. In 2005, it was replaced by a richer and more efficient system, namely, NEFT. With over 210 entities including all scheduled commercial banks – public sector, private sector and foreign banks, cooperative banks, regional rural banks (RRBs), payment banks and small finance banks participating in the NEFT system, it is the largest payment system operated by the Reserve Bank in terms of transaction volume. It is a countrywide payment system facilitating one-to-one money transfer without any limits on transaction amount, though it is commonly used for retail payments upto ₹2 lakhs. In this system, settlements of fund transfer requests happen in half-hourly batches starting from 8 am to 7 pm on all bank working days. The NEFT operational flow chart is depicted in Chart 1. Beneficiaries are entitled to getting credit within two business hours from the batch in which the transaction was settled. If the NEFT transaction is not credited or returned within the stipulated time frame, banks are liable to pay penal interest to the affected customers calculated at the current Reserve Bank Liquidity Adjustment Facility (LAF) Repo Rate plus 2 per cent for the period of delay/till the date of refund as the case may be. Recently, the Reserve Bank has waived the NEFT processing charges to lower the transaction costs and provide fillip to the ongoing digital revolution. III. The Literature Network theory, owing its origin to physics, has witnessed applications to a wide range of areas in economics and finance: social networks (Grandjean, 2016; Dunbar et al., 2015), international trade (Ma and Mondragón, 2015; Kali and Reyes, 2007), foreign investment flows and cross country debt holdings (Elliott et al., 2014) and interbank exposures (Upper and Worms, 2004; Langfield et al., 2014; Cont et al., 2010; Iori et al., 2005). With the explosive growth in digital channels of financial transactions and the concomitant increase in complexity, payment systems have engaged the attention of scholars and practitioners. The increased attention towards payment systems is also aided by the relatively easier access of data as payment systems data is readily available with central banks. A seminal addition to this literature is the study of the network topology of interbank payment flows through the Fedwire Funds Service operated by the Federal Reserve in the US. Studies have shown that the right tail of the Fedwire payment network follows a power-law distribution1 (Soramaki et al., 2006; Pröpper et al., 2008; Embree and Roberts, 2009). The analysis of network topology of the Hungarian payment system was carried by Lubloy (2006). A similar study was done for the Clearing House Automated Payment System (CHAPS) operational in the UK by Becher et al., (2008). They looked at the variations in network properties over the course of a day to assess vulnerabilities due to settlement failures of different participants at particular times of the day. Settlement data from the Bank of Japan Financial Network System (BOJ-NET) were examined to study the structure of transactions in the interbank money market by Imakubo and Soejima (2010). The interbank exposures and the payment system networks in Mexico were studied and a measure of interconnectedness from the systemic risk perspective was proposed by Jaramillo et al., (2014). Thus, a common thread discernible in these studies is about discovering patterns in network layouts and identifying clusters which are difficult to detect using traditional economics. 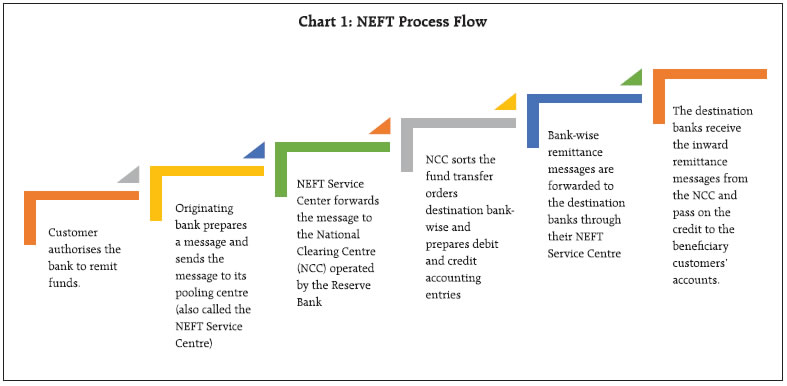 Payment systems resemble other complex networks as they share similar features like high clustering coefficient, scale-free degree distribution and small world phenomenon2 (Soramaki et al., 2006). The scope of network analysis extends beyond discovering patterns in network layouts which could be investigated in future studies. Network analysis can also find the core constituents of a network which would be of much interest in identifying systemically important entities. In this context, interbank networks have been modelled with a core–periphery structure (Borgatti et al., 1999)3. Network simulations with random graphs have been deployed to study contagion in financial networks. The potential impact of contagion due to idiosyncratic and systemic shocks with changes in network was explored by Gai and Kapadia (2010). The effect of the degree of connectivity on contagion was investigated and it was found that a small increase in connectivity increases the contagion effect initially; but after a certain threshold value, connectivity improves the ability of a banking system to absorb shocks (Nier et al., 2007). The contagion effects in relation to the magnitude of shock was examined and concluded that dense networks act as shock diffusers for small negative shocks but turn into shock amplifiers for sufficiently large shocks (Acemoglu et al., 2015). IV. Methodology and Data The network approach to understanding payment system differs from conventional economic modelling. For a meaningful discussion on the usefulness of network analysis, we provide a non technical description of network analysis. The most important component of network analysis is visualising the network. The payment network consists of a set of nodes, where each node represents a participating entity, i.e., scheduled commercial banks (SCBs) excluding small finance banks, RRBs, and small finance banks (SFBs) etc. The edges of the network represent the bilateral linkage between two parties either on transaction volume or transaction value basis. These edges are directed and reflect the direction of flow of money from one institution to another. The thickness of the edges is proportional to the associated linkage weights in terms of volume and value of payments settled (Barrat et al., 2004). We have used the Kamada-Kawai algorithm which plots the nodes of a network in a 3D space in a way so as to minimise the spring energy4 of the system (Kamada and Kawai, 1989). To get a clearer picture, we also plot group-wise network to assess broader patterns in flow of payments. Identification of important nodes forms another component of network analysis. Network models use various centrality measures for this purpose. In essence, it is a function that assigns a numerical value to each vertex of a network according to its influence on the others. Illustratively, local centrality measures take into consideration only the nodes and its adjacent vertices and edges. These measures consider only one node at a time; thereby losing vital information contained in rest of the network. Degree centrality (DC) counts the number of nodes adjacent to each vertex5. A node is more important if it has a higher degree. In-degree centrality and out-degree centrality take into consideration the incoming and outgoing edges, respectively. Strength centrality sums up the edge weights of all adjacent edges of each vertex. We also distinguish between inward and outward transactions as payment networks are directed graphs. Specifically, our degree and strength centrality measures are based on outward value transactions as they represent payment obligations settlement, which is crucial for payment systems. A node may have high degree but its connections may not be important from a network perspective. In such situations, degree measures may lead to wrong interpretations about the importance of a node. Global centrality measures consider direct and indirect connections across the entire network and, therefore, incorporate information on entire pattern of network. Within this framework, eigen vector centrality (EC) takes into account how well connected a node is and how many links their connections have, and so on through the network. On the other hand, pagerank centrality (PR) is a more sophisticated variant of EC designed by Google to rank webpages (Brin and Page, 1998). Each webpage is assigned a score based upon its number of in-coming links (its ‘in-degree’). These links are also weighted depending on the relative score of its originating node. Thus, PR takes link direction and weights into account which EC doesn’t (Disney, 2015). Betweenness centrality is particularly important for payment networks as it relates to being located at strategic points on the network which lie in the shortest path connecting two other nodes. A brief mathematical description of the centrality measures which form the core of our analysis is provided in the Annex. There are several other centrality measures which can be used to determine most influential nodes of a network, but there is no consensus as to which is the best one. We use these centrality measures which are important from financial contagion perspective and are computationally less intensive. Thereafter, we follow the methodology proposed by Jaramillo et al., (2014) to rank the nodes by creating a single index of centrality. We use the principal component analysis (PCA) approach to create an index with linear combination of z-scores of the centrality measures as all the measures are expected to be correlated. PCA helps in reducing dimensionality and redundancy of data. It reorients the axes and transforms the dataset by projecting the data along the directions in which the dataset shows maximum variance. It assigns optimal weights to each of these measures which are used to arrive at the final centrality score that incorporates all the information contained in these five scores. Evidence suggests that daily networks can be much noisier and sparser than monthly networks and they appear to change their structure from day to day in a purely random manner (Caccioli et al, 2018). Therefore, we have taken aggregate interbank data over a period of one month, March 2019. Our choice of this month is guided by the consideration that a lot of financial activity happens in this month owing to the closure of financial year in the country. We also collected data for April 2019 to get a comparative perspective. The data comprise interbank payment transaction volume and value between 210 entities which are categorised into eight groups; cooperative banks (COOP), financial institutions (FIN), foreign banks (FRN), payment banks (PMT), public sector banks (PUB), private sector banks (PVT), regional rural banks (RRBs) and small finance banks (SFBs). The FIN group comprises institutions like Deposit Insurance and Credit Guarantee Corporation (DICGC), National Bank for Agriculture and Rural Development (NABARD), Small Industries Development Bank of India (SIDBI), Export-Import Bank of India (EXIM Bank) and the Reserve Bank, Public Accounts Department (PAD). V. Empirical Results We present empirical analysis in three sections. The first section presents stylised facts. The second section enumerates the network topology and characteristics and presents the network visualisation with discernible patterns or layout of inter-linkages between institutions. Finally, we present the rankings of institutions based on their systemic importance. NEFT System: Stylised Facts A snapshot of the NEFT participants and their transactional activity is given in Chart 2 and Table 1. While cooperative banks outnumber the public sector, private sector and foreign banks, their contribution to payment traffic in terms of volume and value is not very significant. Private sector banks followed by public sector banks are the biggest players in the NEFT network both in volume and value terms.
| Table 1a: Payment Flow Statistics by Volume – March 2019 (in per cent) | | | | Beneficiary | | | Volume | COOP | FIN | FRN | PMT | PUB | PVT | RRB | SFB | Total | | Payee | COOP | 0.1 | 0.0 | 0.0 | 0.0 | 0.6 | 0.4 | 0.0 | 0.0 | 1.2 | | FIN | 0.1 | 0.0 | 0.0 | 0.0 | 12.2 | 0.6 | 0.2 | 0.0 | 13.2 | | FRN | 0.2 | 0.0 | 0.4 | 0.1 | 4.1 | 4.4 | 0.0 | 0.0 | 9.3 | | PMT | 0.0 | 0.0 | 0.0 | 0.0 | 0.2 | 0.1 | 0.0 | 0.0 | 0.4 | | PUB | 0.6 | 0.4 | 0.6 | 0.0 | 19.1 | 8.2 | 0.2 | 0.0 | 29.3 | | PVT | 1.2 | 0.1 | 1.5 | 0.1 | 30.3 | 12.4 | 0.3 | 0.1 | 46.1 | | RRB | 0.0 | 0.0 | 0.0 | 0.0 | 0.1 | 0.1 | 0.0 | 0.0 | 0.2 | | SFB | 0.0 | 0.0 | 0.0 | 0.0 | 0.3 | 0.1 | 0.0 | 0.0 | 0.4 | | Total | 2.3 | 0.6 | 2.6 | 0.2 | 67.0 | 26.2 | 0.8 | 0.2 | 100.0 |
| Table 1b: Payment Flow Statistics by Volume – April 2019 (in per cent) | | | | Beneficiary | | | Volume | COOP | FIN | FRN | PMT | PUB | PVT | RRB | SFB | Total | | Payee | COOP | 0.1 | 0.0 | 0.0 | 0.0 | 0.7 | 0.4 | 0.0 | 0.0 | 1.3 | | FIN | 0.2 | 0.0 | 0.0 | 0.0 | 9.7 | 0.4 | 0.1 | 0.0 | 10.5 | | FRN | 0.2 | 0.0 | 0.4 | 0.1 | 4.2 | 4.8 | 0.0 | 0.0 | 9.8 | | PMT | 0.0 | 0.0 | 0.0 | 0.0 | 0.3 | 0.1 | 0.0 | 0.0 | 0.4 | | PUB | 0.6 | 0.4 | 0.7 | 0.1 | 19.6 | 8.8 | 0.2 | 0.1 | 30.4 | | PVT | 1.2 | 0.2 | 1.7 | 0.1 | 30.4 | 13.0 | 0.4 | 0.1 | 47.1 | | RRB | 0.0 | 0.0 | 0.0 | 0.0 | 0.1 | 0.1 | 0.0 | 0.0 | 0.2 | | SFB | 0.0 | 0.0 | 0.0 | 0.0 | 0.2 | 0.1 | 0.0 | 0.0 | 0.3 | | Total | 2.4 | 0.7 | 2.9 | 0.3 | 65.2 | 27.6 | 0.8 | 0.2 | 100.0 |
| Table 2a: Payment Flow Statistics by Value – March 2019 (in per cent) | | | | Beneficiary | | | Volume | COOP | FIN | FRN | PMT | PUB | PVT | RRB | SFB | Total | | Payee | COOP | 0.1 | 0.0 | 0.0 | 0.0 | 0.5 | 0.4 | 0.0 | 0.0 | 1.1 | | FIN | 0.0 | 0.4 | 0.4 | 0.0 | 7.2 | 2.8 | 0.0 | 0.0 | 10.9 | | FRN | 0.1 | 0.1 | 4.9 | 0.3 | 3.3 | 7.1 | 0.0 | 0.0 | 15.8 | | PMT | 0.0 | 0.0 | 0.3 | 0.0 | 0.0 | 0.1 | 0.0 | 0.0 | 0.4 | | PUB | 0.5 | 0.9 | 2.1 | 0.0 | 15.4 | 12.6 | 0.1 | 0.1 | 31.7 | | PVT | 0.7 | 0.4 | 5.1 | 0.1 | 16.7 | 16.2 | 0.1 | 0.2 | 39.5 | | RRB | 0.0 | 0.0 | 0.0 | 0.0 | 0.2 | 0.1 | 0.0 | 0.0 | 0.3 | | SFB | 0.0 | 0.0 | 0.0 | 0.0 | 0.1 | 0.1 | 0.0 | 0.0 | 0.3 | | Total | 1.5 | 1.9 | 12.9 | 0.4 | 43.5 | 39.4 | 0.3 | 0.3 | 100.0 |
| Table 2b: Payment Flow Statistics by Value – April 2019 (in per cent) | | | | Beneficiary | | | Volume | COOP | FIN | FRN | PMT | PUB | PVT | RRB | SFB | Total | | Payee | COOP | 0.1 | 0.0 | 0.0 | 0.0 | 0.5 | 0.6 | 0.0 | 0.0 | 1.3 | | FIN | 0.1 | 0.0 | 0.2 | 0.0 | 6.8 | 0.7 | 0.0 | 0.0 | 7.7 | | FRN | 0.1 | 0.2 | 5.5 | 0.3 | 3.5 | 8.0 | 0.0 | 0.0 | 17.6 | | PMT | 0.0 | 0.0 | 0.4 | 0.0 | 0.0 | 0.2 | 0.0 | 0.0 | 0.6 | | PUB | 0.5 | 0.4 | 2.3 | 0.0 | 14.6 | 13.4 | 0.1 | 0.1 | 31.2 | | PVT | 0.7 | 0.4 | 6.3 | 0.2 | 16.4 | 16.6 | 0.1 | 0.1 | 40.9 | | RRB | 0.0 | 0.0 | 0.0 | 0.0 | 0.3 | 0.1 | 0.0 | 0.0 | 0.4 | | SFB | 0.0 | 0.0 | 0.0 | 0.0 | 0.1 | 0.1 | 0.0 | 0.0 | 0.2 | | Total | 1.5 | 1.0 | 14.8 | 0.5 | 42.2 | 39.6 | 0.2 | 0.2 | 100.0 | The bulk of transactions (over 80 per cent of the total payment volume and value) takes place between public sector, private sector and foreign banks (Tables 1 and 2). Based on the monthly value aggregates, public sector banks are the net receivers in the network with inflows exceeding 40 per cent in both the months, thereby far exceeding their outflows of around 31 per cent. The FIN group, with the Reserve Bank as the main constituent, acts as a net transmitter in the network. Its outward flows in March and April 2019 were 10.9 per cent and 7.7 per cent, respectively, as opposed to the inward flows which remained between 1 and 2 per cent in March and April. It is to be emphasised that these conclusions are based on monthly aggregates and the net receiver and transmitter pattern may differ in every batch settlement. Network Topology NEFT network is a large network consisting of around 210 nodes and 23 thousand edges in the March and April month of 2019. Average in and out degree across all categories of banks is about 109. It indicates that on an average, every bank is connected to more than half of the banks in the network. The payment network has a high network density, i.e., the ratio of actual number of edges to the maximum possible number of edges (connectivity) of more than 50 per cent. Reciprocity, defined as the ratio of bidirectional links to the total number of links in a network, is found to be 87.6 per cent, suggesting that almost for every outward link from a bank, there is an inward link. A high reciprocity is an intuitive phenomenon given the clearing structure of NEFT which allows participants to link to another NEFT enabled bank directly. In an ideal scenario where every bank has transaction with every other bank in the network, reciprocity would be equal to unity or 100 per cent. However, the transactions data depict that some banks did not transact with some banks in the network leading to a reciprocity less than unity. The basic network properties are summarised in Table 3. Network Characteristics Network visualisation helps in assessing broad patterns in the payment network. The degree distribution of the network shows that public sector and private sector banks are at the extreme right end of the distribution, implying high connectedness with other participants (Chart 3). In Chart 4, March 2019 network appears to be denser as compared to April 2019 which is in concordance to its higher network density as indicated in Table 3. Public and private sector banks lie at the centre of the network. The high transfer value between public sector to public sector; private sector to private sector; and public sector to private sector and vice versa as seen in Table 2 is presented diagrammatically in Chart 4. The strong intra-linkages within public sector and private sector banks and inter-linkages between public sector and private sector banks are quite discernible. The flow from private sector to public sector banks is much stronger than its counterpart. The public sector and private sector banks together account for more than 60 per cent of the total transactions by value in both the months reflecting their greater involvement in the payment network. In contrast, the co-operative, regional rural, payment and small finance banks have lesser connectivity within the payment network. The thickness of edges in Chart 4b indicate the magnitude of transaction value between bank groups and intra-group transactions. | Table 3: Properties of NEFT network | | | March 2019 | April 2019 | | Nodes | 212 | 213 | | Edges | 23,1 | 23,0 | | Total Volume (million) | 242.4 | 203.4 | | Mean volume per node (million) | 1.1 | 1.0 | | Total Value (₹ billion) | 25,5 | 20,5 | | Mean value per node (₹ billion) | 120.1 | 96.5 | | Degree (Max, Average, Min) | (417,217.8,2) | (417,216.2,2) | | Out | (208,108.9,0) | (208,108.1,0) | | In | (210,108.9,0) | (209,108.1,1) | | Reciprocity (per cent) | 87.6 | 87.5 | | Network density (per cent) | 51.6 | 51.0 | Top 20 Banks in NEFT Network As centrality measures try to capture the same essence in a variety of ways, without loss of generality, we expect the measures to be correlated to some extent (Table 4). We, therefore, take the help of PCA approach to reduce dimensionality and redundancy of data. It gives out principal orthogonal components and assigns optimal weights to each of these measures. The first principal component (PC) alone explains about 55 per cent of the variation in centrality measures (Table 5). We use the coefficients of the first PC in constructing the index of centrality (Table 6). | Table 4: Correlation Between Centrality Measures | | | March 2019 | April 2019 | | zdg | zsc | zbw | zec | zpr | zdg | zsc | zbw | zec | zpr | | zdg | 1 | 0.43 | 0 | 0.97 | 0.46 | 1 | 0.44 | 0.01 | 0.97 | 0.46 | | zsc | 0.43 | 1 | -0.05 | 0.35 | 0.92 | 0.44 | 1 | 0.01 | 0.36 | 0.95 | | zbw | 0 | -0.05 | 1 | 0.02 | -0.07 | 0.01 | 0.01 | 1 | -0.01 | -0.02 | | zec | 0.97 | 0.35 | 0.02 | 1 | 0.38 | 0.97 | 0.36 | -0.01 | 1 | 0.37 | | zpr | 0.46 | 0.92 | -0.07 | 0.38 | 1 | 0.46 | 0.95 | -0.02 | 0.37 | 1 | | *zdg=normalised degree centrality; zsc = normalized strength centrality; zbw=normalised betweenness centrality; zec=eigen vector centrality; zpr = normalised pagerank centrality |
 While all the banks on the NEFT system are directly connected to each other by design, incidentally, some banks may not have transactions with each other in a month. In cases where direct transaction linkages are absent, betweenness coefficient gives high importance to those nodes that lie along the path connecting these nodes. As expected, we get a low betweenness coefficient since most of the participants have direct transaction linkages with other participants in the network. We rank the nodes based on the final centrality score scaled between 0 and 1. | Table 5: Importance of Components | | | March 2019 | April 2019 | | PC1 | PC2 | PC3 | PC4 | PC5 | PC1 | PC2 | PC3 | PC4 | PC5 | | Proportion of Variance | 0.55 | 0.23 | 0.19 | 0.02 | 0.00 | 0.56 | 0.23 | 0.20 | 0.01 | 0.00 | | Cumulative Proportion | 0.55 | 0.79 | 0.98 | 1.00 | 1.00 | 0.56 | 0.79 | 0.99 | 1.00 | 1.00 | | Standard Deviation | 1.66 | 1.08 | 0.98 | 0.29 | 0.15 | 1.67 | 1.07 | 1.00 | 0.22 | 0.15 |
| Table 6: Coefficients of the First PC | | Centrality measure | March 2019 | April 2019 | | Degree | 0.52 | 0.52 | | Strength | 0.49 | 0.49 | | Betweenness | -0.03 | 0.00 | | Eigen vector | 0.49 | 0.49 | | Pagerank | 0.50 | 0.50 | Based on the unified centrality measure, we arrive at the rankings of top 20 banks, with a mix of public sector, private sector and foreign banks. Top 20 banks in March and April 2019 included 10 public sector banks, 6 private sector banks and 4 foreign banks (Table 7). We remove the Reserve Bank from the top 20 constituents as, being a central bank and a facilitator, its odds of perpetrating a settlement failure are zero. We find that the sub-network of top 20 banks in the network contributes to around 64 per cent of the payment traffic (excluding FIN group) by volume and 68 per cent of the payment traffic (excluding FIN group) by value in the months of March and April. Owing to low volume and value contribution to the network, none of the cooperative banks, RRBs, SFBs and payment banks feature in this list. This study brings out an interesting insight, i.e., some foreign banks being very influential in the NEFT system, despite their relatively small share of 5.7 per cent in total assets of SCBs. | Table 7: Top 20 Constituents | | | March 2019 | April 19 | | zdg | zsc | zbw | zec | zpr | pca | zdg | zsc | zbw | zec | zpr | pca | | COOP | | | 10 | | | | | | 8 | | | | | FRN | 4 | 4 | 1 | 3 | 5 | 4 | 3 | 5 | 3 | 2 | 5 | 4 | | PMT | | | 5 | | | | | | 7 | | | | | PUB | 9 | 8 | | 10 | 9 | 10 | 11 | 8 | | 11 | 9 | 10 | | PVT | 7 | 8 | 2 | 7 | 6 | 6 | 6 | 7 | | 7 | 6 | 6 | | RRB | | | | | | | | | | | | | | SFB | | | 2 | | | | | | 2 | | | | We rank all the NEFT-enabled banks based on individual centrality measures and the unified centrality measure derived using PCA approach (Chart 5). All indices, except betweenness, indicate top ranks being occupied by public sector and private sector banks. However, we do not find these heavy-weight banks in the top ranks sorted by the betweenness index. We find 10 cooperative banks, 5 payment banks and 2 small finance banks in the top 20 spots when sorted by betweenness for March 2019 with a more or less similar picture in April 2019 (Chart 5, zbw). As explained before, the betweenness measure quantifies the number of times a node acts as a bridge along the path between two other nodes not having direct transaction linkage. In our case, it provides an alternate perspective on rankings of participants wherein some of the cooperative banks, payment banks and small finance banks are serving as connecting nodes for those banks which do not share a direct linkage in the NEFT network. While state-level and larger urban co-operative banks act as conduits for smaller co-operative banks, payment banks have a larger presence as they are niche banks operating mainly in the payments arena by offering banking functions such as payments, deposits, remittances, internet banking, etc. 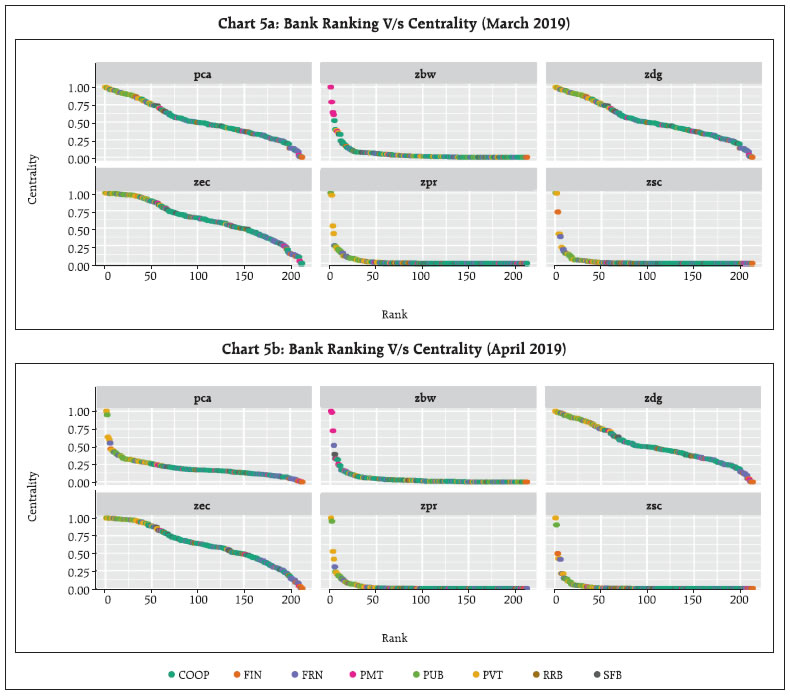 VI. Conclusion Network analysis provides new tools for analysing payment systems at the broader level. It facilitates the identification of patterns/layout at a system level which, otherwise, is difficult to assess using bilateral transaction volume and value level analysis. We study network topology and structure of NEFT interbank fund transfers so as to better comprehend the flow of payments in the network. Our study discovers intuitively acceptable patterns in network layouts and identifies clusters which would have been difficult to detect using conventional economics. It shows that public sector, private sector and foreign banks constituted around 83 per cent and 87 per cent of the total transactions by value on NEFT system in March and April, respectively. Payment flows are particularly strong within the public-to-public sector and private-to-private sector banks network. The flow from private-to-public sector banks is also very large with public sector banks being the net receivers in the system. We also observe large net outflows from the Reserve Bank to the NEFT participants in the month of March and April. A study of all the twelve months of NEFT transactions would give us a more holistic idea about the seasonal patterns therein. Ideally, all NEFT enabled banks are connected to each other by design. However, our study also presents evidence on some banks having no transactions with some banks in the network. On a broad level, most public sector, private sector and foreign banks share direct transaction linkage with each other; however, some smaller banks, including cooperative banks, do not have such direct linkages. In such cases, bigger cooperative banks and payment/small finance banks act as bridges between banks which don’t have transaction linkages. Therefore, we find higher betweenness in cooperative banks, small finance banks and payment banks and a low betweenness index for the major public sector, private sector and foreign banks. Settlement failures or lags by large banks which have payment obligation to large number of participants, may have impact on the stability of the payment system. In this context, this analysis serves a useful purpose by enabling us to find a holistic ranking of important players in the payment industry taking into consideration several aspects such as interconnections, degree, strength, position in network, etc. From a systemic perspective, we find that the top 20 banks have a large share in the payments value and volume. Settlement failures in them can cause operational interruptions having implications for the stability of entire payment/financial system. The topology of payment networks is changing rapidly with the advent of financial technologies. These changes can be assessed through the changes happening in network topology over a longer period of time. Since, payments data can be made available without much lag, network analysis can be useful in tracking interconnectedness on a real time basis. The analysis of payment systems is complementary to the existing network analysis of interbank exposures. Such analysis will be useful in shedding light on the evolution of payment networks in India and pinpointing risks, if any, from concentration of payment flows. Evidence in network literature suggests that highly interconnected networks may aid in shock amplification as well as shock attenuation. However, the mechanism of amplification and attenuation, and their characterisation with degree distribution and topological attributes is an area for further research. Apart from contributing to financial system stability analysis, the study is expected to motivate further research relating to India’s payment system. References Acemoglu, D., A. Ozdaglar and A.T. Salehi (2015), “Systemic Risk and Stability in Financial Networks”, The American Economic Review, 105(2), 564-608. Albert, R., H. Jeong and A.L. Barabasi (1999), “ Diameter of the World Wide Web”, Nature, 401(130). Available at SSRN: https://ssrn.com/abstract=1733528 or http://dx.doi.org/10.2139/ssrn.1733528 Barrat, A., M. Barthélemy, R. P. Satorras, and A. Vespignani (2004), “The architecture of complex weighted networks”, PNAS March 16, 2004 101 (11) 3747-3752. Becher, C., S. Millard and K. Soramäki (2008), “The network topology of CHAPS Sterling”, Bank of England Working Paper No. 355, November. Borgatti, S.P. and M.G. Everett (1999), “Models of core/periphery structures”, Social Networks 21, 375–395. Brin, S. and L. Page (1998). The Anatomy of a Large-Scale Hypertextual Web Search Engine. Computer Networks and ISDN Systems, 30, 107- 117. Caccioli, F., P. Barucca and T. Kobayashi (2018). Network models of financial systemic risk: a review. Journal of Computational Social Science, 1, 81–114. Chapman, J., L. Embree, and T. Roberts (2011). Payment networks: A review of recent research. Bank of Canada Review, winter 2010–2011. Cont, R., M. Amal and E.B. Santos (2010). Network Structure and Systemic Risk in Banking Systems. December 1. Cytoscape User Manual. Navigation and Layout. Accessed 13 Jul 2019. http://manual.cytoscape.org/en/stable/Navigation_and_Layout.html#edge-weighted-spring-embedded-layout Disney, A. (2015), “Eigen Centrality and PageRank”, Cambridge Intelligence, Nov 2, 2015. https://cambridge-intelligence.com/eigencentrality-pagerank/ Dunbar, R.I.M., V. Arnaboldi, M. Conti and A. Passarella (2015), “The structure of online social networks mirrors those in the offline world”, Social Networks, 43, 39–47. Elliott, M., B. Golub, and M. O. Jackson (2014), “Financial Networks and Contagion”, American Economic Review, 104(10), 3115–3153. Embree, L. and T. Roberts (2009), “Network Analysis and Canada’s Large Value Transfer System”, Bank of Canada Discussion Paper 2009/13, December. Gai, P. and S. Kapadia (2010), “Contagion in financial networks”, Proceedings: Mathematical, Physical and Engineering Sciences, 466(2120), 2401-2423. Grandjean, M. (2016), “A social network analysis of Twitter: Mapping the digital humanities community”, Cogent Arts and Humanities, Taylor Francis. https://doi.org/10.1073/pnas.0400087101 Imakubo, K. and Y. Soejima (2010), “The Transaction Network in Japan’s Interbank Money Markets”, Bank of Japan, Monetary and Economic Studies, November. Iori, G., G.D. Masi, O.V. Precup, G. Gabbi and G. Calderelli (2005), “A Network Analysis of the Italian overnight Money Market”, City University London, Discussion Paper Series 05/05. Jaramillo, S.M., B.A. Kabadjova and B.B. Benitez, J.P.S. Margain (2014), “An empirical study of the Mexican banking system’s network and its implications for systemic risk”, Journal of Economic Dynamics and Control, 40, 242 – 265. Kali, R. and J. Reyes (2007), “The Architecture of Globalization: A Network Approach to International Economic Integration”, Journal of International Business Studies, 38(4), 595-620. Kamada, T. and S. Kawai (1989), “An Algorithm for Drawing General Undirected Graphs”, Information Processing Letters, 31, 7-15. Langfield, S. and Z. Liu and T. Ota (2014), “Mapping the UK interbank system”, Journal of Banking and Finance, 45, 288–303. Lublóy, Á. (2006), “Topology of the Hungarian large-value transfer system”, MNB Occasional Papers 2006/57. Ma, A. and Mondragón, R.J. (2015), “Rich-Cores in Networks”, PLoS ONE, 10(3): e0119678. Nier, E., J. Yang, T. Yorulmazer and A. Alentorn (2007), “Network models and financial stability’’, Journal of Economic Dynamics and Control, 31, 2033–2060. Oesterreichische National Bank (OeNB) Financial Stability Report 7 “An Empirical Analysis of the Network Structure of the Austrian Interbank Market’’, 77-87. Pröpper, M., Lelyveld, I. V. and Heijmans, R. (2008), "Towards a Network Description of Interbank Payment Flows", De Nederlandsche Bank, Working Paper No. 177. Soramäki, K., M.L. Bech, J. Arnold, R.J. Glass and W.E. Beyeler (2006), “The Topology of Interbank Payment Flows”, Federal Reserve Bank of New York Staff Reports 243, March. Upper, C. and A. Worms (2004), “Estimating bilateral exposures in the German interbank market: Is there a danger of contagion?”, European Economic Review, 48, 827–849.
Annex Definition of Some Important Network Metrics This annex is a brief description of some important centrality measures that have been used in this study.
|