This study examines the influence of demographic changes on macroeconomic outcomes in India using generalized method of moments. The estimation results show that population growth and age dependency ratio have inverse relation with the growth in real GDP and per capita income, and positive relation with inflation. Increase in working age population, on the other hand, contributes to higher economic growth. An aging population is deflationary in nature though improves the current account balance. While the declining age dependency ratio offers a demographic dividend for India, the realisation of the same would require an environment empowering the labour force with right skills and enabling their gainful employment in productive uses. Introduction India’s favourable demographics have placed it in an enviable position in an aging world, largely due to the potential macroeconomic dividends that accrue to the young: while an increase in working age population is found generally to increase per capita GDP growth, an increase in the share of elderly/dependents is found to lower per capita GDP growth (IMF, 2004; Kim, 2016). Demography, however, is not destiny; automation and technological advances have mitigated the adverse impact of population aging in advanced economies. Even favourable demographics by themselves can only be a necessary condition for greater prosperity. Harnessing their potential is the key sufficient condition. India’s current population of 1.3 billion is projected to rise to 1.4 billion by 2025, 1.5 billion by 2030 and 1.6 billion by 2050, accompanied by major demographic changes in terms of age profile of the people resulting from rising life expectancy and falling fertility (UN, 2019). Will these projected demographics influence future macroeconomic outcomes? Motivated by this existential question, this article undertakes an exploration of how demographic factors have moved over time and in particular, how they have co-moved with key macroeconomic variables and what associations they portend for the decades not too far ahead. The rest of the article is structured into five sections: Section II provides a brief theoretical backdrop along with an overview of the lessons and findings of various studies detailing channels through which demographic changes could influence macroeconomic outcomes. Some stylised facts relating to the current demographic structure in India and changes over time are furnished in Section III. Section IV explains the data and methodology used in an empirical enquiry into the role of demographic factors in macroeconomic developments in India. Concluding remarks are set out in Section V. II. Theoretical Backdrop and Review of Empirical Literature Demography in any country broadly moves through five stages (Blacker, 1947). In the first stage, a country experiences high birth rates and death rates leading to stagnant population with low life expectancy. As the country’s morbidity burden falls, falling crude death rate (CDR) and high crude birth rate (CBR)1 mark the beginning of the second phase of demographic transition, characterised by a bulging dependent population in the form of children in the age group of 0-14 years. Slowly, with improved education, fertility rates decline and a country experiences an expansion in the group of economically active adult population in the third stage. In the next stage, the average longevity of the population gradually rises and the population stabilises with the birth rate and death rate tending to equalise. Decline in population in response to death rates exceeding birth rates marks the final stage of demographic transition (Chart 1). 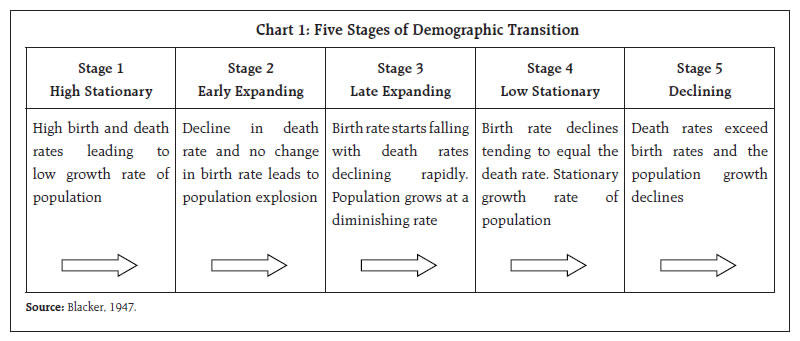 Theoretical research on the macroeconomic ramifications of demographic changes dates back to the 18th century when Malthus (1798) suggested that economic growth would fail to match up to the sustained rapid increase in world population, leading eventually to scarcity of resources and a doomsday scenario. However, as technological innovations enabled higher agricultural production and robust economic growth, there emerged a group of demographic optimists who advocated the idea that population growth could be an asset for an economy. According to them, countries with larger population and the capacity to take advantage of economies of scale would benefit from bigger domestic markets and division of labour, both boosting economic growth (Harrod, 1939; Solow, 1956). There are several channels through which demographic changes can impact macroeconomic outcomes. First, the age profile and the growth rate of the population directly impact the availability of labour – a key factor input in the production process. As a country moves from the second stage of demographic evolution to the third and fourth stages, there emerges a demographic dividend with working-age population significantly exceeding the number of dependents. In addition, lower fertility rates and increasing access to higher education enable more and more women to enter the workforce, leading to a further increase in labour supply, higher economic growth and higher tax collections for the Government. Age profile could also influence tax rates and the incentive to work. For instance, higher working age population may improve buoyancy in tax collections and facilitate the lowering of tax rates which, in turn, could boost the incentive to work. Second, Life-cycle hypothesis suggests that the age structure of the population operates through the saving-investment channel. People start as net borrowers during their youth, become net savers during working years, and eventually turn dis-savers after retirement. Thus, an increase in the working age population can increase the level of aggregate savings in an economy, expanding the availability of domestic financing for growth. The neoclassical theory predicts that economic growth accelerates from the second stage of demographic transition as population sensitive investment (such as construction and housing) picks up pace to provide employment and housing to the new entrants into the labour force (Kuznets, 1958). Third, demographic changes can influence growth (and inflation) through the aggregate demand channel. The growth of a young population in the second stage and economically active population in the third stage of demographic transition leads to an increase in aggregate demand. The secular stagnation hypothesis (Hansen, 1938) also relies on the demand channel to explain periods of low inflation and low growth in the late fourth and fifth stages of demographic transition when population growth declines. Fourth, demographic factors have important implications for Government finances. Life cycle models predict that higher tax revenues and increased public saving help improve the fiscal position during the middle stages of demographic changes. On the other hand, a larger share of elderly dependent individuals in the later stages necessitates higher public expenditure on healthcare services and pensions, leading to worsening of Government finances. There has been a proliferation of empirical examination of the macroeconomic impact of demographic changes (Annex Table 1). A general consensus converges towards the finding that the dependency ratio has a negative impact on growth in GDP/ per capita income (Joe and Agrawal, 2015; Yoon, et al., 2014 and Sundman, 2011). Countries with higher human capital tend to have lower fertility rates and higher real per capita GDP growth (Barro, 1991; Lee, et al., 2016; Mohan, 2004). The age structure plays a significant role in determining the inflation rate, though the direction and magnitude of the impact vary across countries and over time (Han, 2019; Juselius and Takats, 2018; Bobeica and Sun, 2017). Population aging may influence the current account balance through the savings-investment channel (Higgins, 1998). A relatively faster ageing country will experience an improvement in its current account balance due to a decline in domestic investment demand that is greater than the reduction in national saving. Thus, population aging may lead to international capital flows from countries with an aging population to countries with a relatively younger population such as newly industrialised and developing countries (Fougère and Mérette, 1999). In the Indian context, both the level and growth rate of the working age population have large impact on economic growth (Aiyar and Mody, 2011). State-level analysis shows that the BIMARU2 states are likely to experience an increase in the share of working age population in the years to come (Utsav Kumar, 2010). Thus, India’s demographic dividend critically depends on the ability of the BIMARU states to exploit the bulge in working-age population. The first demographic dividend in the form of higher availability of working age population could accrue during 1980-2035, while the second demographic dividend in the form of higher savings to support retirement could gain prominence from 2035. The demographic dividend could matter till 2070 (Ladusingh and Narayana, 2011). III. Stylised Facts Annual data from the World Bank (World Development Indicators) suggest that India is currently in the third stage of demographic transition with a rapidly declining crude birth rate (CBR) and crude death rate (CDR), though the CBR remains higher than the CDR (Chart 2.a). During the period from 1975 to 2017, the fertility rate fell from 5.2 to 2.3 births per women. Consequently, the population growth rate slowed from 2.3 per cent in 1975 to 1.1 per cent in 2017 (Chart 2.b) and is expected to slow further to 0.03 per cent by 2055-60 after which it may turn negative (UN, 20193). 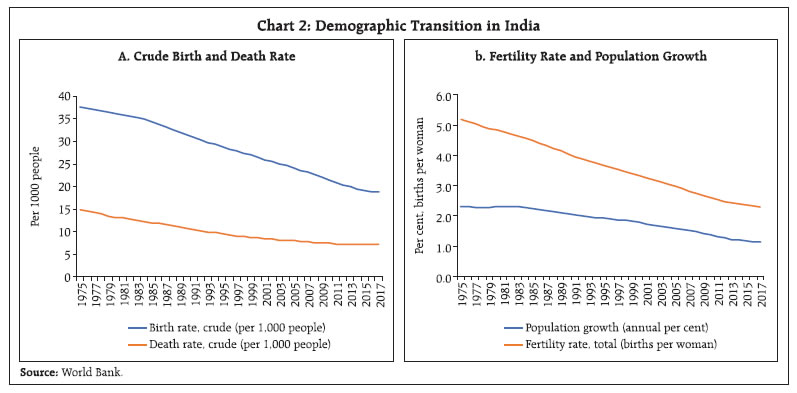 The age structure of India’s population has undergone significant changes over the period 1975-2017 – the share of the working age (15-64 age group) in the total population increased from 56.5 per cent to 66.2 per cent; the share of the young (0-14 year old) recorded a decline from 40 per cent to 27.8 per cent; and the share of the elderly (65 years and above) showed a marginal increase from 3.5 percent to 6 percent (Chart 3a). 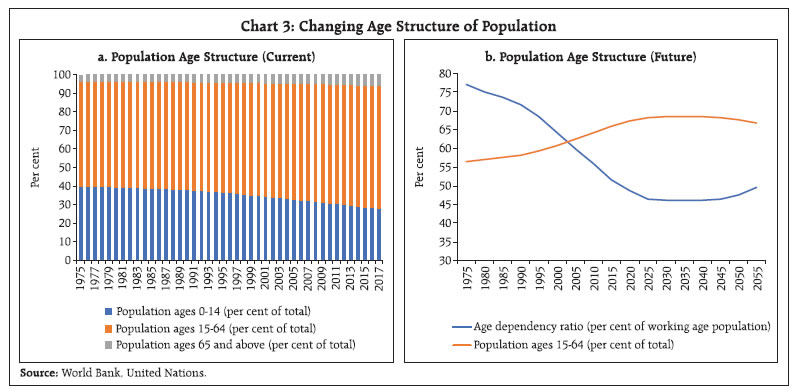 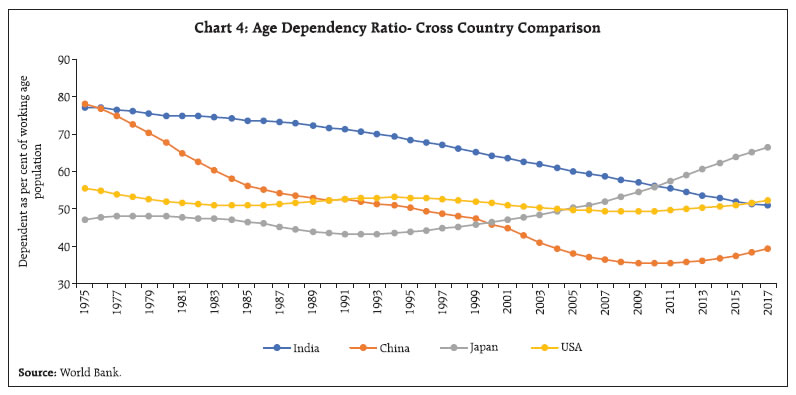 This changing age structure can be best represented by the age dependency ratio - the ratio of total dependent population (0-14 years and 65+ years old) to total working age population: a lower value of the ratio implies a more productive population. India’s age dependency ratio has been declining and is likely to decline till 2025 after which it may remain stagnant till 2040 and increase thereafter (UN, 2019) (Chart 3b). At a disaggregated level, the old dependency ratio (ratio of old dependent population to working age population) is increasing gradually, while the young dependency ratio (ratio of young dependent population to working age population) is declining rapidly. Between 1975 and 2017, the old dependency ratio increased from 6.2 per cent to 9.0 per cent and the young dependency ratio fell from 71.0 per cent to 41.9 per cent. A comparison of India’s age dependency ratio with other countries, viz., China, USA and Japan, shows that India stands at an advantageous position-age dependency ratios for those countries have started rising while it continues to fall for India (Chart 4). The population pyramid for India also shows a bulge in the 10-24 age cohorts, implying that the incremental increase in India’s labour force each year will continue to be significant several years ahead (Chart 5), offering the opportunity to reap the demographic dividend for next few decades. Labour force participation rate (LFPR) in India is declining during the last decade and half despite a significant and growing share of working age population (Chart 6.a). Female LFPR in India is one of the lowest in the world (ILO, 20134). There is also a sharp fall in the youth LFPR since 2004-05 (Chart 6.b). The declining LFPR could be attributed to a number of factors, viz., increasing enrollment in education; rising household incomes; and lack of adequate productive employment opportunities. For both male and female groups, the unemployment rates are higher for the more educated, with graduates having the highest unemployment rates all through the period from 1993-1994 to 2017-18 (Chart 6c and 6d). Comparatively, the unemployment rates for males and females with secondary education are significantly lower, implying that a large proportion of India’s labour force is engaged in informal and unskilled/semi-skilled work with possible dearth of jobs for skilled labour. 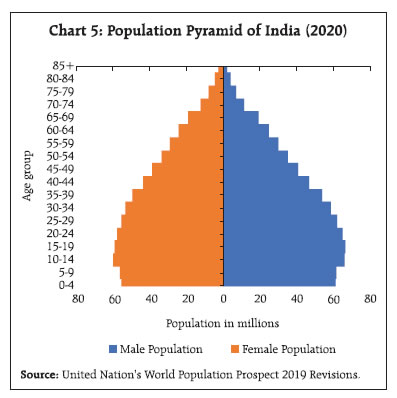 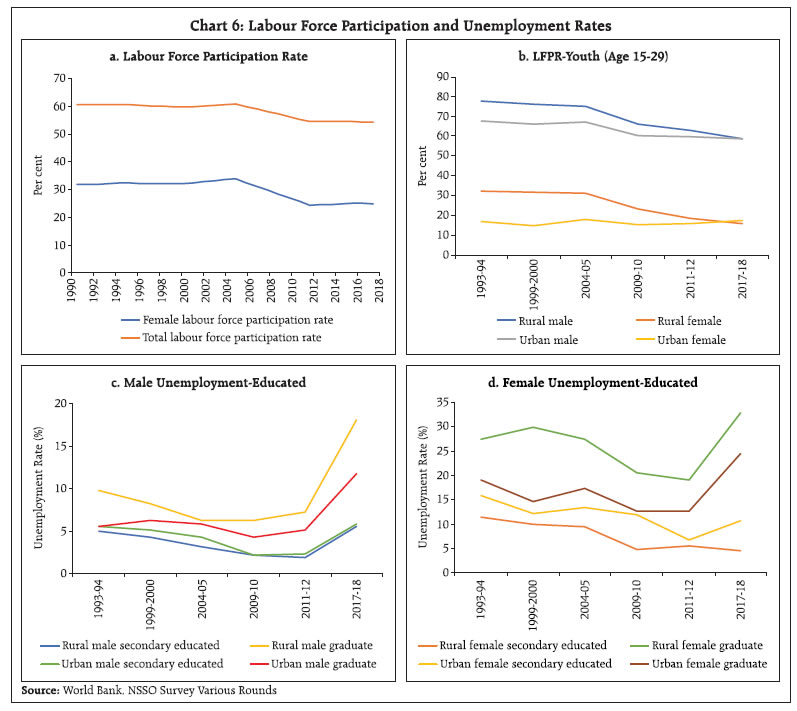 IV. Empirical Analysis This section empirically examines how changes in the size and composition of India’s population influence macroeconomic outcomes. The study covers the time-period 1975-2017 for which consistent data for the variables under consideration are available. The size of the population and change therein are captured through the population growth rate, while changes in the composition of the population are captured through age dependency ratio, the share of working age population in total population and the growth in aging population (i.e., population above 65 years of age). The macroeconomic variables considered for the analysis are real GDP growth, per capita income growth, inflation, fiscal balance and the external current account balance. Data on demographic variables are sourced from the World Development Indicator database of the World Bank, while data on macroeconomic variables are obtained from the Handbook of Statistics on Indian Economy published by the Reserve Bank of India. In view of potential endogeneity problems, the generalised method of moments (GMM) methodology has been used for estimating the following model: Where Y is the dependent variable, i.e., the macroeconomic variable of interest. X is the explanatory variable, i.e., the relevant demographic variable, considered one at a time to avoid multicollinearity (Annex Table 2). The Unit root tests indicate that the relevant dependent and explanatory variables are I (0) (Annex Table 3)5. The efficiency of the GMM estimator depends on the validity of instruments. In this case, lagged values of the dependent and explanatory variables are used as instruments for the GMM. The robustness of the model is examined through Sargan-Hansen J test, which requires acceptance of the null - that over-identifying restrictions are valid- to establish validity of the instruments. The results indicate that higher population growth in India is not associated with higher real GDP growth (Table 1). This is because higher population growth in India had resulted from higher fertility and birth rates. While higher birth rates increase the number of young in the population, a higher fertility rate inhibits women joining the workforce including through higher education and both adversely impact effective labour supply. Rather than population growth, it is the growth of working age population as well as labour force participation rates that matter for economic growth. As expected, the age dependency ratio in India has an inverse relationship whereas the share of working age population has a positive relationship with real GDP growth. This implies that if the dependency ratio increases, GDP growth suffers. On the other hand, the increased share of working age population increases labour supply and thus results in higher production and real GDP growth6. The impact of growth in elderly population on GDP turned out to be negative though statistically insignificant. | Table 1: Impact of Demographic Changes on Real GDP Growth | | Explanatory Variables | Dependent Variable: Real GDP Growth | | (1) | (2) | (3) | (4) | | Population Growth | -2.82*** | | | | | Age Dependency Ratio | | -0.15*** | | | | Share of Working Age Population | | | 0.09*** | | | Growth in Elderly Population | | | | -1.23 | | Real GDP Growth (-1) | -0.10 | -0.12 | -0.11 | -0.19* | | Constant | 11.85*** | 16.50*** | | 7.84** | | Time Trend | | | 0.07** | 0.14*** | | Adjusted R-squared | 0.12 | 0.13 | 0.13 | 0.15 | | Sargan-Hansen J-test | (0.70) | (0.90) | (0.89) | (0.50) | Note: 1. ***, ** and * denote significant at 1%, 5% and 10% level, respectively.
2. Figures in the parentheses represent respective p-values. |
| Table 2: Impact of Demographic Changes on Per Capita Income Growth | | Explanatory Variables | Dependent Variable: Per Capita Income Growth | | (1) | (2) | (3) | (4) | | Population Growth | -3.92*** | | | | | Age Dependency Ratio | | -0.20*** | | | | Share of Working Age Population | | | 0.03** | | | Growth in Elderly Population | | | | -0.56 | | Per Capita Income Growth (-1) | -0.10 | -0.12 | -0.12 | -0.15 | | Constant | 11.75*** | 17.89*** | | 3.51 | | Time Trend | | | 0.13*** | 0.14*** | | Adjusted R-squared | 0.23 | 0.24 | 0.25 | 0.25 | | Sargan-Hansen J-test | (0.71) | (0.91) | (0.94) | (0.27) | Note: 1. ***, ** and * denote significant at 1%, 5% and 10% level, respectively.
2. Figures in the parentheses represent respective p-values. | The impact of demographic variables on per capita income growth is largely similar to that for overall real GDP growth. A higher age dependency ratio has an adverse impact on per capita income, whereas an increased share of the working age population leads to an increase in per capita income (Table 2). There is very limited research on the impact of population dynamics on inflation. The estimation results indicate that higher population growth and age dependency ratio impact CPI inflation positively, presumably by increasing aggregate demand relative to supply. The impact of the working age population on inflation was not found to be statistically significant. The negative sign of the coefficient for the growth of elderly population signifies that an increase in aging population could be deflationary due to lower aggregate demand even if this stage involves dis-saving (Table 3). | Table 3: Impact of Demographic Changes on CPI Inflation | | Explanatory Variables | Dependent Variable: CPI Inflation | | (1) | (2) | (3) | (4) | | Population Growth | 2.01* | | | | | Age Dependency Ratio | | 0.10** | | | | Share of Working Age Population | | | -0.90 | | | Growth in Elderly Population | | | | -3.55* | | CPI Inflation (-1) | 0.25** | 0.26** | 0.38*** | 0.45*** | | Constant | 2.30 | -0.77 | 54.79 | 15.24*** | | Time Trend | | | 0.19 | 0.01 | | Adjusted R-squared | 0.09 | 0.09 | 0.12 | 0.01 | | Sargan-Hansen J-test | (0.72) | (0.68) | (0.74) | (0.21) | Note: 1. ***, ** and * denote significant at 1%, 5% and 10% level, respectively.
2. Figures in the parentheses represent respective p-values. | As per life cycle hypothesis, a higher share of working age population should generate greater revenues for the government through tax collections and thus improve government finances. Aging population, on the other hand will require greater spending on pensions and healthcare thus, worsening government finances. As expected, population growth tends to increase the fiscal deficit (Table 4). The coefficients of other demographic variables, however, turned out to be statistically insignificant. Moreover, growth in the elderly population does not increase fiscal deficit, which is counter-intuitive but could be due to not so developed social security systems in India. | Table 4: Impact of Demographic Changes on General Government Fiscal Deficit | | Explanatory Variables | Dependent Variable: Gross Fiscal Deficit (GFD) as per cent of GDP (GFD-GDP) | | (1) | (2) | (3) | (4) | | Population Growth | 0.65* | | | | | Age Dependency Ratio | | 0.01 | | | | Share of Working Age Population | | | -0.49 | | | Growth in Elderly Population | | | | -1.32 | | GFD-GDP (-1) | 0.76*** | 0.67*** | 0.60*** | 0.56*** | | Constant | 0.48 | 1.90 | 29.83 | 6.26* | | Time Trend | | | 0.12 | 0.05 | | Adjusted R-squared | 0.38 | 0.47 | 0.49 | 0.31 | | Sargan-Hansen J-test | (0.20) | (0.66) | (0.72) | (0.17) | Note: 1. ***, ** and * denote significant at 1%, 5% and 10% level, respectively.
2. Figures in the parentheses represent respective p-values. | Population ageing may influence the external current account balance through the saving-investment channel (Higgins, 1998; Fougère and Mérette, 1999). The results reveal that population growth, age dependency ratio and working age population do not have any significant impact on the current account balance in India. The rise in elderly population, however, tends to reduce the current account deficit in India, may be due to a decline in domestic investment demand exceeding the reduction in domestic savings (Table 5). V. Conclusions An examination of the influence of demographic changes on macroeconomic outcomes in India reveals that population growth and age dependency ratio have inverse relation with the growth in real GDP and per capita income, and positive relation with inflation. Increase in the share of working age population, on the other hand, contributes to higher economic growth. An aging population is deflationary in nature though improves the current account balance. | Table 5: Impact of Demographic Changes on Current Account Deficit | | Explanatory Variables | Dependent Variable: Current Account Deficit (CAD) as per cent of GDP (CAD-GDP) | | (1) | (2) | (3) | (4) | | Population Growth | -0.04 | | | | | Age Dependency Ratio | | -0.004 | | | | Share of Working Age Population | | | 0.14 | | | Growth in Elderly Population | | | | -1.04* | | CAD-GDP (-1) | 0.73*** | 0.70*** | 0.75*** | 0.63*** | | Constant | 0.45 | 0.70 | -7.36 | 3.30* | | Time Trend | | | -0.03 | 0.02* | | Adjusted R-squared | 0.57 | 0.57 | 0.56 | 0.63 | | Sargan-Hansen J-test | (0.75) | (0.34) | (0.39) | (0.32) | Note: 1. ***, ** and * denote significant at 1%, 5% and 10% level, respectively.
2. Figures in the parentheses represent respective p-values. | India is currently on the cusp of a demographic transition. Population trends suggest that the age dependency ratio is expected to decline till 2025 and remain almost stagnant upto 2040. Thus, this is the golden age for India when the demographic dividend could be reaped through higher growth. However, there is a dark side - despite an increase in the share of working age population in total population, the labour force participation rate in India has been declining. The trend is particularly predominant among youth aged 15-29 in the rural areas and among the female population. In order to harvest favourable demographics, it is critical to empower the labour force with skills and gainful employment. India needs to pay special attention to skilling and reskilling its workforce, keeping in view the changing nature of today’s job profile. There are serious gaps between what the skill development institutions currently do and what the industry requires. Improving education and health infrastructure, in terms of both quality and access and timely action in a co-ordinated manner by the Government, private sector and researchers is necessary to harness the window of opportunity provided by a favourable demography. References Aiyar, Shekhar and Mody, Ashoka (2011), ‘The Demographic Dividend: Evidence from the Indian States’, IMF Working Paper No. 11/38. Barro, R. (1991), ‘Economic Growth in a Cross Section of Countries’, The Quarterly Journal of Economics, Vol. 106, No. 2. (May, 1991), pp. 407-443. Blacker, C.P (1947), ‘Stages in Population Growth’, The Eugenics Review, 1947 Oct, 39(3): 88–101. Bloom, D. E., Canning, D., and Malaney, P. N. (1998), ‘Demographic Change and Economic Growth in Asia’, Working Paper no. 15, Center for International Development at Harvard University Bobeica, Elena, Lis, Eliza M., Nickel, Christiane and Sun, Yiqiao (2017), ‘Demographics and Inflation’, ECB Working Paper No. 2006. Brander, J. A., and Dowrick, S. (1994), ‘The role of fertility and population in economic growth’, Journal of Population Economics, February 1994, Volume 7, Issue 1, pp 1–25 Han, Gaofeng (2019), ‘Demographic Changes and Inflation Dynamics’, Hong Kong Institute for Monetary Research Working Paper No.02/2019. Hansen, Alvin H. (1939), ‘Economic Progress and Declining Population Growth’, The American Economic Review, Vol. 29, No. 1 (March 1939), pp. 1-15. Harrod, Roy F. (1939). ‘An Essay in Dynamic Theory’, The Economic Journal, Vol. 49, No. 193 (March 1939), pp. 14-33 Higgins, Matthew (1998), ‘Demography, National Savings, and International Capital Flows’, International Economic Review, 1998, vol. 39, issue 2, 343-69. International Labour Organisation (ILO) (2013), ‘Global Employment Trend Report, 2013’, Available at https://www.ilo.org/wcmsp5/groups/public/---dgreports/---dcomm/---publ/documents/publication/wcms_202326.pdf International Monetary Fund, ‘World Economic Outlook 2004’, Available at https://www.imf.org/external/pubs/ft/weo/2004/02/ Joe, W., Dash, A. K., and Agrawal, P. (2015), ‘Demographic Transition, Savings, and Economic Growth in China and India’, IEG Working Paper No. 351 Juselius, Mikael and Takáts, Előd (2018), ‘The Enduring Link between Demography and Inflation’, BIS Working Paper No. 722. Kim, Jinill (2016). ‘The Effects of Demographic Change on GDP Growth in OECD Economies,’ IFDP Notes, Washington: Board of Governors of the Federal Reserve System, September 28, 2016. Kumar, Utsav (2010), ‘India’s Demographic Transition: Boon or Bane? A State-Level Perspective,’ MPRA Paper 24922, University Library of Munich, Germany. Ladusingh, L., and Narayana, M. R. (2011), ‘Demographic Dividends for India: Evidence and Implications Based on National Transfer Accounts’, ADB Economics Working Paper Series No. 292. LEE Sang-Hyop, KIM Jungsuk & PARK Donghyun (2016), ‘Demographic Change and Fiscal Sustainability in Asia,’ Working Papers DP-2016-11, Economic Research Institute for ASEAN and East Asia (ERIA). Malthus, Thomas Robert (1798), ‘An Essay on The Principle of Population’, Available at http://www.esp.org/books/malthus/population/malthus.pdf Maxime Fougère and Marcel Mérette (1999), ‘Population ageing and economic growth in seven OECD countries’, Economic Modelling, 1999, vol. 16, issue 3, 411-427. Modigliani, Franco (1966), ‘The Life Cycle Hypothesis of Saving, The Demand for Wealth And The Supply Of Capital’, Social Research, Vol. 33, No. 2, pp. 160-217. Mohan, Rakesh (2004), ‘Fiscal Challenges Of Population Ageing: The Asian Experience’, Speech by Rakesh Mohan at the Global Demographic Change Symposium Sponsored by the Federal Reserve Bank of Kansas City, Jackson Hole, Wyoming, August 26-28, 2004. Solow, Robert M. (1956), ‘A Contribution to the Theory of Economic Growth’, The Quarterly Journal of Economics, Vol. 70, No. 1 (February 1956), pp. 65-94. Sundman, Marie-Lor (2011), ‘The effects of the Demographic Transition on Economic Growth: Implications for Japan’, Thesis presented at Jönköping University, Jönköping International Business School. United Nations Department of Economic and Social Affairs (2019), ‘World Population Prospects: The 2019 Revision’, Available at https://www.un.org/development/desa/publications/world-population-prospects-the-2017-revision.html Yoon, Jong-Won and Kim, Jinill and Lee, Jungjin (2014), ‘Impact of Demographic Changes on Inflation and the Macroeconomy’, IMF Working Paper No. 14/210.
| Annex Table 1: Summary of Literature Review | | Author | Time-period | Issues Examined | Results/Conclusions of the study | | Sundman (2011) | 1999-2009 | How demographic transition impacts economic growth | Demographic variables, viz., life expectancy and total dependency ratio have a negative impact on GDP per capita as they contribute to much lower labour force. Demographic transition has hit Japan the hardest. | | Joe, Dash and Agrawal (2015) | 1970-2013 | Impact of changing population age structure on economic growth in China and India | In case of China, in the long run, per capita GDP is influenced by both saving to GDP ratio and dependency ratio. However, in case of India, only the dependency ratio shows a significantly negative long run association with per capita GDP. | | Bloom, Canning and Malaney (1998) | 1965-1990 | The relationship between demographic change and economic growth in Asia during 1965-90 | East Asia benefited from a “virtuous spiral” of income growth and fertility decline, while South Asia remained caught in a low- level population-income trap. | | Brander and Dowrick (1994) | 1960 -1985 | Effects of population growth and fertility on economic growth | High birth rate has a negative impact on economic growth through investment effects in terms of “capital dilution”. Birth rate declines have strong medium-term positive impact on per capita income through labour supply or “dependency “ effects. | | Barro (1991) | 1960-1985 | Relationship between human capital and per capita GDP | The growth rate of real per capita GDP is positively related to initial human capital and negatively related to the initial level of real per capita GDP. | | Jong-Won Yoon, Jinill Kim, and Jungjin Lee (2014) | 1960–2013 | Impact of demographic changes on growth of real GDP per capita; current account balance; savings; investment; Government budget balance; and inflation rate using a panel dataset covering 30 OECD economies | Size of population and ageing, as captured by the share of 65 and above, influence real GDP growth in the negative way. Population growth influences current account, savings, and investment negatively, though insignificantly while its impact on budget balance is positive and significant. The negative impact of the elderly share is significant for savings, investment, inflation and budget balance. | | Han (2019) | 1991-2016 | Impact of demographic changes on inflation in Hong Kong, Singapore and Mainland China | An increase in the youth population is inflationary, while an increase in the aging population is disinflationary. By affecting inflation expectations, demography directly impacts inflation, or indirectly through the interest rate channel. Its impact through the output gap or the wage channel is ignorable. | | Juselius and Takats (2018) | 1870-2016 | Impact of age structure on inflation | Age structure plays a significant role in explaining inflation taking into account different policy regimes during the period. | | Bobeica, Lis, Nickel and Sun (2017) | 1975-2016 | Relationship between demographic change and Inflation | There is a positive long-run relationship between inflation and the increase in working-age population as a share in total population in euro area as well as US and Germany. | | Lee, Kim and Park (2016) | 1995-2050 | Impact of demographic shifts on the fiscal health of the Government | Population age structure can have significant effect on fiscal sustainability since they can affect both Government revenues and expenditures. Asia’s population aging (Japan, China, and Republic of Korea) will adversely affect its fiscal sustainability. | | Rakesh Mohan (2004) | 1950-2050 | Potential fiscal challenges of population ageing in Asia | Asian countries have the advantage of seeing what is happening in the West and can avoid the follies of excessive social welfare states. These countries need to develop funded health and pension schemes while consciously delaying the shift from private welfare provision to public welfare provision. | | Matthew Higgins (1998) | 1950 - 1989 | Relationship between age distribution, national savings and the current account balance | Increase in both the youth and old-age dependency ratio is associated with lower saving rates. The estimated demographic effect on the current account balance exceeds six per cent of GDP over the last three decades for several countries. | | Maxime Fougère and Marcel Mérette (1999) | 1954-2082 | Possible effects of population ageing on the current account of six OECD countries by extending the Hviding and Mérette (1998) computable overlapping-generation (OLG) models to a small economy framework | Population ageing may have an important impact on current account balances, depending on the extent and the evolution of ageing in one country relative to another. A relatively faster ageing country will experience an improvement in its current account balance due to a decline in domestic investment demand that is greater than the reduction in national savings. Population ageing may lead to international capital flows from countries with an ageing population to countries with a relatively younger population, such as newly industrialised and developing countries. | | Shekhar Aiyar and Ashoka Mody (2011) | 1961-2001 | Size and circumstances of the potential gains from demographic dividend in India using variation in the age structure of the population across Indian states | The level and the growth rate of the working age ratio have both exercised a large impact on India’s economic growth. This result is robust after accounting for inter-state migration, endogeneity concerns, and the introduction of a range of control variables. | | Utsav Kumar (2010) | 1971-2001 | Role of changing age structure of population in economic growth, while controlling for state-specific variables like overall physical and social infrastructure level | Using state-level data from India, the paper shows that the pace of demographic transition varies across states, and that these differences are likely to be exacerbated over the period 2011-2026. The BIMARU states are likely to see a continuing increase in the share of the working-age population in total population. Whether India’s demographic dividend will be a boon or bane critically depends on the ability of the BIMARU states to exploit the bulge in the working-age population. | | Ladusingh and Narayana (2011) | 2005-2070 | Quantification of demographic dividends for India using the National Transfer Accounts Framework | The paper quantifies the positive macro-economic implication of the age structure transition in India-under both first and second demographic dividends. The first demographic dividend (due to higher working age population) predominates from 1980-2035 while the second demographic dividend (due to higher saving to support longer retirement) gains prominence from 2035. The total dividend for India could remain stable until 2070. |
| Annex Table 2: Correlation Matrix of the Demographic Variables | | | Population Growth | Age Dependency Ratio | Share of Working Age Population | Growth in Elderly Population | | Population Growth | 1
----- | | | | | | | | | | | Age Dependency Ratio | 0.995823***
(0.00) | 1
----- | | | | | | | | | | Share of Working Age Population | -0.995328***
(0.00) | -0.999206***
(0.00) | 1
----- | | | | | | | | | Growth in Elderly Population | -0.376661**
(0.01) | -0.364754**
(0.01) | 0.369557**
(0.01) | 1
----- | | Note: Figures in the parentheses represent respective p-values. |
| Annex Table 3: Unit Root Test Results | | Items | Variable | ADF | Order of Integration | | Without Trend | With Trend | | Demographic/Explanatory Variables | Population Growth | -2.43** | -3.27* | I (0) | | Age Dependency Ratio | -1.93** | -3.58** | I (0) | | Share of Working Age Population | -1.86 | -3.34* | I (0) | | Growth in Elderly Population | 1.04 | -4.11*** | I (0) | | | | Macroeconomic/Dependent Variables | Growth in Real GDP | -6.30*** | -7.81*** | I (0) | | Growth in Per Capita Income | -5.52*** | -7.85*** | I (0) | | CPI Inflation Rate | -4.67*** | -4.59*** | I (0) | | General Government Fiscal Deficit to GDP Ratio | -3.18** | -2.93 | I (0) | | Current Account Deficit to GDP Ratio | -1.65* | -2.47 | I (0) | | Note: ***, ** and * denote significant at 1%, 5% and 10% level, respectively. |
|