The slowdown in bank deposit growth in the recent period alongside a revival of credit demand raised concerns about a structural liquidity gap in the system, possibly amplified by substitution effects of small savings and mutual funds on bank deposits in the aftermath of demonetisation. Against this backdrop, this article examines cyclical swings and secular changes affecting bank deposits. Empirical results reveal that income and financial inclusion are long-term structural drivers while the interest rate and Sensex returns impact deposit growth in the short-run. Introduction In the recent period, there has been an animated debate around the slowdown in the growth of deposits in the banking system1. The issue has attracted attention in the context of revival of credit demand that has taken hold since November 2017 when bank credit growth rose to 9.3 per cent from an all-time low of 4.4 per cent in February, 2017, after a 75-month prolonged deceleration. The widening wedge between credit and deposit growth is triggering concerns about a structural liquidity gap in the system, which can throw sand in the wheels of the financial intermediation process through which deposits are converted into productive investments by way of lending, thereby greasing the wheels of the economy. The recent narrative has focused on the shortage of loanable funds and the upside it has imparted to the cost of funds at a time when domestic economic activity appears to be losing momentum, as reflected in incoming data on high frequency indicators of demand and output. Outstanding deposits of scheduled commercial banks (SCBs) at ₹1,25,726 billion as on March 31, 2019 accounted for 128.7 per cent of outstanding bank credit (lower than 132.5 per cent a year ago), reflecting the tightening of financial conditions on account of low deposit growth. To provide some perspective to the recent concerns, bank deposits remain the preferred financial asset of households which are the main sources of suppliers of funds to the economy, despite the emergence of alternative financial savings options with relatively high net returns (including tax incentives). Assured returns, liquidity and safety are factors that impinge upon households’ choice of financial instruments. At the same time, sustained efforts by the Reserve Bank of India (RBI) and Government towards financial inclusion have expanded the supply of deposits by bringing hitherto unbanked households into the formal financial system. Accordingly, this article explores the questions: are there substitution effects vis-à-vis small savings and mutual funds playing out or is there a secular process of disintermediation underway that could profoundly alter the contours of India’s bank-dominated financial system and the process of financial intermediation as we have known it so far. The question assumes importance in the context of potential shifts in banking habits of people and balance sheet adjustments by banks in the aftermath of demonetisation. The article argues that disentangling cyclical swings and structural or behavioural changes in households/banks is important as it could have significant policy implications. The rest of the article is organised into three sections. Section II, which immediately follows, presents stylised facts on deposit mobilisation by bank groups and types of accounts and maturity, and behavioural aspects of other financial assets in financial savings of households with a view to separate out transitory influences from underlying long-term determinants of deposit behaviour. Section III sets out the methodology used, the period of study and a description of the empirical results. Section IV concludes the article with some policy perspectives. II. Some Stylised Facts In the literature wherein bank deposits are typically considered as a function of the deposit interest rate and income, although other factors are also being considered more recently. Generally, a positive relationship between the bank branches and bank deposits has been confirmed, making the case for bank branch expansion in unbanked areas to increase deposit mobilisation (Mashamba et al., 2014). Returns on the Sensex, inflation and the interest rate on public provident funds (PPF) have been found to negatively impact the growth of time deposits (Das et al., 2015; Behera and Yadav, 2019). Recent work has also focused on changes in deposit behaviour due to demonetisation’s channelisation of financial savings to capital markets (Singh, et al., 2017), and the shifts it induced in households’ preferences from term deposits to savings deposits (Saxena and Sreejith, 2018). Contrary to the widely held perception of slowing deposit growth, there has been an acceleration building up from the beginning of 2018, after a 53-year low of 3 per cent in November 2017. At end-March 2019, deposit growth at 10 per cent was, in fact, marginally higher than its 15-year trend (Chart 1). Moreover, the decomposition of year-on-year deposit growth shows that the recent acceleration is driven by momentum, despite unfavourable base effects (red bars). Notwithstanding this improvement, it is noteworthy that the recent pick-up is occurring against the backdrop of a secular deceleration that has set in since August 2009, barring the demonetisation-driven spike during November-December 2016. 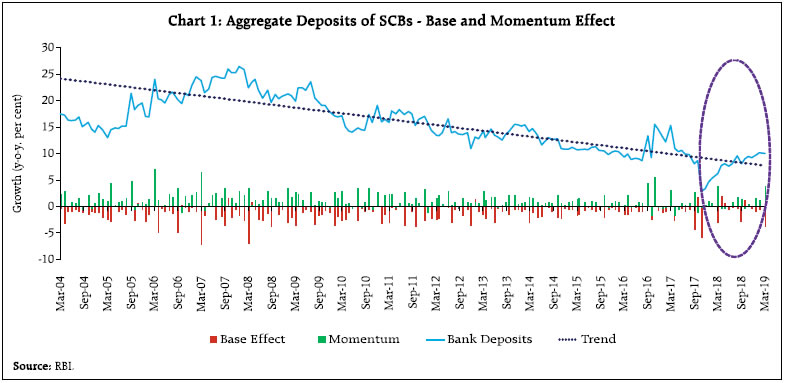 Typically the deposits collected by banks are classified into current, savings and fixed deposits2. A savings deposit is a hybrid product which combines the features of both a current account and a term deposit account. All deposit liabilities payable on demand such as current account deposits and the demand component of saving bank deposits are covered under demand deposits. Time deposits of banks include fixed deposits and the time component of saving bank deposits. Over the years, the share of demand deposits in aggregate deposits has declined while that of time deposits has increased. Time deposits account for around 88 per cent of aggregate deposits, and it is observed that the pattern of aggregate deposit growth is predominantly determined by the behaviour of time deposits (Chart 2). On the other hand, demand deposit growth is volatile, presently in consonance with variation in currency with the public with which substitution effects are at work. 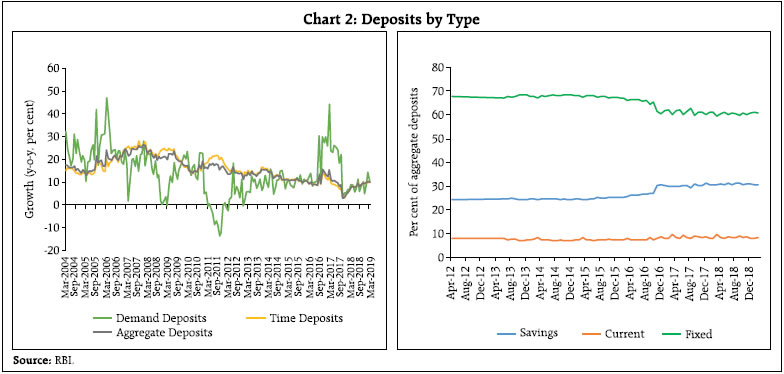 In terms of bank groups, deposits mobilised by public sector banks appear to be the prime mover of aggregate deposits. Both private and foreign banks are sharing the recent pick up in deposit growth, with foreign banks posting a smart upturn from a contraction in October 2011 and private banks appearing more resilient, with the pick-up in their deposit growth having commenced from September 2013 (Chart 3). All categories of banks also display a similar secular slowdown in deposit growth; although for private banks, the deceleration in trend is flatter. Thus, it suggests that aggregate deposits are predominantly mirroring the behaviour that of time deposits of public sector banks. Close co-movement is visible between variations in deposit growth and in the interest rate3 – a downward slide till November 2017 and an upward movement thereafter (Chart 4). The closest co-movement is observed between deposit growth and nominal GDP growth as evident from increasing trend during 2003-08 and slowing down since then. The co-movement of deposit growth with the growth of nominal GDP is stronger than with the deposit interest rate, suggesting that income effects are more powerful than price effects in driving deposit growth. 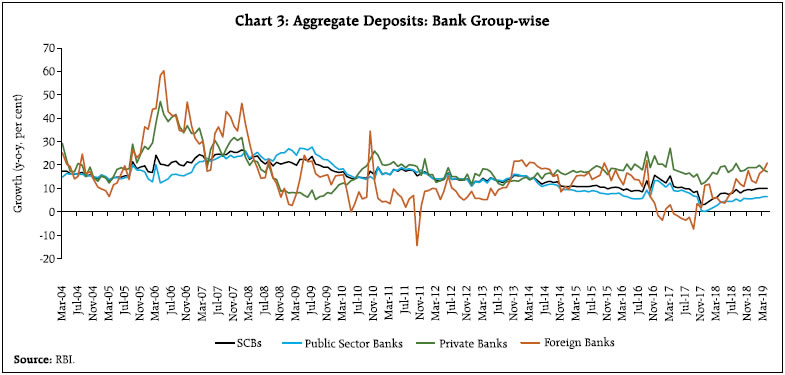 Besides income and the interest rate, mobilisation of deposits seems to be affected by substitution effects emanating from small savings, although there appears to be positive co-movement in the more recent period, suggesting reduction of interest rate differentials. In the long-term, both deposit growth and small saving share common downward trend. Incentives in the form of income tax treatment available for small saving schemes drives competition between bank deposits and small savings (Annex I). In the long run, this competition fades away in view of limits of tax concession for small savings, particularly on PPF, which are revised from time to time generally in sync with investment limits under Section 80C of the Income Tax Act. As mentioned earlier, innovations in financial saving instruments available to investors providing both safety and returns appears to have resulted in diversification of financial assets. Consequently, there has been growing popularity of mutual funds and other stock market instruments and a waning of the traditional preference for physical assets such as real estate and gold. Consequently, opposing movements between Sensex returns and deposit growth are indicative of substitution effects. III. Data, Period of Study, Methodology and Results Data on bank deposits are available at monthly frequency from 1951, but the broad consumer price index for industrial workers (CPI-IW) is available from January 1960. Therefore, a series on real deposits can be calculated from the later date by deflating nominal aggregate deposits by the CPI-IW. However, limitations in data availability on other variables such as small savings and bank branches, restricts the period of study to quarterly data from June 2006 to September 2018. Structural breaks in the pattern of y-o-y growth of aggregate deposits have been identified by using the Bai-Perron test4 (Bai and Perron, 1998). In terms of growth rates, deposit behaviour underwent a major structural break in October 2009 (Chart 5). The break in 2009 may be indicative of deceleration in trend GDP growth. In November 2016, demonetisation produced a transient spike in deposit growth but there was no statistically significant structural break. Further, this spike in deposit growth was of lower amplitude than the surge related to bank nationalisation in July 1969. 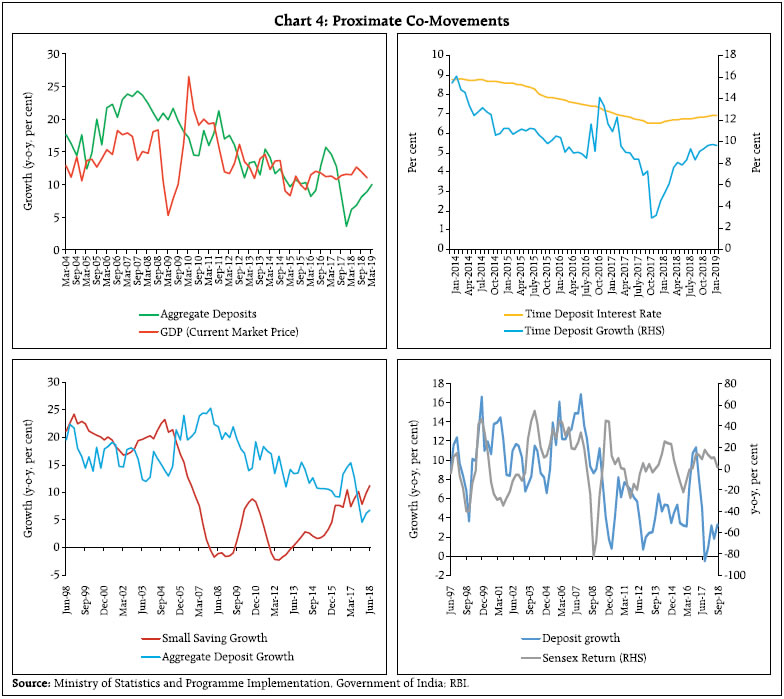 In order to differentiate between secular and short-run reversible forces underlying the slowing down of deposit growth, seasonally adjusted aggregate deposits in levels are decomposed into trend and cyclical components (Chart 6). Turning point analysis (based on Harding and Pagan, 2002) reveals the duration of the cycles to be around 37 months on average, with no notable turning points except demonetisation in November 2016, presumably reflecting the underlying business/economic cycles. Accordingly, deeper analysis of deposit behaviour and its association with underlying macroeconomic and financial variables is warranted. 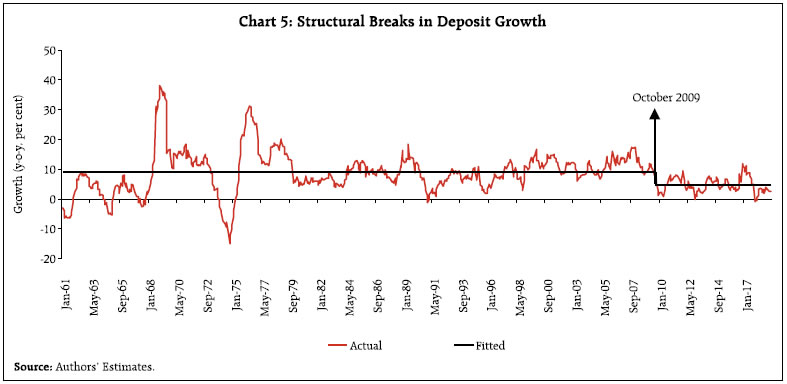 In the next step, the existence of a long-run co-integrating relationship between seasonally adjusted (sa) deposits and proximate determinants such as GDP (sa), the weighted average time deposit interest rate, small savings (sa), and returns on alternative financial instruments such as mutual funds proxied by the Sensex, and financial inclusion represented by the number of bank branches (sa) is explored. The structural break in October 2009 and the demonetisation shock are captured by dummy variables. In view of the time series properties of the data revealing a combination of stationary and non-stationary variables among those chosen for analysis, the autoregressive distributed lag (ARDL) model (Pesaran and Shin, 1998) has been applied to obtain long-run and short-run coefficients of the proximate determinants of bank deposits (Annex II). 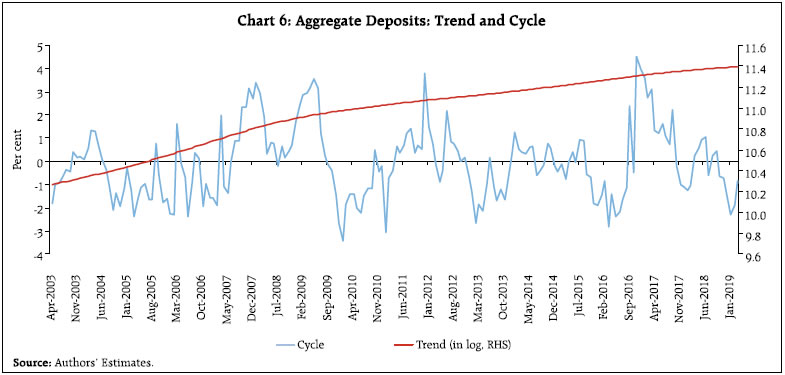 The ARDL model uses the lag length criteria prescribed by the adjusted R-squared approach. Bounds test results that confirms the existence of a long-run relationship between the variables referred to earlier. While the long-run cointegration seeks to explain the secular behaviour of deposits, cyclical movements can be studied via the error correction model (ECM). All the explanatory variables except Sensex returns are found to be statistically significant in the long-run. Real GDP is found to be positively associated with deposits and turn out to be the most powerful determinant. This importance of GDP is on expected lines, given the high savings propensity of the Indian economy. Small savings collections emerge as the next most important determinant, suggesting that in the long-run, income drives both deposits and small savings, and the limit on tax incentives for small savings enables households to undertake both out of their income. Bank branches defined as quarter-on-quarter variations in the number of commercial bank branches are the third most significant driver of deposit behaviour, indicating that positive effects of financial inclusion accrue over a period of time. The weighted average domestic term deposit rate is found to be positively associated with deposit mobilisation, indicative of some interest rate sensitivity even though its impact is marginal. The returns on Sensex, the variable controlling for investor preference for other financial instruments such as mutual funds, is found to have the expected negative sign but the coefficient is not statistically significant. The dummy variable taken to control for structural break in October 2009 is statistically significant. The error correction term in the short-run equation is found to be statistically significant and has the expected negative sign. The size of error correction suggests that the adjustments to a shock and return to the long-run equilibrium is complete within two quarters. The income elasticity of deposit growth is 0.85, turning out to be the most relevant determinant in the short-run as well. On the other hand, small savings collections drag down deposit growth with substitution effects. Among other determinants, the coefficient on bank branch has a positive sign but of a much lesser magnitude than its long-term coefficient, reflecting the impact of financial inclusion on deposit mobilisation as being a longer-term phenomenon. The coefficient of Sensex returns, which is insignificant in the long-term, is significant in the short-run pointing to diversion of financial savings from deposits to stock market assets in the more recent period. The dummy used for demonetisation is found to be positive and statistically significant, reflecting the surge in deposits post withdrawal of Specified Bank Notes (SBNs) in November 2016. To understand the contribution of various factors to deposit growth at each point of time, a vector autoregression (VAR) model is estimated using y-o-y growth of variables used earlier in ARDL model. The historical decomposition of shocks to deposit growth from VAR computed using generalised weights provides the evidence that deposit growth is mainly driven by income and deposit interest rates in recent years (particularly since 2013). Substitution effects of small savings is found frequently while that of Sensex returns is observed occasionally (Chart 7). IV. Conclusion Bank deposits remain an important part of the financial savings of households and key to the financing of bank lending. Deposit growth is picking up in recent months in a cyclical upturn since December 2018, which is overwhelming a trend slowdown that has been underway since October 2009. The latter warrants policy consideration since deposit mobilisation is fundamental to India’s bank-based system of financial intermediation. Empirical evidence puts forward several interesting facts about the behaviour of bank deposits. First, it underscores the income as its most important determinant, both in the short-and in the long-run. Second, interest rate matters for deposit mobilisation but only at the margin. Third, financial inclusion has a boosting effect on deposit mobilisation over the long-run suggesting expansion of bank branches in unbanked areas. Fourth, substitution effects associated with Sensex returns for deposit growth are limited to the short-run, warranting a careful appraisal of regulatory reforms and tax arbitrage, even as efforts need to be intensified to make both more market determined. Finally, similar to Sensex return, small savings substitute bank deposits in the short-run but supplement deposits in the long-run, reflecting that limits on income tax exemption eventually evens out substitution effects and allow income to be the key determinant of both in the long-run. In the final analysis, therefore, accelerating the rate of growth of the economy and disposable incomes holds the key to higher deposit mobilisation by the banking system. References Bai, Jushan and Pierre Perron (1998). “Estimating and Testing Linear Models with Multiple Structural Changes,” Econometrica, 66, 47–78. Behera H.K. and Yadav I.S. (2019: “Explaining India’s Current Account Deficit: A Time Series Perspective”, Journal of Asian Business and Economic Studies, https://doi.org/10.1108/JABES-11-2018-0089. Das R., Bhoi B. B., Kumar P. and Banerjee K. (2015): “Inter-sectoral Linkages in the Indian Economy”. Reserve Bank of India Working Paper, 03/2015. Harding, D., and Pagan, A. (2002). Dissecting the Cycle: A Methodological Investigation. Journal of Monetary Economics, 49(2), 365-381. doi:https://doi.org/10.1016/S0304-3932(01)00108-8 Mashamba T., Magweva R., and Gumbo L. C. (2014), “Analysing the Relationship between Banks’ Deposit Interest Rate and Deposit Mobilisation: Empirical evidence from Zimbabwean Commercial Banks (1980-2006)” IOSR Journal of Business and Management, 16 (1):64-75. Pesaran, M. H., & Shin, Y. (1998). An Autoregressive Distributed-Lag Modelling Approach to Cointegration Analysis. Econometric Society Monographs, 31, 371-413. Saxena T. K. and Sreejith T. B. (2018), “Post-Demonetisation Patterns of Deposits with Scheduled Commercial Banks: 2016-17 and 2017-18”. Reserve Bank of India Bulletin, December 2018. Singh B., Behera H., Raut D. and Roy I. (2017): “Impact of Demonetisation on the Financial Sector”. Reserve Bank of India Bulletin, November 2017.
| Annex I: Tax Treatment on Saving Instruments | | Saving Scheme | Principal | Interest Income | Capital Gain | | Bank Deposits | | | | | 1. Saving Deposit | X | Up to Rs. 10000 | NA | | 2. Fixed Deposit | √
(≥ 5 year maturity) | X
No TDS upto Rs.40000 | NA | | Postal Savings | | | | | 1. Saving Deposit | X | Up to Rs. 10000 | NA | | 2. Term Deposit | √
(≥ 5 year maturity) | X | | | PPF | √ | √ | | | NSC | √ | √ | | | KVP | X | X | | | Sukanya | √ | √ | | | NPS | √ | √ | Taxable to the extent of 40% | | Mutual Fund | | | | | Long Term | | | | | Equity/Hybrid (>1 year) | √
(ELSS with lock in 3 years) | | √
(10% tax after ₹1 Lakh) | | Debt (> 3 years) | X | | X
(LTCG 20% ) | | Short Term | | | | | Equity/Hybrid (<1 year) | X | | X
(STCG 15%) | | Debt (<3 years) including MMMF | X | | X | √ : Tax Exemption/Incentive X: No Tax Exemption/Incentive NA: Not Applicable
ELSS: Equity Linked Saving Schemes LTCG: Long-term Capital Gain Tax STCG: Short-term Capital Gain Tax
Sukanya: Sukanya Samriddhi Account |
Annex II: Empirical Results ARDL Model ARDL regression, as proposed by Pesaran and Shin (1998), is estimated using data from Q2:2006 to Q3:2018. Where deposit is the natural logarithm of seasonally adjusted real aggregate deposits and ψ is the error correction term. xt is the vector of explanatory variables viz., GDP, deposit rate, Sensex returns, small savings collections and bank branches. All the variables are in real terms. | ARDL Model Estimation Results | | Variables | (Period: Q2:2006 to Q3:2018) | | Co-efficient | t-statistics | | Long- Run | | | | Error Correction Term | -0.709 | -8.48*** | | Constant | -4.976 | -2.80*** | | GDP | 0.958 | 10.99*** | | Dep_rate | 0.005 | 1.98* | | DSensex | -0.0002 | -1.38 | | Small_savings | 0.452 | 3.65*** | | Dbranch | 0.066 | 3.31*** | | D2009Q4 | 0.076 | 3.45*** | | Short -Run | | | | D(AD) | -0.363 | -3.25*** | | D(GDP) | 0.847 | 5.01*** | | D(GDP(-1)) | -0.536 | -3.08*** | | D(DSensex) | -0.0003 | -4.22*** | | D(small_savings) | 0.225 | 1.74* | | D(small_savings(-1)) | 0.052 | 0.36 | | D(small_savings(-2)) | -0.588 | -4.06*** | | D(Dbranch) | 0.001 | 2.33** | | Demon | 0.045 | 5.68*** | | Adj R2 | 0.78 | | | D-W Statistics | 2.47 | | | LM(8)- P-value | 0.14 | | | ARCH(8)- P-value | 0.88 | | AD : Natural logarithm of seasonally adjusted aggregate deposits
GDP : Natural logarithm of seasonally adjusted real GDP
Dep_rate : Weighted average term deposit rates
DSensex : Quarterly difference between Sensex (in natural logarithms) at time ‘t’ and time ‘t-1’.
Small_savings : Natural logarithm of seasonally adjusted real small saving collections
Dbranch : Quarterly growth in bank branches.
D2009Q4 : Dummy for structural break in October 2009
Demon : Dummy for demonetisation
Note: ***, **, * indicates level of statistical significance at 1 per cent, 5 per cent and 10 per cent, respectively.
Source: Authors estimates/calculations. |
| Bounds Test Results | | F-Bounds Test | | Null Hypothesis: No levels relationship | | Test Statistic | Value | Signif. | I(0) | I(1) | | F-statistic | 8.88 | 10% | 1.99 | 2.94 | | k | 6 | 5% | 2.27 | 3.28 | | | | 2.50% | 2.55 | 3.61 | | | | 1% | 2.88 | 3.99 | Structural Break Test Result Dependent Variable: Deposit Growth
Sample (adjusted): 1961M01 2019M03
Included observations: 699 after adjustments
Break type: Bai-Perron tests of L+1 vs. L sequentially determined breaks
Breaks: 2009M09
Selection: Trimming 0.15, , Sig. level 0.05 | Variable | Coefficient | Std. Error | t-Statistic | Prob. | | | 1961M01 - 2009M09 -- 585 Observations | | | | C | 8.96 | 0.75 | 12.00 | 0.00 | | | 2009M10 - 2019M03 -- 114 Observations | | | | C | 4.60 | 0.52 | 8.86 | 0.00 |
|