Drawing on the fourth round of the survey of authorised dealers on India’s inward remittances in 2016-171, this article finds that business tie-ups with various exchange houses have facilitated cheaper transmission of remittances from the Gulf Cooperation Council countries relative to those from other countries. Kerala, Maharashtra and Karnataka are the major recipient States. Money transfer operators maintain an edge over banks in terms of cost for cash-based low value transactions. Introduction Remittances play a crucial role in the life and ethos of a wide swathe of developing economies, with significant welfare implications. In 2017, low and middle income economies received US$466 billion as remittances (World Bank, 2018). For several low income countries, these flows constitute more than half of GDP. Remittances are a more stable source of external financing than cyclical private debt and equity flows and unlike the latter, involve no obligation to repay or service - contractual or otherwise. This feature of these flows assumes importance from an external sustainalibity perspective. Remittances depend upon a host of factors, including macroeconomic conditions in source economies, the stock of migrants, the fiscal policy stance in the host countries, oil price dynamics and the domestic policy regime for work related migration (RBI, 2015-16). Increasingly, it is observed that the cost of remitting funds is becoming a key element influencing the size of remittances (Cecchetti and Schoenholtz, 2018). As formal channels are costly due to regulatory requirements, remitters might be preferring less costly informal channels, though they are less secure and prone to misuse for illegal purposes (Kosse and Vermeulen, 2014). The G20 has prioritised the issue of cost of remittances in its agenda and is encouraging appropriate policies at the country level. For India, the flow of inward remittances has been pivotal in financing the trade deficit (43 per cent in 2017-18). India continues to be the top recipient country with US$69 billion of remittances in 2017 sent by a large pool of skilled, semi-skilled and unskilled Indian migrants across the globe.2 The cost of sending remittances to India, therefore, assumes critical relevance, especially from the point of view of the potential use of informal/illegal channels. Since 2006, the Reserve Bank of India (RBI) has been conducting surveys of authorised dealers (ADs) which act as intermediaries for remittances received by residents. This survey, the fourth in its series3, expands its ambit to canvas information on costs of sending remittances for the first time, as well as their country-wise/state-wise distribution. This article is motivated by these new dimensions of information gleaned from the survey to seek a deeper understanding of inward remittances in terms of source, destination, size, modes of transfer and cost of remittances. The rest of the article is divided into five Sections (including the introductory section). In Section 2, the scope and methodology used in the survey are briefly discussed. Section 3 presents the survey results in terms of the characteristics identified earlier in the article’s mission. Section 4 discusses issues surrounding the cost of remittances. Section 5 sets out concluding observations that are intended to inform policy choices. 2. Scope and Method of the Survey Globally, the remittance market is serviced by commercial banks, money transfer operators (MTOs), foreign exchange houses and post offices as well as a wide variety of commercial entities acting as agents and sub-agents (Box I). Banks play a prominent role in intermediating remittances flowing into India. In this round of the survey, out of a universe of 80 ADs that report foreign exchange transactions to the RBI, responses were received from 42 ADs which accounted for 98.3 per cent of total remittances reported in 2016-17. A separate questionnaire was circulated among three major MTOs that have large remittance operations in India.4 3. Survey Results Remittance business is found to be quite diverse across banks. Business models of intermediaries vary, depending on the source country, the prevalent mode of transfer and the size of remittances. 3.1 Country-wise Remittances 82 per cent of the total remittances received by India originated from seven countries, viz., the United Arab Emirates (UAE), the United States (US), Saudi Arabia, Qatar, Kuwait, the United Kingdom (UK) and Oman (Chart 1). With over 90 per cent of overseas Indians working in the Gulf region and South East Asia (ILO, 2018) – mostly semi-skilled and unskilled workers – the Gulf Cooperation Council (GCC) countries accounted for more than 50 per cent of total remittances received in 2016-17, notwithstanding a sharp decline in oil prices and fiscal tightening in these countries. The Indian diaspora in the US, characterised by high skills and high earnings, is the second largest contributor. Box I: Microstructure of Remittance Channels Remittances transactions typically involve a sender, a recipient, intermediaries in both countries and the payment interface used by them. In practice, remittances flow through both formal and informal channels. A specific channel may be formal in one country but informal in another due to differential regulatory treatment (Figure 1). |
3.2 State-wise Remittances The survey reveals that 58.7 per cent of total remittances was received by four states namely Kerala, Maharashtra, Karnataka and Tamil Nadu. The flows of remittances broadly mirror the State-wise composition of the stock of overseas migrants. The Southern States dominated with a combined share of 46 per cent in total remittances. These results are largely corroborated by surveys independently conducted by multilateral agencies (viz., ILO, 2018), which have also highlighted a shift in cross-border migration flow from prosperous States such as Kerala and Karnataka to States like Uttar Pradesh and Bihar largely comprising of low or semiskilled contractual workers with low level of income. These two States accounted for 4.4 per cent of total remittances in 2016-17 (Table 1). 3.3 Mode, Size and Purpose of Remittances AD banks operate through different schemes of payment transfers, ranging from traditional modes like cheques and drafts to more advanced, easier and faster transmission channels like online direct transfers (i.e., wire transfers), the Society for Worldwide Inter-bank Financial Telecommunication (SWIFT) transfers and Rupee Drawing Arrangements (RDAs). The survey results show that the RDA is the most preferred mode accounting for 75.2 per cent of remittances, particularly from the GCC countries. RDA enables tie-ups between AD-I banks and non-resident exchange houses for opening and maintaining their vostro accounts. Banks disburse remittances to the final recipient immediately after the cheque/draft is deposited in the rupee/foreign currency vostro account of the non-resident exchange houses. A maximum of 20 such tie-ups are allowed per bank.5 The cost of transaction through this channel is less than other channels. The second most popular channel is the SWIFT, followed by direct transfers and cheques and drafts (Chart 2). A size-wise analysis shows that 70.3 per cent of all reported transactions were of more than or equal to US$500 and only 2.7 per cent were of less than or equal to US$200 category (Chart 3). | Table 1: State-wise Share in Inward Remittances | | Per cent | | State | Share in Total Remittances | | Kerala | 19.0 | | Maharashtra | 16.7 | | Karnataka | 15.0 | | Tamil Nadu | 8.0 | | Delhi | 5.9 | | Andhra Pradesh | 4.0 | | Uttar Pradesh | 3.1 | | West Bengal | 2.7 | | Gujarat | 2.1 | | Punjab | 1.7 | | Bihar | 1.3 | | Rajasthan | 1.2 | | Goa | 0.8 | | Haryana | 0.8 | | Madhya Pradesh | 0.4 | | Orissa | 0.4 | | Jharkhand | 0.3 | | Uttarakhand | 0.2 | | Puducherry | 0.2 | | Chandigarh | 0.2 | | Jammu and Kashmir | 0.2 | | Assam | 0.1 | | Himachal Pradesh | 0.1 | | Chhattisgarh | 0.1 | | Others | 15.5 | | Total | 100.0 | Note: “Others” also includes those remittances for which banks could not identify the specific destination and, therefore, covered such transactions under “Others”. |
Based on responses gathered from banks, it is estimated that more than half of remittances received by Indian residents were used for family maintenance (i.e., consumption), followed by deposits in banks (20 per cent) and investments in land property and shares (8.3 per cent) (Chart 4). 4. Cost of Remittances Cross-border remittance transactions entail cost incurred by both sender and receiver and are sensitive to these costs (Gibson, et al., 2006). The World Bank and G20, in particular, have increasingly focused on reducing them. Although a large chunk of global remittances is delivered through inter-connected banks and money transfer operators (MTOs), this network is shrinking in various jurisdictions due to anti-money laundering/combating the financing of terrorism (AML/CFT) regulations. In fact, multinational banks, viz., Barclays, Wells Fargo and Bank of America have curtailed their remittance business and have also closed down accounts held by MTOs. Globally, banks are not the preferred choice for retail customers to remit funds due to steep fixed costs and compliance needs (Chandramouli, 2012). Globally, the average cost of sending US$200 was 7.1 percent in the first quarter of 2018, more than twice the Sustainable Development Goal (SDG) target of 3 per cent to be achieved by 2030 (World Bank, 2018). The cost of sending remittances is influenced by several factors – destination; transfer method; payments infrastructure; size of remittance; extent of market competition; and the prevailing regulations in both source and destination countries. Furthermore, the cost of remittance is found to vary across corridors, depending on exchange rate margins, fixed fees charged by service providers, originating mode (online or branch), instrument mode and revenue sharing arrangements between intermediaries involved (e.g., correspondent bank and beneficiary bank). 4.1 Remittance Cost for Senders Generally, the direct cost of remittances is borne by the sender. it is paid to the overseas agents – either banks or exchange houses. The survey results suggest that around three-fourth of total remittances to India are routed through private sector banks (Chart 5). Furthermore, a large chunk is channeled by using RDA, particularly by private and foreign banks (Chart 6). RDA – the most prominant mode – is less costly in the case of foreign and private sector banks than with public sector banks (Table 2). The survey results also suggest that the cost of sending remittances to India also varies by the source country and the mode of transfer. In the case of GCC countries, banks mostly operate with the exchange houses by way of RDA/Vostro transactions, with cost ranging between 2 to 4 per cent, which is lower than in non-GCC countries (Table 3).
| Table 2: Cost of Sending US$200 and US$500 to India6 | | Per cent | | | US$200 | US$500 | | Bank Type/Mode | Public Sector Banks | Private Sector Banks | Foreign Banks | Public Sector Banks | Private Sector Banks | Foreign Banks | | Direct Transfer to Bank Account/Electronic Wire | 0-6.7 | 0-4.0 | 0-2.1 | 0-5.5 | 0-1.7 | 0-3.1 | | SWIFT | 0-21.3 | 0-22.7 | 0-12.7 | 0-8.6 | 0-9.2 | 0-7.7 | | RDA/Vostro Account | 0-13.5 | 0-11.8 | 0-8.5 | 0-5.5 | 0-4.8 | 0-14.1 | Another inference that can be drawn from the survey is that public sector banks generally operate with a relatively static cost structure across countries, reducing cost effectiveness relative to foreign and private sector banks. The cost pattern of private sector banks, on the other hand, varies across countries and modes of transfers. Foreign banks operate with the least cost structure, but have a limited role in remitting money to India. Apart from the fixed cost of taxes, foreign currency conversion charges and commission structures of these banks drive cost differentials among banks. Despite the technological advances in recent years, the overall cost of sending remittances has been found to remain stubbornly high (Mela et al., 2017; Cecchetti and Schoenholtz 2018; World Bank, 2018). For India, the simple average cost of remittances across different corridors continues to be higher than the targeted level of 5 per cent (World Bank). On weighted average basis, however, the average cost of sending remittances to India, appears to be comparable with the target set by the G20. | Table 3: Maximum Cost Borne by Sender: Region wise | | | US$200 | US$500 | | Instrument | Gulf Countries | Non-Gulf Countries | Gulf Countries | Non-Gulf Countries | | RDA/Vostro Account | 4.4 | 13.5 | 1.9 | 5.5 | | Note: Based on information available from top 10 recipient banks. | 4.2 Estimating the Cost of Remittances Remittances Price Worldwide (RPW) under the aegis of the World Bank monitors the cost of sending remittances across 365 “country corridors”.7 RPW uses the benchmark size of US$200 (or equivalent) for providing data on the cost of sending remittances for major corridors.8 • The average cost of sending US$200 to India declined from 9.1 per cent in 2013 to 5.6 per cent in Q1 of 2018 (from 4.9 per cent to 3.3 per cent for sending US$500); however, if country weights (i.e., value of inward remittances to India through each corridor) are taken into account, the weighted average cost works out to be smaller (Charts 7 and 8).9
• Corridors with Thailand and Japan are particularly costly, involving a cost of more than 10 per cent of the principal amount; the share of these countries was, however, only 1 per cent of total inbound remittances (Chart 9). • The cost of sending remittances from high cost corridors (e.g., Thailand and Japan) is found to be higher for other major remittance corridors as well, implying that banking and financial services related to remittances may be costly in these countries (Chart 10). • Although the cost of sending US$200 to India through banks and MTOs has declined (Chart 11), bank charges are almost double the cost charged by MTOs, probably reflecting higher compliance cost with regard to AML/ CFT regulations.
4.3 Remittance Cost for Receivers As alluded to earlier, some part of the cost of a remittance transaction may be borne by the receiver in the form of commission, tax and foreign currency charges, depending on the nature of agreement between the intermediaries. The survey results show a wide variation in the cost borne by receivers, including differentiation across source countries and modes of transfer. The cost of receiving US$200 through various modes (excluding cheques and drafts) varies between zero and 13.3 per cent of the remitted amount across all banks, with charges by public sector banks being lower than those of private and foreign banks. In particular, private sector banks’ charges range between zero and 12.6 per cent, despite having the largest market share in remittances business. These costs halve for US$500 across all bank groups, however, pointing to scale economies for banks (Table 4). In the case of GCC countries, account-to-account transactions are operational with banks having tie-ups with the exchange houses. This results in the cost of receiving remittances being effectively zero; only the tax part is deducted. 4.4 Money Transfer Operators Among non-banking players, MTOs play a vital role in the remittance space across the globe. MTOs are financial companies which undertake cross-border transfer of funds on behalf of their clients by using either their internal systems or by accessing cross-border banking networks. In the case of India too, MTOs play a very crucial role by catering to the needs of migrant workers who are not able to use the banking channel for a variety of reasons, including financial illiteracy. MTOs servicing the Indian diaspora use a network of their own outlets or other transfer agents (e.g., banks, exchange bureaus, post offices, cell phone centers, travel agencies, drug stores, and gas stations) to transfer remittances. Importantly, the cost of remittances through MTOs is competitive vis-à-vis banks and they are generally popular for low value cash transactions. In fact, the recent surge in FinTech has empowered MTOs to pose a major challenge to the dominance of the banking sector in remittances business (Box II). | Table 4: Cost Borne by Receiver in India | | Per cent | | | US$200 | US$500 | | Bank Type/Mode | Public Sector Banks | Private Sector Banks | Foreign Banks | Public Sector Banks | Private Sector Banks | Foreign Banks | | Direct Transfer to Bank Account/Electronic Wire | 0-1.5 | 0-1.9 | 0-2.0 | 0-0.7 | 0-1.1 | 0-0.8 | | SWIFT | 0.5-4.4 | 0-12.7 | 0-13.3 | 0-2.5 | 0-6.3 | 0-5.4 | | RDA/Vostro Account | 0-2.4 | 0-4.5 | 0-5.5 | 0-1.0 | 0-1.8 | 0-2.0 | | Others (Including Cheque and draft) | 0-2.3 | 0-12.6 | 0-40.4 | 0-1.0 | 0-5.1 | 0-16.4 |
Box II: Operational and Cost Aspects of MTOs MTOs operate through a franchised network of cross border fund transfers under the Money Transfer Service Scheme (MTSS). It involves a tie-up between reputed money transfer companies abroad known as ‘Overseas Principals’ and agents in India known as ‘Indian Agents’, the latter being responsible for disbursing funds to the final beneficiaries either directly or through sub-agents (Figure 1). The ‘Overseas Principal’ should be a registered entity licensed by the financial regulatory authority of the host country for carrying on money transfer activities, with permission from the Department of Payment and Settlement Systems (RBI) under the provisions of the Payment and Settlement Systems Act (PSS Act) 2007. The Indian agent should be an AD-I or AD-II bank or Full Fledged Money Changers (FFMCs), a post office, which, in turn, can appoint sub-agents, viz., retail outlets and commercial entities. The MTSS is perceived as a convenient means of funds transfer for migrants with limited access to the banking system in the host country and preference for cash-to-cash services. In adherence to AML/CFT regulations, the scheme allows personal remittances towards family maintenance and foreign tourism in India with a cap of US$2,500 in value terms. Furthermore, 30 remittances are allowed per person per year. Remittances for trade- related activities and investments to NRE/NRO accounts are not permissible under this scheme. Limited access to operating licenses through the RDA channel overseas has also played a role in focusing the business model of MTOs on low value transactions under the MTSS. 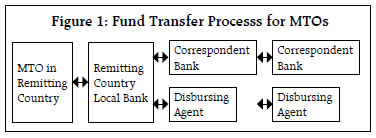 More than 50 per cent of remittances channeled by MTOs is from GCC countries. The survey suggests that the average sender cost is lower for MTOs than for banks and the cost differential narrows with higher value remittances. The cost of remitting US$200 through MTOs is in the range of 0-11.1 per cent of remitted amount, much lower than the cost charged by banks in the range of 0-22.7 per cent of the total amount remitted across corridors. For sending US$500, however, the cost differential narrows with cost of 7.1 per cent and 9.2 per cent for MTOs and banks, respectively (Chart II.1). 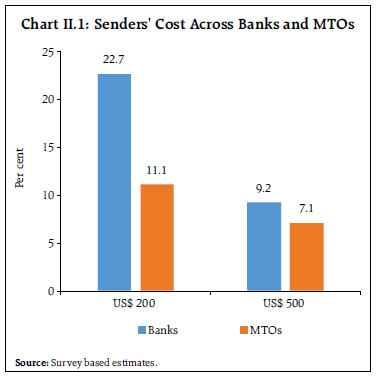 The difference in remittance cost charged by MTOs vis-à-vis banks exists across countries and corridors, with the low overhead cost structure of the former and better exchange rates on consolidated transfers enhancing their core competence and cost effectiveness. Moreover, in the case of MTOs, the cost structure is relatively dynamic and influenced by various factors like festivals, locations, special pricing and marketing promotions. Taken together, these advantages drive senders to use MTOs or more informal and riskier channels. In the case of India, more than 90 per cent of total MTO transactions are cash-to-cash services (Chart II.2). The risk of unaccounted transfers and fragmentation of high value transactions into a number of low value transactions may be higher through these channels. Banks, on the other hand, offer smooth and secure transmission channels catering to all regulatory compliances but with higher cost. References International Remittances, Finacle from Infosys, October 2011 Master Circular on Money Transfer Service Scheme, Master Circular No.1/2015-16, July 2015, https://www.rbi.org.in/Scripts/BS_ViewMasterCirculars.aspx?Id=9895&Mode=0 Master Direction – Money Transfer Service Scheme (MTSS), February 2017, FED Master Direction No.1/ 2016-17, https://www.rbi.org.in/scripts/NotificationUser.aspx?Id=10868&fn=5&Mode=0 | 5. Conclusion To sum up, the survey provides some interesting insights on various aspects of remittances, which could be exploited for developing and building up a conducive policy ecosystem that nurtures and magnifies these vital foreign exchange to India in a well-directed manner and at minimum costs, so that welfare gains accrue to senders, recipients and to the Indian economy. The largest chunk of inbound remittances is destined to Kerala, Maharashtra and Karnataka, a feature which can be employed to develop preferred habitats for remittance flows and worthy of emulation by lower profile remittance receiving States as an ever-increasing share of India’s population turns mobile overseas in search of work commensurate with skills and demographics. GCC countries are the major source of remittances and business tie-ups with various exchange houses have facilitated cheaper transmission of remittances relative to those from other countries. Policy initiatives to cultivate these sources – G2G; B2B; and crowding-in of P2P10 need to be accorded priority to augment ticket sizes and lower costs. Moreover, the survey shows that despite banks having greater access to RDA, the overall cost charged by MTOs is significantly lower probably due to their core advantages in low value remittance business and dynamic cost structure. Accordingly, MTOs and the policy framework in which they operate need to be reset to enable them to reap economies of scale and scope, with a level playing field vis-à-vis banks. This may warrant a careful review of the AML/CFT regime, which is prudent, transparent and effective but supportive of small operators and networks. In the formulation of these policy initiatives, India begins with a comparative advantage – corridor-wise data from the RPW show that the weighted average cost of sending remittances to India is lower than the simple average cost that is benchmarked by the World Bank to monitor the country-level progress in the reduction of remittances costs. References Cecchetti, Stephen and Kim Schoenholtz (2018), “The stubbornly high cost of remittances”, https://voxeu.org/article/stubbornly-high-cost-remittances. Chandramouli, Anand (2012), “Remittance Market: Ready and Waiting for its ‘Skype’ Moment”, Cognizant Report, November. Gibson, J. and H. Rohorua (2006), “How Cost Elastic Are Remittances? Evidence from Tongan Migrants in New Zealand”, Pacific Economic Bulletin, Vol.21(1): 112-128. International Monetary Fund (2009), International Transactions in Remittances: Guide for Compilers and Users, Statistics Department, IMF, Washington, D.C. Kosse, Anneke and Robert Vermeulen (2014), “Migrants’ Choice of Remittance Channel: Do General Payment Habits Play A Role?”, ECB Working Paper Series No. 1683, June. Mela, Maurro (2017), “Cross Border Remittances Pricing- Does market structure drives the prices for cross-border remittances in South Africa?”, Finmark Trust Report. Reserve Bank of India (2006), Report of the Working Group on Cost of NRI Remittances. Reserve Bank of India (2016), Annual Report 2015-16. World Bank Remittances Worldwide database. World Bank (2018), Migration and Remittances-Recent Development and Outlook, April 2018.
|