Against the backdrop of the slowdown in global growth and trade, the global banking system has continued to grapple with several challenges in recent years. The wait for a widespread revival in global banking activity has continued as concerns about low profitability and weakening asset quality mar the performance of the banking systems in some advanced economies and most emerging economies, including India. Notwithstanding these concerns, emerging economies have continued to consolidate their positions in the global banking system. On the positive side, various regulatory/supervisory reforms being undertaken since the global financial crisis have helped in strengthening the capital positions of global banks. I. Introduction The global financial crisis and the ensuing sovereign debt crisis brought to the fore the fragility of the global banking system and its adverse impact on the global economy through real, financial and confidence channels. Moreover, it also underlined the need for global regulatory and supervisory cooperation. Since then, there have been several vistas of actions, both national and multi-lateral. By the year 2016, some new concerns have emerged. In an environment of sluggish global growth and trade, the global banking system has been undergoing a mix of trials and tribulations – regulatory/ supervisory reforms; improvement in the capital positions of global banks; muted global banking activity; tepid credit growth, low profitability; and asset quality concerns. This article reviews the growth and health of the global banking system and analyses the progress achieved in global regulatory reforms. The broad focus is on the decade of the 2010s with a more detailed discussion for the year 2016. The rest of the article is organised as follows. The second section analyses banking performance using generic indicators of soundness and profitability for select advanced economies (AEs) and emerging market and developing economies (EMDEs) against the backdrop of global economic trends. The third section evaluates performance of banking systems in certain major economies/economy groups. The performance of the top 100 global banks is presented in Section four. The major regulatory and supervisory policy initiatives are discussed in Section five. Section six provides conclusions and future perspectives. II. Global Banking Trends Macro-financial risks persisted The global economy was marked by a decelerating growth in 2016 witnessed across both AEs and EMDEs. According to the World Economic Outlook, April 2017 of the International Monetary Fund (IMF), global economic growth for 2016 was reported to be 3.1 per cent, lower than growth recorded in 2015. The growth in gross domestic product (GDP) for AEs and EMDEs was 1.7 per cent and 4.1 per cent, respectively. Although the rate of unemployment in AEs posted a decline in 2016, inflation has been picking up in these economies due to higher commodity prices. In EMDEs, however, these pressures eased slightly. Debt in the general government balance sheets remained high. However, there remained an uncertainty about future economic prospects given the uncertainty surrounding the policy stance in the US and its ramifications for the global economy (Chart 1). Divergent pattern of credit growth across AEs and EMDEs Reflecting varying growth and differential stages of bank balance sheet repairs, credit growth displayed divergent trends across economies. However, in general, credit growth slowed down in most economies in 2016. While AEs, such as the US, Germany and France maintained their credit growth, the growth in the UK and Japan showed some resilience. Spain and Portugal continued to record negative growth. Among EMDEs, high loan delinquencies took a toll on credit growth in India and Russia. Brazil recorded negative credit growth in recent months. However, credit growth in China continued to be excessive at more than 10 per cent given the already highly leveraged condition of Chinese corporates. (Chart 2). Given these weakening trends in credit growth, the IMF’s Global Financial Stability Report – October 2016 highlighted the revival of credit growth as a challenge for these economies along with smooth deleveraging of weakened corporate balance sheets, which will have implications for growth prospects of these economies in the near term. Return on Assets remained low The weak credit growth reflected in low return on assets (RoA)1 is expected to further affect the ability of banks to support growth and sustain capital levels through adverse economic cycles. Among AEs, banks in the US and the UK showed marginal improvement in RoA in recent years. In peripheral economies of the Euro-zone such as Greece, Italy, Portugal and Spain, banks reported an increase in RoA from the earlier negative levels. Among EMDEs, due to the huge burden of stressed assets, banks in Russia and India witnessed significant declines in RoAs. The RoA of Chinese banks too declined sharply. Indonesian banks’ profitability metrics steadily declined in recent years dragged down by rising credit costs, although, their profitability remained relatively high compared to banks of other EMDEs (Chart 3). Capital adequacy remained stable The capital adequacy positions of banks defined as regulatory capital to risk-weighted assets ratio in major countries remained stable at end-September 2016 as compared to the corresponding quarter of the previous year. Since 2010, the capital positions had improved consistently in major AEs except for the US spurred by stronger capital requirements and gradual implementation of Basel III. However, for EMDEs, such as Russia and Mexico, capital positions either deteriorated or remained unchanged due to various banking sector issues which had constrained banks in these countries from building higher capital buffers. Capital adequacy position of banks in India showed a marginal improvement, though, it was lower when compared with that of banks in most of the major EMDEs (Chart 4). Divergent trend in the leverage ratio with EMDEs showing an improvement The leverage ratio2 acts as a credible supplementary measure to the risk-based capital requirements and is intended to constrain the buildup of leverage in the banking sector. Basel III norms mandate a minimum leverage ratio of 3 per cent. The long-term trend since 2010 across both AEs and EMDEs suggests an improvement in the leverage ratio due to the regulatory requirements under the Basel III framework (Chart 5). Deterioration in asset quality in most EMDEs The non-performing loans (NPLs) ratio3 of peripheral economies of the Euro-zone remained much higher than core economies. For most EMDEs, the general trend was that of a rise in the NPL ratio, including India, Russia, Indonesia and Brazil (Chart 6). Various factors are responsible for worsening asset quality in these countries, e.g., sector specific problems in case of India, economic weakness in case of Brazil and Russia and excessive corporate leverage in case of China.4 Deteriorating asset quality of banks adversely affects the lending capacity of banks, reduces their profitability, erodes their bank capital and can pose challenge to these economies. Bank stock indices rallied Bank stock indices, an indicator of banks’ profitability, market sentiments and general economic environment, gained more than 30 per cent in the US in H2 of 2016 largely due to the improved profitability of US banks, expectation of more frequent rate hikes by the Fed, and expectation about revision in the Dodd-Frank Wall Street Reform and Consumer Protection Act. In the Eurozone, though bank stock indices corrected in the initial months of H1 of 2016, in the later part of the year, they recovered. The returns on bank stocks in EMDEs were muted during 2016 on account of poor performance of banks and emerging market sell-off (Chart 7). CDS spreads in Euro-zone remained high Sovereign credit default swaps (CDS), which protect investors against losses on sovereign debt, are important tools in the management of credit risks. Relative to bond spreads, sovereign CDS spreads tend to reveal new information more rapidly during periods of stress (IMF – GFSR, April 2013). Sovereign CDS spreads of peripheral economies of the Euro-zone remained high given the vulnerabilities in these economies. In June 2016, bank CDS spreads of the UK and EU banks rose sharply on account of the UK referendum result of June 2016, popularly known as Brexit. However, they ebbed subsequently. Euro zone bank spreads remained higher than those in the US and UK. CDS spread of major Indian banks viz., State Bank of India and ICICI Bank have narrowed since July 2016 following proactive steps for balance sheet clean up. However, uptick was witnessed in the CDS spread of ICICI Bank in recent months (Chart 8). III. Banking Trends in Select Advanced Regions and Countries i) US banking system – Signs of recovery After a severe setback following the global financial crisis, bank credit growth in the US rose from the third quarter of 2011 till the beginning of 2016. However, it showed some moderation in the second and third quarters of 2016.5 A rising trend in the growth of bank deposits too could be seen in 2016, but the growth in deposits remained distinctly lower than that in credit (Chart 9). A broad-based revival in credit growth While credit flow to every sector/segment had received a setback with the onset of the global financial crisis, commercial and industrial sector, and credit secured by real estate sector were worst affected. The revival following the crisis was generally broad-based with all recipient sectors posting an increase in credit growth, including the two aforementioned sectors. After Q3 of 2012, however, growth in credit to the commercial and industrial sector stagnated, although it remained higher than that in other sectors. By contrast, credit secured by real estate continued to rise (Chart 10). Retail credit too showed a steady rise during this period. On the back of an improvement in consumer confidence and decline in unemployment, retail credit continued to grow in 2016. Declining trend in NPLs NPLs, particularly in the real estate sector, which had been the weakest spot in the US banking system post-crisis, showed a steady decline in the following years. However, delinquency rates in this sector have continued to be the highest.6 Delinquency rates in commercial and industrial sector, although the lowest, have shown a marginal rise in 2016 so far (Chart 11). ii) UK banking system – exhibiting a healthy growth but marked by uncertainty Following the Brexit, the banking system in the UK has been under scrutiny of all stakeholders, including regulators, investors and depositors. The analysis about the UK banking system from various sources, including the IMF, showed UK banks in good health with adequate liquidity and capital buffers to absorb adverse shocks resulting from the Brexit.7 The key banking indicators too have shown a healthy growth in 2017 so far. Private sector credit growth rose from April 2016 through January 2017 except for a dip between September and November 2016. Growth in private sector deposits too maintained its momentum till September 2016 after which, however, there was a moderate slowdown (Chart 12). 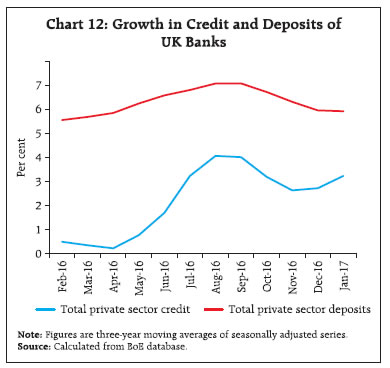 Data from the Bank of England (BoE) suggests that household credit (including credit to individuals and unincorporated enterprises), a segment of private sector credit, has been on the rise. However, in line with the two indicators of bank credit and deposits discussed earlier, there were some signs of slowdown after October 2016. Credit to private non-financial corporations, the second segment of private sector credit, showed a sharp and continued fall after July 2016, possibly in the aftermath of the Brexit (Chart 13). Moreover, credit to large businesses too showed a distinct break in July 2016; the growth in credit to these corporations after July was slower than before (Chart 14). 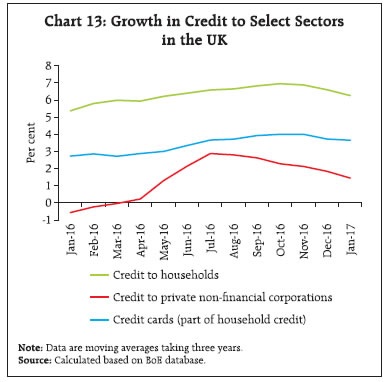
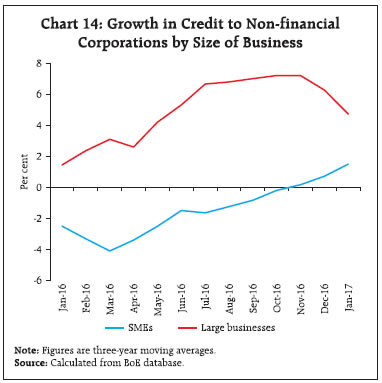 The credit growth to Small and Medium Enterprises (SMEs), the second major segment of businesses, remained in the negative zone during a major part of 2016 (Chart 14). However, the pace of decline in SME credit has slowed down in 2017 so far. This was also borne out by the Credit Conditions Survey of the BoE showing the sentiments of banks about credit flow, repayments and defaults. As per this survey, past observations as well as future expectations about the availability of bank credit to both small and medium enterprises in the pre-Brexit period extending up to the first quarter of 2016 were broadly positive (Chart 15).8 Given that UK is marked by high levels of household indebtedness, the ongoing adjustments in the real estate market following the Brexit may have implications for household defaults. Data available till Q4 of 2016 showed a decline in defaults on secured household credit (Chart 16). Going forward, many factors signal an uncertain environment for UK banks. These include (a) deteriorating economic outlook and employment in the UK; (b) tightening credit access for SMEs following adjustments in real estate market given that SMEs rely heavily on real estate for bank credit; (c) adjustments in real estate markets also affecting repayments in the household sector adversely; and (d) a persistently weak profitability following low interest rates along with high operating costs for UK banks. iii) Euro Zone banking system – increase in credit growth with a shift to stable sources of funding At the aggregate level, there was a pickup in the balance sheet growth of Euro Zone banks in 2016. Moreover, the formation of the asset growth cycle too was at a relatively high level since the latter half of 2015. Another positive feature during this period was that the growth cycle of banks’ funding through issuance of debt securities was restricted to a much lower level, suggesting reduced reliance on wholesale funding (Chart 17). The credit growth to private non-financial sector turned positive since June 2015. Among the major member countries, while France and Germany followed this trend closely through September 2016, in Italy and Netherlands, the growth turned negative again in June 2016. However, growth picked up once more in the Netherlands in September 2016. In Spain, by contrast, the credit growth continued to fall (Chart 18). SMEs account for 99.8 per cent of the total firms in the euro area, 60 per cent of turnover and 70 per cent of employment, and are largely dependent on bank finance.9 The ECB survey of access to finance for SMEs in euro area showed that the expectations about an improvement in the availability of credit to these enterprises outweighed those of a possible decline since H2 of 2014 (Chart 19). 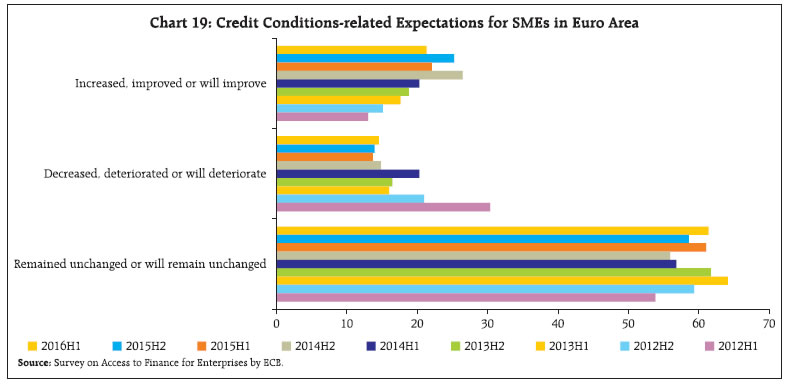 In the GFSR of October 2016, the IMF observed that at the close of 2015, euro area banks were earning less than half of their average profits during 2004-06. The upward movement in growth of euro area bank credit to private non-financial sector, despite weak bank profitability, could be attributed to steps taken by the ECB since June 2014 to encourage banks to lend more. The introduction of negative deposit rate was one of these steps taken by the ECB. The rate on the deposit facility, which banks use to keep their money in the form of overnight deposits with the ECB was made negative to encourage more lending (Chart 20). This policy supplemented the ongoing reduction in the interest rate on the main refinancing operations (the rate at which the bulk of liquidity is provided to the banking system) and the rate on the marginal lending facility (the rate at which overnight credit is offered to banks). 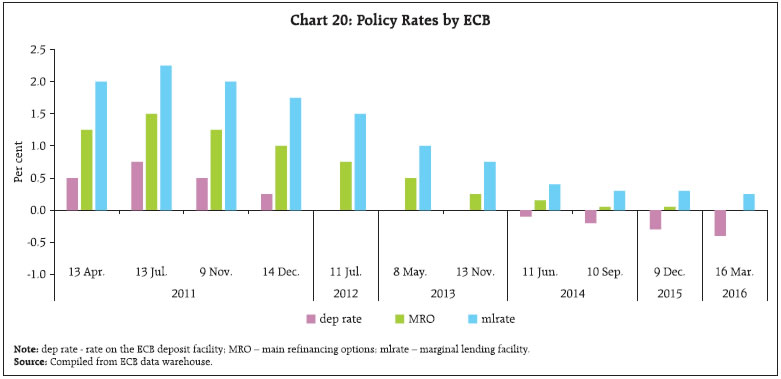 Till 2014, the injection of liquidity made available through the ongoing policies of ECB was used by banks to mostly deleverage, without transmitting funds to the non-financial sector. The ECB, therefore, introduced the negative rate and also restarted its quantitative easing in September 2014. There has been a steady decline in Euribor (Euro Inter-bank Offered Rate) since 2014 with the rates moving into the negative territory since 2015 (Chart 21). This reflected (a) an excess liquidity in the interbank market and (b) an improvement in the credit worthiness of the euro area sovereigns. As already noted, on the funding side, euro area banks have seen, in the past year, a move away from wholesale funding through issuance of debt securities. The latter development has evidently helped member countries to move to more stable funding options like deposits. The downward movement of short-term deposit rates in select member countries10 suggests that there has been a relaxation in the funding strains of banks in these countries (Chart 22). In fact, the loan to deposit ratio of all euro area banks taken together declined from 102.4 per cent in 2015 Q1 to 100.7 per cent in 2016 Q3 as growth in total deposits of euro area’s banking sector increased at a higher rate than the growth in the sector’s total loans (Charts 23a and 23b). 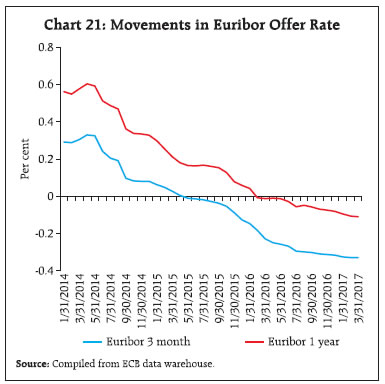 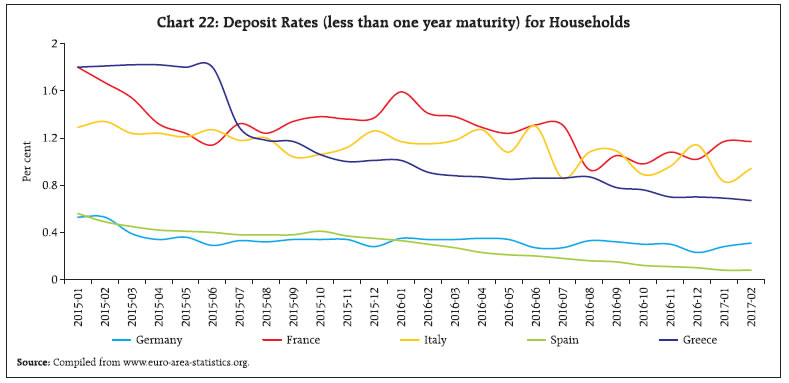 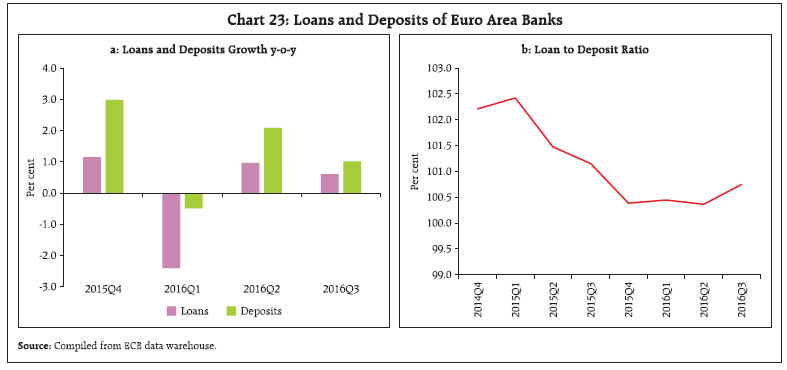 IV. Performance of Top 100 Global Banks Banks maintained their positions in top 100 The top global banks did not see much movement in their ranks (global rank by tier 1 capital) between 2015 and 2016; the rank correlation coefficient being 0.95 for top-20 banks and 0.97 for top-50 banks.11 Increase in asset share of emerging economies Although the number of banks populating the top 100 from the AEs and EMDEs remained broadly similar across 2015 and 2016, there was an increase in the share of assets held by banks from the EMDEs which was generally the trend observed following the global financial crisis (Chart 24). The asset share of individual AEs in the top 100 banks, barring Japan and the US, declined between 2015 and 2016 with the decline being more pronounced for France, Germany and the UK. By contrast, the rise in the share of EMDEs was boosted by China (Chart 25). Growing differential in the profitability of top 100 banks There was a growing differential in the profitability of top 100 banks with the share of banks reporting negative Return on Assets (RoA) going up to 4 per cent in 2016 from 2 per cent in 2015, and an increase in the share of banks reporting higher RoA (ranging between 0 and 2 per cent) from 92 per cent to 93 per cent (Chart 26). Improvement in the financial soundness of top 100 banks Between 2015 and 2016, there was an increase in the concentration of banks reporting higher capital-to-assets ratio (lower financial leverage) (ranging between 6 and 10 per cent) from 36 per cent to 47 per cent (Chart 27). The second positive development was an overall improvement in the asset quality of top 100 banks. First, there was no change in the shares of banks in the higher NPL size classes ranging above 3 per cent. Secondly, there was a sharp decline in the shares of banks reporting NPLs in the range of 2-3 per cent (Chart 28). Thirdly, an increased focus on strengthening capital adequacy positions could also be seen. The concentration of banks with CRAR ranging from 13 to 17 per cent increased from 25 to 37 per cent (Chart 29). V. Global Banking Policy Reforms There has been an increasing recognition for regulatory reforms and an improved consistent framework for supervising globally active banks. Accordingly, the global regulatory standards continued to be strengthened in 2016. Improved resilience in the banking reflected the impact of Basel III capital adequacy norms. Recently, policies aimed at promoting public confidence and upholding the safety and soundness of banks have also been in focus. The implementation of global regulatory reforms has led to an increase in capital and liquidity buffers of major banks. Banks’ attempt to reduce bad loans and strengthen their balance sheet through adapting to new business realities and regulatory standards has been necessitated by the era of low growth and low interest rates. The policy makers’ role in this era of rising uncertainties, has become even more crucial in order to complete the regulatory reform agenda. Some of the major developments in the global regulatory standards in the recent period include: Total loss-absorbing capacity Holdings Standard The final standard released in October 2016 by the Basel Committee on Banking Supervision (BCBS) applies to both global systemically important banks (G-SIBs) and non-G-SIBs and aims to reduce the risk of contagion within the financial system should a G-SIB enter resolution. An important element of the standard is that banks must deduct, subject to a threshold, Total Loss-Absorbing Capacity (TLAC) holdings that do not otherwise qualify as regulatory capital from their own Tier 2 capital. Standards for Interest Rate Risk in the Banking Book (IRRBB) The new standards were issued by the BCBS in April 2016, revising the 2004 principles for the management and supervision of interest rate risk. The standards set out supervisory expectations for banks’ identification, measurement, monitoring and control of IRRBB as well as its supervision. The enhancements to the 2004 standards, among others, include more extensive guidance on the expectance for a bank’s IRRBB management process, better disclosure requirements, an updated standardised framework and a stricter threshold for identifying outlier banks which has been reduced from 20 per cent of a bank’s total capital to 15 per cent of bank’s Tier 1 capital. The standards are expected to be implemented by 2018. Regulatory treatment of accounting provisions A consultative document and also a discussion paper on policy considerations related to the regulatory treatment of accounting provisions were released by the BCBS in October 2016. The new accounting standards modify provisioning standards to incorporate forward-looking assessments in the estimation of credit losses. The Committee’s proposal to retain, for an interim period, the current regulatory treatment of provisions under the standardised and the internal ratings-based approaches is set out in the consultative document. It contains the policy options for the long-term regulatory treatment of provisions under the new expected credit loss standards. Revisions to the securitisation framework The BCBS in July 2016 published an updated standard for the regulatory capital treatment of securitisation exposures to include the regulatory capital treatment for “simple, transparent and comparable” (STC) securitisations, amending 2014 capital standards for securitisations. The capital treatment for STC securitisations builds on the 2015 STC criteria published by the Basel Committee and the International Organisation of Securities Commission. This sets out additional criteria for differentiating the capital treatment of STC securitisations from that of other securitisation transactions. The standard once effective (i.e., in January 2018) is expected to contribute to a more resilient banking sector. The key achievements in the implementation of the various regulatory reforms include: Implementation of the G20 Agenda for Reforms The Financial Stability Board (FSB) in its 2nd annual report to the G20 on the implementation and effects of reforms (August 31, 2016) highlighted four core elements of the reform programme, which include: (i) making financial institutions more resilient; (ii) ending too-big-to-fail; (iii) making derivatives markets safer; and (iv) transforming shadow banking into resilient market-based finance. As far as implementation progress of reforms is concerned, it remains steady but uneven across the core areas. Adoption of Basel III Generally, the implementation of Basel III capital and liquidity standards remained timely, and banks were on track to meet the requirements. A number of major AEs, however, could not address deviations in their rules from the Basel framework. All 24 FSB jurisdictions had the core elements of the Basel III risk-based capital and liquidity regulations in force. Final rules on higher loss absorbency requirements for G-SIBs remained in force in all jurisdictions that had G-SIBs headquartered in them. G-SIBS In case of G-SIBs the implementation of higher loss absorbency and more intensive supervision is well on track. For the year 2016, the list of G-SIBs was published by the FSB and 30 institutions were identified. During 2016, four banks moved to a higher bucket and three banks to a lower bucket. VI. Conclusions and Future Perspectives Four broad observations can be made based on the analysis in this article. First, bank credit growth – a key to the expansion of the assets of the global banking system – was marked by a striking differential between AEs and EMDEs, with AEs showing a resilient pattern of growth. In most AEs, including the US, it was the retail sector that imparted this resilience. The outlook about credit access to sectors that relied heavily on bank financing and were crucial for revival in employment and growth, namely, SMEs too remained broadly positive. In the fiscally strained AEs, namely, Spain, Portugal and Italy, however, the slowdown in credit growth continued to be a concern. In absolute contrast, the credit growth in most EMDEs was declining or even negative, weighed down heavily by persistent asset quality concerns. Interestingly, notwithstanding the slowdown in credit growth for EMDEs, banks from these economies witnessed a rise in their shares in global banking assets. Asset quality, the second area of concern, remained weak in EMDEs. For most AEs except Spain, Portugal and Italy, however, there was a distinct improvement in asset quality. Thirdly, profitability, linked closely to credit growth and asset quality concerns, showed a modest improvement in most AEs as reflected in the increase in RoA. Yet, RoA remained less than 1 per cent in all these economies. By contrast, banking systems in most EMDEs were marked by deterioration in profitability. Fourthly, however, the trend emerging from both AEs and EMDEs was similar with regard to an improvement in the capital adequacy levels. Globally, policy makers have been in the process of fortifying the regulatory framework for their banking systems. While some of these policies have shown immediate results, others may pay off in the medium to long run. All these together are expected to make the global banking system more sound and resilient. However, despite the positive efforts towards enhancing soundness, several downside risks and challenges continue to afflict the global banking system. These risks have arisen not just from within the banking system but from the state of the global economy in general, and fiscal policies and trends in household and corporate leverage, in particular. Furthermore, the impact of these risks differs across AEs and EMDEs. Even within AEs, these risks have manifested differently for the European economies that were affected by the sovereign debt crisis. At the present juncture, given that risks continue to weigh heavily on the outlook for the global banking system, there is need for both AEs and EMDEs to continue to work individually and jointly towards strengthening and reviving the global banking system. These efforts assume importance particularly in light of the emerging concern about a possible regulatory rollback from certain AEs. There has to be greater commitment towards consistently implementing the banking regulatory reforms while strengthening the macro-prudential oversight over banks. There is a need, however, to rightly calibrate the transition in order to avoid any adverse impact on the global economy, particularly since global growth remains weak. Furthermore, following the changes in the macro-prudential framework for banks, regulatory arbitrage resulting in the migration of risks to the shadow banking sector also needs to be closely monitored. Going forward, the policy reforms along with the global economic outlook will decide the future trajectory for the global banking system. Moreover, various other global events, including the execution of Brexit and the related directions regarding the financial services industry, pace and timing of the reversal from the unconventional monetary policy by the US, effective resolution of fiscal strain in the peripheral European economies and corporate deleveraging in most EMDEs, including China and India, will shape the global banking outlook.
|