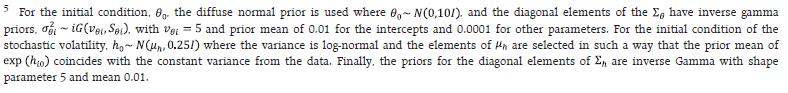
by Harendra Kumar Behera and Abhishek Ranjan^ This article estimates the time-varying impact of food and fuel price shocks on core inflation to examine their potential second-round effects on headline inflation in India. The empirical analysis suggests a decline in both the magnitude and duration of the impact of food shocks on core inflation in the post de jure flexible inflation targeting (FIT) regime. However, the response of core inflation to fuel price shock becomes significant and large during global uncertainties. A decline in volatility and persistence of core inflation shock along with the fall in pass-through of food shocks to core inflation pointing towards some moderation in the second-round effects of food inflation swings on headline inflation. Introduction Supply shocks play a significant role in shaping inflation dynamics, with first and second-round effects exerting distinct but interconnected influences on prices and economic activity. The first-round effects typically manifest as immediate changes in the prices of goods and services directly affected by the shocks originating from a variety of sources, including geopolitical events, natural disasters, technological innovations and policy interventions. The second-round effects occur after the transmission of initial price changes to other sectors of the economy through various channels. These channels include input-output linkages, wage adjustments, and expectation formation. For example, a rise in energy prices can increase production costs for manufacturers, leading them to pass these higher costs to consumers through higher prices for finished goods. Moreover, workers may demand higher wages to compensate for the erosion of their purchasing power, further exacerbating inflationary pressures. Notably, the propagation of second-round effects depends, inter alia, on the extent of price stickiness, labour market rigidities, and the credibility of monetary policy in anchoring inflation expectations. By enhancing the understanding of these dynamics, policymakers can better anticipate and respond to supply-driven fluctuations in inflation, promoting macroeconomic stability and sustainable growth amid uncertainty and volatility. Emerging Market Economies (EMEs) are generally more susceptible to supply-side shocks due to the high weight of food and fuel in their consumer price basket. Many EMEs have adopted a flexible inflation targeting (FIT) framework, where the inflation forecast serves as an intermediate target. Inflation forecasting and management become a daunting task in the presence of high volatility in food and fuel prices, especially in EMEs like India, where food and fuel components taken together account for 53 per cent of the CPI basket. In such a scenario, second-round effects can be especially concerning, as they can lead to a vicious cycle of rising prices, thereby destabilising inflation expectations. If the central bank has established credibility in consistently meeting its inflation objectives, the extent of second-round effects may be more moderate (Mishkin 2007a,b). Credibility fosters stable expectations among economic agents, reducing the likelihood of extreme reactions to policy adjustments. India’s monetary policy framework has undergone significant changes with the adoption of FIT since September 2016. The headline CPI inflation broadly remained close to the target in the post-FIT regime until the onset of the COVID-19 pandemic in March 2020. Subsequently, inflation picked up due to overlapping domestic and global supply shocks, viz., extended supply chain disruptions due to the pandemic, the war in Ukraine and the concomitant jump in crude oil and other commodity prices, and erratic weather (uneven and excess/scanty rainfall). Vegetable inflation accelerated to 37.4 per cent in July 2023 before moderating to 3.4 per cent in September, mainly due to supply disruptions caused by heavy rainfall and floods in the northern parts of the country and lower production in Karnataka and Maharashtra due to pest attacks on crops. However, it again rose to 26.7 per cent in December 2023. Persistent price pressures in cereals, pulses, and spices have kept overall food inflation elevated. While these shocks seemed to be transitory, recurring incidences of such shocks can impart generalisation and persistence. As noted by Dr. M.D. Patra, Deputy Governor, in his minutes in the Monetary Policy Committee meeting of October 2023, “… When headline inflation faces price pressures from perishables like vegetables, the standard operating procedure of monetary policy is to look through the transitory impact of their first-round effects and await mean reversion. Increasingly, however, these so-called transitory shocks test our buffers and policy responses, given their unanticipated nature. Moreover, these so-called transitory shocks recur with high intensity and disturbing force. Price pressures accumulate in the inflation formation process, imparting hysteresis to inflation expectations and potentially to actual inflation outcomes.” RBI Governor, Mr. Shaktikanta Das, also stated in his December 2023 policy statement, “... Headline inflation continues to be volatile due to multiple supply side shocks which have become more frequent and intense. The trajectory of food inflation needs to be closely monitored. Intermittent vegetable price shocks could once again push up headline inflation in November and December. While monetary policy would look-through such one-off shocks, it has to stay alert to the risk of such shocks becoming generalised and derailing the ongoing disinflation process.” Again, in his February 2024 statement, he reiterated the issue by stating, “… Recurring food price shocks could interrupt the ongoing disinflation process, with risks that it could lead to de-anchoring of inflation expectations and generalisation of price pressures.” More recently, inflation has been moderating. In particular, core inflation has softened to below 4 per cent in response to anti-inflationary monetary policy stance and correction in input costs. However, given the large volatility that has been observed in inflation in India as well as major economies post-pandemic, policymakers face challenges in dealing with surges/ collapses in food or energy prices as it is difficult to know ex ante the nature of these shocks - whether permanent or temporary, and whether they are going to have second-round effects. Moreover, when there is a regime change, understanding the evolution of second-round effects becomes paramount. In view of the above background, this article tries to estimate the time-varying impact of food and fuel inflation shocks on core inflation to assess second-round effects1. Additionally, an attempt has been made to study how inflation persistence has changed over time in view of changing food and fuel price dynamics. The following section presents some stylised facts about both global and domestic inflation dynamics. Section III discusses both methodology and empirical results. The final section provides some concluding remarks. II. Inflation Dynamics: Stylised Facts Inflation surged across countries following the pandemic and reached levels unseen since the great inflation of the 1970s (Chart 1). Inflation surged to 9.1 per cent in the US by June 2022 and to 10.6 per cent in the euro area by October 2022, and it has started moderating gradually thereafter. 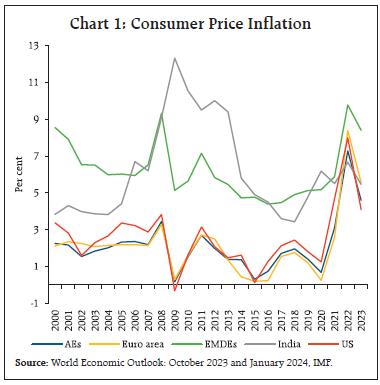 As compared with advanced economies (AEs), inflation accelerated at a slower pace in emerging and developing market economies (EMDEs) but is now above the levels of the AEs. Another feature of EMDEs is the greater weight of food items in their CPI basket (Table 1). Unlike in the AEs, food price shocks in the EMDEs are more frequent with persistent effects, which can propagate strongly to core inflation (Walsh, 2011). Hence, ignoring food price shocks in monetary policy formulation can often result in policy mistakes (Anand, 2014). Moreover, because of the high share of food in the overall consumption basket, food inflation plays a crucial role in forming inflation expectations and wage price increases. | Table 1: Weights of Food and Fuel in Consumer Price | | (in per cent) | | Country | Food | Fuel | Source | | US (Urban) | 14.41 | 6.66 | CEIC (2023) | | UK | 11.9 | 14.1 | CEIC (2023) | | Germany | 12.66 | 5.35 | Eurostat (2022) | | France | 16.56 | 4.73 | Eurostat (2022) | | Japan | 26.26 | 6.93 | CEIC (2023) | | India | 45.86 | 6.84 | CEIC (2023) | | China | 19.9 | 2~3 | Bloomberg | | Brazil | 21.11 | 11.46 | CEIC (2023) | | Australia | 17.18 | 4.52 | CEIC (2023) | | Philippines | 37.73 | 6.74 | CEIC (2023) | | Indonesia | 25.01 | 5.81 | CEIC (2023) | | Myanmar | 58.46 | 8.08 | CEIC (2022) | | Thailand | 40.35 | 5.49 | CEIC (2023) | As in the other EMDEs, the weight of food in CPI basket in India is the largest, and this is also reflected in its contribution to overall inflation (Chart 2). The contribution of fuel inflation has also been significant during episodes of high global uncertainty. In India, headline inflation and food inflation move in tandem with a correlation coefficient of 0.93. The volatility in headline inflation is driven by both food and fuel inflation, as core inflation is relatively stable. 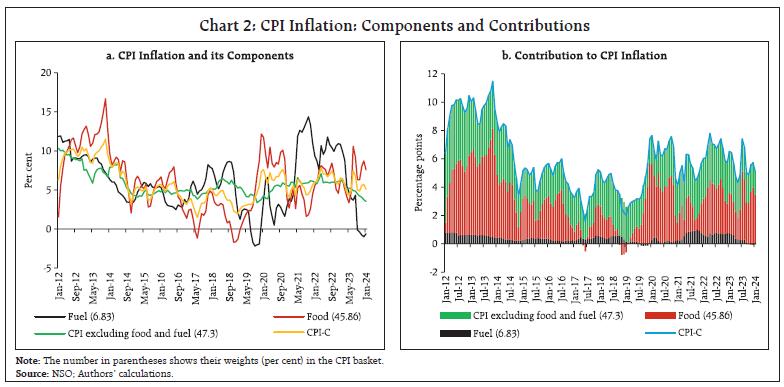 Headline inflation stayed elevated during 2020-21, mainly due to supply disruptions during the nationwide lockdown, non-availability of labour at mandis, impediments to transportation, and excess rains causing damage to vegetables and Kharif crops. As a result, headline inflation reached a multi-month peak of 7.6 per cent in October 2020. With the ebbing of supply-side pressures and prospects for the rabi crop becoming better, food inflation eased from 10.1 per cent in October 2020 to 1.6 per cent in September 2021, and headline inflation remained below the upper tolerance level of the target except for the months of May and June, mainly due to the upside price pressures stemming from fuel components. Subsequently, a steep increase in vegetable prices led to food inflation reaching 10.6 per cent in July 2023, which eased subsequently to 6.2 per cent in October 2023 with the reversal of vegetable price pressures. Pandemic-driven adverse supply shocks, taxes and sustained input cost pressures kept core inflation elevated until February 2023, which has since then abated to below 4 per cent. Core inflation was mainly driven by goods price inflation in the post-pandemic period, as sharp rises in input costs due to supply disruptions during the pandemic were gradually passed on to commodity selling prices of the firms (Chart 3). The services core inflation contribution to overall core inflation moderated from about 55 per cent before the pandemic to about 40 per cent subsequently, mainly driven by reduced pressures in house rent, health, education and household services. The sharp rise in inflation around the world during 2021-2022 has ignited academic and policy interest in examining the role of inflation expectations in driving inflation dynamics (Brandão-Marques et al., 2023). In the Indian context, it is also found that household expectations play a crucial role in determining inflation (Pattanaik et al., 2020), and inflation expectations are anchored by food inflation (Anand et al., 2014). Moreover, high food and fuel inflation can get generalised in the system through inflation expectations (RBI, 2014). The correlation between household inflation expectations (3-month ahead IE or 1-year ahead IE) and food inflation remains high, though it has declined in the recent period (Chart 4). The correlation of household inflation expectations (1-year ahead) with headline inflation is 0.73, and with core inflation is 0.68. However, the relationship between household inflation expectations and fuel inflation has weakened. 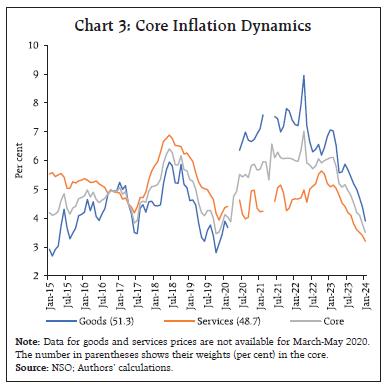 Wage growth, if not commensurate with productivity gains, could be inflationary. A sustained increase in wages drives food inflation by buttressing demand where the impact is more persistent (Mohanty, 2014). Wage growth is persistent only when food inflation crosses double digits (Goyal and Baikar, 2015). A sharp rise in food inflation can feed into rural wages and inflation expectations (Chart 5). The inflationary impact of a food price shock may not be transitory when inflation expectations are high and not well anchored. This could have an adverse impact on inflation expectations and, hence, the medium-term inflation outcome. III. Empirical Findings A statistically significant b1 coefficient indicates the transmission of shocks from non-core components to core inflation. When b1 is negative, it indicates that headline inflation converges to core inflation and any deviation of headline from core is transitory and may not get generalised. On the other hand, a positive b1 indicates the persistence of supply shocks, keeping headline inflation elevated. To examine whether core inflation reverts to headline inflation, the following equation is estimated: When the coefficient b2 is positive and statistically significant, it indicates that a rise in headline inflation above the core subsequently raises core inflation, leading to the convergence of core to headline inflation. Using quarterly data for the period 1997-98:Q1 to 2023-24:Q3, the above equations (1) and (2) are estimated for h = 1, 2, 3, and 4.2 The results indicate that there is convergence of core to headline inflation for the near-term horizon, as b2 is positive and statistically significant up to the 2nd quarter (Table 2). However, the headline reverts to core inflation over 3-4 quarters, as b1 is negative and statistically significant for h = 3 and 4.3 In the Indian context, the presence of the second-round effect was found by Raj and Misra (2011) and Anand et al. (2014), where either the wholesale price index (WPI) or CPI-IW was used to measure inflation. Recent studies based on CPI-C data showed that headline inflation often reverts to core inflation (Dholakia and Kadiyala, 2018; Patnaik, 2019; Raj et al., 2020; Goyal and Parab, 2020; RBI, 2021; Patra et al., 2023; George et al., 2024). | Table 2: Regression Results | | h | b1 | b2 | | 1 | -0.09 (-1.03) | 0.21** (2.39) | | 2 | -0.24 (-1.54) | 0.29** (2.55) | | 3 | -0.47* (-1.79) | 0.27 (1.47) | | 4 | -0.66* (-1.86) | 0.32 (1.25) | *;**;***: Significant at <10%, <5% and <1% level, respectively.
Figures in parentheses are t-statistics. | Given the above findings, it would be pertinent to examine how the impact of supply shocks has changed over time. The relationship between food/ fuel inflation and core inflation is investigated by using a TVP-VAR framework (Primiceri, 2005), covering data on core, food and fuel inflation and real GDP growth (y-o-y) from 1997-98:Q1 to 2023-24:Q3. The TVP-VAR model with a stochastic volatility framework has been used since inflation components have been highly volatile during different episodes. We follow Österholm (2018) for estimating the TVP-VAR model with stochastic volatility. The model is represented by: Initial values of θ0 and h0 have been estimated5. The specified model has been estimated by using the Bayesian Markov Chain Monte Carlo (MCMC) method (with 200,000 simulations). After discarding the initial 50,000 samples in the burn-in period, the posterior estimates are derived from the rest where the sample paths are stable, and the sample autocorrelations are much lower. The estimated stochastic volatility is found to be higher for fuel and food as compared to core inflation (Chart 6). While food inflation volatility has declined over time, reflecting advancements in infrastructure and better supply management, fuel inflation volatility has varied significantly over time in tandem with swings in global energy prices. The volatility of core inflation has also been on a steady decline since the Global Financial Crisis. The volatility of GDP growth has been mostly range-bound except during the pandemic. The median impulse responses generated by using posterior estimates show that the responsiveness of core inflation to its own shock has varied over time (Chart 7). After declining until 2007, both the magnitude and persistence increased subsequently and peaked in 2010, followed by a decrease thereafter. Particularly, the core inflation persistence has declined from 6 quarters during 2009-11 to just 1 quarter in 2020-23, suggesting better anchoring of inflation expectations.  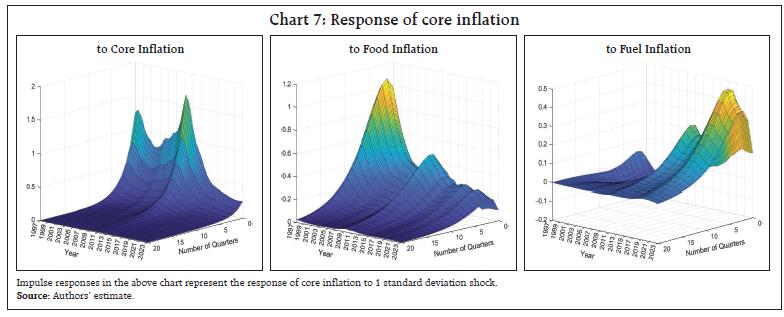 The response of core inflation to food inflation shock is found to be the highest during the 2nd to 3rd quarter and starts dampening thereafter. The impact of food inflation shock on core inflation was the maximum during the late 1990s, which has declined over time. The response of core inflation to a one per cent rise in food inflation has declined from 0.37 percentage points in 1998-99:Q2 to 0.18 percentage points in 2006-07:Q4 before increasing again to 0.30 percentage points in 2009-10:Q4. During this period, the response was relatively persistent, with the maximum impact reaching by 3rd quarter. The response had started declining after 2009-10:Q4 and reached 0.17 percentage points in 2015-16:Q1 before increasing again to 0.21 percentage points in 2018-19:Q1. Thereafter, it has been declining consistently and reached 0.14 percentage points in 2023-24:Q3. The significance of the impact declined from 8 quarters in 1997 to 7 quarters in 1999, then it increased to 10 quarters during 2009-2011. However, the duration of the impact started declining thereafter to 6 quarters by 2022-23. Specifically, the responsiveness of the core inflation to food shock has declined substantially in the post de jure FIT regime in India. Turning to fuel component shock, its impact on core inflation is found to be largely statistically insignificant, although it has become statistically significant lately amid large shocks to global energy prices. The impact of the fuel inflation shock persists for a longer duration. The peak impact of a one per cent rise in fuel inflation on the core has reduced from 5-6 quarters in the 2000s to 2-3 quarters during 2018-2023. IV. Conclusion This paper assessed the degree and duration of the potential second-round effects of food and fuel price shocks on headline inflation. Our analysis suggests that headline inflation reverts to core inflation and not vice versa. While there has been a decline in the volatility of fuel inflation, its impact on core inflation has turned significant of late. By applying the TVP-VAR model, we find that core inflation has become less responsive to supply shocks over time with a reduction of its persistence. Furthermore, our results suggest that the impact of food shock on core inflation has reduced over time. These findings together imply a better anchoring of inflation expectations, especially after the de jure adoption of FIT in India. In today’s environment of elevated global uncertainties, recurrent large supply shocks, and shifting climatic patterns, a regular assessment of the pass-through of food and fuel shocks to core inflation is needed for a more informed policy analysis. References Anand, R., Ding, D. & Tulin, V. (2014), “Food Inflation in India: The Role for Monetary Policy”, IMF Working Paper, WP/14/178, International Monetary Fund, Washington D.C., USA. Borio, C., Lombardi, M., Yetman, J., & Zakrajšek, E. (2023). The Two-regime View of Inflation. BIS Papers, No. 133, March. Brandão-Marques, L., Gelos, G., Hofman, D., Otten, J., Pasricha, G. K., & Strauss, Z. (2023). Do Household Expectations Help Predict Inflation? IMF Working Paper, WP/23/224, International Monetary Fund, Washington D.C., USA. Cecchetti, S. G. & Moessner, R. (2008), “Commodity Prices and Inflation Dynamics”, BIS Quarterly Review, December, Bank for International Settlements, Basel, Switzerland Dholakia, R & Kadiyala, V.S. (2018), “Changing Dynamics of Inflation in India”, Economic & Political Weekly, 53(9), 65-73. George, A.T., Bhatia, S., John, J. & Das, P. (2024), “Headline and Core Inflation Dynamics: Have the Recent Shocks Changed the Core Inflation Properties for India?” RBI Bulletin, February. Goyal, A & Baikar, A.K. (2015). Psychology or Cyclicality: Rural Wage and Inflation Dynamics in India. Economic & Political Weekly, 50(23), 116-25. Goyal, A., & Parab, P. (2020). Inflation Convergence and Anchoring of Expectations in India. Economic & Political Weekly, 55(47), 37-46. Mishkin, Frederic S. (2007a). “Inflation Dynamics,” speech delivered at the Annual Macro Conference, Federal Reserve Bank of San Francisco, San Francisco, March 23, 2007. Mishkin, Frederic S. (2007b). “Headline versus Core Inflation in the conduct of Monetary Policy,” speech delivered at the Business Cycles, International Transmission and Macroeconomic Policy Conference, HEC Montreal, October 20, 2007. Mohanty, D. (2014). Why is Recent Food Inflation in India so Persistent. Annual Lalit Doshi Memorial Lecture delivered at the St. Xavier’s College, Mumbai, January. Österholm, P. (2018). The Relation Between Treasury Yields and Corporate Bond Yield Spreads in Australia: Evidence from VARs. Finance Research Letters, 24: 186-192. Patnaik, A. (2019). Impact of Food Inflation on Headline Inflation in India. Asia-Pacific Sustainable Development Journal, 26(1), 85-111. Patra, M.D., Behera, H. & John, J. (2021). Is the Phillips Curve in India Dead, Inert and Stirring to Life or Alive and Well? RBI Bulletin, November. Patra, M.D., John, J. & George, A.T. (2023). Recent Regime Reversal in Inflation: The Indian Experience. RBI Bulletin, April. Pattanaik, S., Muduli, S. & Ray, S. (2020) Inflation Expectations of Households: Do They Influence Wage-Price Dynamics in India?, Macroeconomics and Finance in Emerging Market Economies, 13(3), 244-263. Primiceri, G. E.(2014). Time Varying Structural Vector Autoregressions and Monetary Policy. The Review of Economic Studies, 72(3), 821-852. Raj, J. & Misra, S. (2011). Measures of Core Inflation in India – An Empirical Evaluation. Reserve Bank of India Occasional Paper, 32(3), 37-66. Raj, J., Misra, S., George, A. T. & John, J. (2020). Core Inflation Measures in India: An Empirical Evaluation using CPI Data. RBI Working Paper Series, No. 05/2020. Reserve Bank of India (2014): Report of the Expert Committee to Revise and Strengthen the Monetary Policy Framework, January. Reserve Bank of India (2021). Report on Currency and Finance 2020-21. Mumbai. https://rbi.org.in/Scripts/PublicationsView.aspx?id=20344 Walsh, J. P. (2011). Reconsidering the Role of Food Prices in Inflation. IMF Working Paper, No. 11/71, Washington D.C.
|