by Dhirendra Gajbhiye, Sujata Kundu, Rajas Saroy, Deepika Rawat, Alisha George, Omkar Vinherkar and Khushi Sinha^ Over the last three decades, India's services export growth has not only outpaced merchandise export growth but has also captured a larger share of world exports. Moreover, the robust growth in services exports continued in the post-pandemic period. Against this backdrop, this article undertakes a disaggregated analysis of India's major services exports, covering issues such as price versus volume effects, long-term trend, and revealed comparative advantage. Empirical estimates suggest that global demand and relative prices are significant determinants of India's services exports in the post-global financial crisis period. I. Introduction India's services exports in US dollar terms grew at a robust compound annual growth rate (CAGR) of more than 14 per cent over the last 30 years (between 1993 and 2022), significantly higher than India's merchandise export growth (10.7 per cent) as well as world services export growth (6.8 per cent). As a result, the share of India's services exports in world services exports rose more than 8 times from 0.5 per cent in 1993 to 4.3 per cent in 2022. Today, India is the 7th largest services exporting country in the world, a phenomenal rise from the 24th position in 2001.1 India ranks 2nd in the world in case of telecommunication, computer and information services exports, 6th in personal, cultural and recreational services exports, 8th in other business services exports, 10th in transport services exports, and 14th in travel services exports. Robust growth and stability in services exports has imparted strength to India's balance of payments (BoP) by offsetting a significant part of the economy's merchandise trade deficit. Services trade has been relatively more dynamic benefitting from mutually reinforcing factors including an accelerating pace of technological change and policy reforms aiming to make domestic services market more competitive (World Bank and World Trade Organisation, 2023). With the advent of digitalisation and technological advancements, emerging market economies (EMEs), including India, have witnessed newer opportunities to expand exports of services and to improve their participation and competitiveness in global value chains (GVCs). Services inputs, whether imported or locally produced by foreign or domestically owned enterprises, are increasingly used in the production of manufactured products that are subsequently exported, thus leading to a growing servicification of manufacturing exports. In the case of India, domestic services value-added share stood at 17.7 per cent in gross manufacturing exports in 2020 as compared with 13.4 per cent in 2011.2 Additionally, services have formed their own value chains due to the fragmentation of inputs at different stages of production and in different locations (Nano and Stolzenburg, 2021). Around 69 per cent of global services trade consists of trade in intermediates with the rest being trade in services for final consumption (World Bank and World Trade Organisation, 2023). The outbreak of the pandemic in 2020 severely impacted services activities and, therefore, their delivery both at the domestic and global fronts. While the impact on merchandise trade turned out to be almost transitory, the adversities were sharper for global services trade as around 40 per cent is constituted by travel and transportation services, wherein the pandemic-induced restrictions on social distancing and cross-border mobility inflicted a severe blow. Therefore, while global merchandise exports dipped by 7.2 per cent in 2020, the decline in services exports was much sharper at 17.2 per cent. In contrast, in case of India, services exports stood resilient, primarily owing to the larger share of telecommunication, computer and information services exports, which gained from digitalisation and the government's Digital India initiative providing the infrastructure needed for growth of services exports, especially information technology (IT) and IT-enabled services (ITeS). India's rising software and other business services exports through Global Capability Centres (GCCs) are a testament to its growing dominance in high-skilled and high-value services exports. The wave of big data, Artificial Intelligence (AI), Machine Learning (ML), Internet of Things (IoT) and advancements in compatible hardware, generative AI, and spatial computing has opened up newer dimensions for Indian software exports. Generative AI is projected to become a US$ 1.3 trillion market by 2032 (Bloomberg, 2023). India is also experiencing the generative AI boom with currently around 60 start-ups and a projected market size of US$ 4.2 billion in 2030.3 Furthermore, by 2035, integration of AI into economic processes is expected to boost India's annual GVA growth from the baseline projection of 5.8 per cent to 7.1 per cent (Statista, 2023). India's services exports, both traditional and modern,4 are conditional on an array of factors including world demand, exchange rate, manufacturing exports, infrastructure, robust institutions, foreign direct investment (FDI) and financial development (Sahoo et al., 2013). Exports of telecom and computer services are not constrained by distance, and are driven, inter alia, by the English-speaking skills of the workforce (Tharakan et al., 2005; Hyvonen and Wang, 2012), the number of graduates, and the quality of infrastructure relating to information and communication technology (ICT) (Nasir and Kalirajan, 2014). Foreign income is seen as an important driver of services exports for certain Asian economies (Ahmad et al., 2017). The income elasticity of demand for services exports is higher than that for imports (Thomas, 2015). Sahoo et al. (2013) and Ahmad et al. (2017) found that exchange rate movements affect India's services exports, while Thomas (2015) found no such impact. The networking effect from manufacturing exports accelerates growth of services exports (Dehejia and Panagariya, 2014). Services also show potential to raise their value-added contribution to manufacturing exports, particularly in high-value sectors like IT services (Chakrabarty, 2019). The 1990s witnessed growth in India's services exports owing to a policy shift from import substitution to export promotion, which was further boosted by India joining the WTO in 1995 (Thomas, 2015). Post-GFC, world services trade has witnessed more resilience than merchandise trade which provides an upside potential for growth in low labour cost economies like India (RBI, 2022). Against this backdrop, this article explores the potential drivers behind India's robust services export growth. First, it analyses the contribution of the volume and price effects in services exports, and the underlying trend and cyclical components. Second, it undertakes a revealed comparative advantage (RCA) analysis of major services categories in a cross-country setting. Third, it estimates the income and price elasticities of India's services exports. The article is organised as follows. Following the introduction, Section II presents key stylised facts concerning the volume and price effects, trend, cycle and residual components and the RCA analysis. Section III provides a disaggregated analysis of India's major services export categories. Section IV presents the empirical methodology and results on the major determinants of India's services exports, followed by the concluding Section V. II. Stylised Facts II.1 India's Services Exports: Volume vis-à-vis Price Effects The decomposition of India's services export growth into volume and price effects5 reveals that volume effects have majorly dominated the export performance (Chart 1). During 2020, with the outbreak of the pandemic, the crash in exports was totally on account of a decline in export volume. However, as commodity prices shot up and stayed elevated during 2021 and 2022, the price effect also contributed to the rise in services export growth.6 II.2 India's Services Exports: Trend vis-à-vis Cycle An analysis of the trend, cycle and residual components7 of India's services export growth suggests a moderately increasing trend in services export growth. The dominating trend component during the early 2000s boom of the services sector moderated post the global financial crisis (GFC), which reversed around 2016, benefiting from improvements in infrastructure (transport/logistics/IT), technological advancements and disaggregation of services value chains supported by pro-active government policies.8 The contraction in export growth during 2020 was primarily an outcome of the residual component pulling down export growth and offsetting the positive impact of the trend and the cyclical components (Chart 2). In the wake of the COVID-19 pandemic, digital trade has become an important tool for enhancing resilience by maintaining business operations, delivering goods and services amidst physical restrictions and diversifying supply chains. Digital technologies have been instrumental in coping with and recovering from the pandemic, and exports in sectors with more digitally enabled remote work suffered less from the COVID-19-related supply disruptions.9 This favoured a quick recovery of India's services exports. 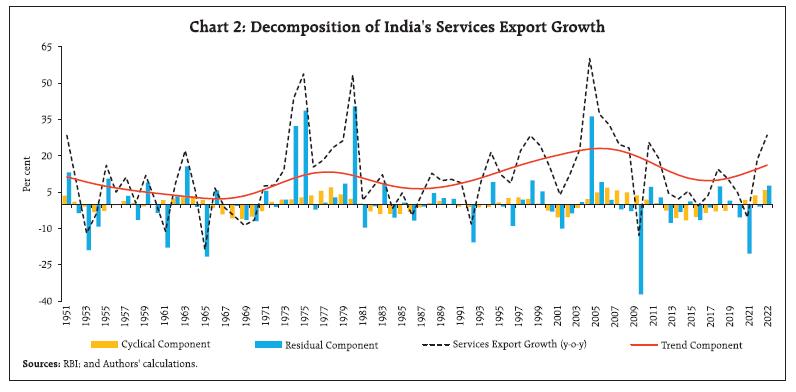 II.3 Revealed Comparative Advantage Analysis To understand the comparative advantage underlying India's services exports, RCA analysis of major services categories was undertaken. The Ricardian theory of trade posits that patterns of trade among countries are governed by their relative differences in productivity. The RCA uses the observable pattern of trade to infer unobservable differences in relative productivity between countries. 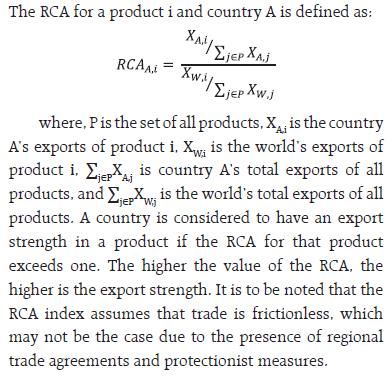 An analysis of RCA for leading exporters shows that India has a revealed comparative advantage in telecommunication, computer and information services (Table 1). Indeed, India has established a stronghold in this service over the past two decades. In telecommunication, computer and information services, Ireland remains the leader by RCA score, which may be attributed, inter alia, to its favourable corporate tax regime (Deloitte, 2017). RCA scores of nearly all leading exporters, including India, in this category have moderated since 2010 due to increasing competition from other countries. India's RCA has improved for other business and transport services in 2022 over 2010. The higher RCA score in other business services exports highlights the untapped potential in the sector. The comparative advantage for India is relatively low in transport services. In the case of travel exports, India has displayed significant recovery post-pandemic. Moreover, with better rank than some of its major Asian peers, India's travel services export has potential for further growth. After this brief overview of India's services trade, a sectoral deep dive is provided in the next section on the four key services export categories – travel, transport, telecommunication, computer and information services and other business services – which account for over 85 per cent of India's services exports. III. Disaggregated Analysis of Services III.1 Telecommunication, Computer and Information Services India's telecommunication, computer and information services export, with a share of around 47 per cent in total services exports during 2022-23, is the major contributor to India's services export growth. With an average export growth of 9.0 per cent during 2011-12 to 2022-23, the sector has grown in tandem with the global trend alongside the advancement in IT. With a share of 15 per cent in world telecommunication, computer and information services exports in 2022, India was the second largest exporter after Ireland (Chart 3a). Robust exports in this segment had partially cushioned the fall in India's total services exports during the pandemic year 2020-21 (Chart 3b). 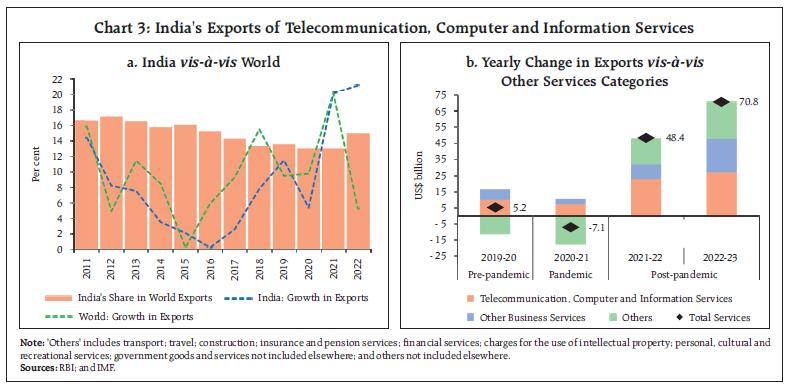 The Government of India has implemented various policy initiatives such as developing Software Technology Parks and Special Economic Zones, export subsidies, tax-free imports of computer hardware, and facilitating imports of advanced technology. These policies have enabled the Indian IT industry to gain a competitive edge in terms of service quality and price competitiveness (Chakraborty and Dutta, 2002; Bhattacharjee and Chakrabarti, 2015). A major structural shift appears to have taken place in 2020 with the pandemic-induced rising reliance on contactless technologies. Indian IT firms signed major digital transformation deals, with the computer services sector receiving an unprecedented FDI investment of US$ 23.8 billion in 2020-21 followed by a total of US$ 14.6 billion during 2021-22 and 2022-23. The boom in telecommunication, computer and information services exports in recent quarters is a reflection of the expansion in scope, value and number of GCCs in India. Compared to 2015-16, the number of GCCs in India has increased by approximately 60 per cent to reach more than 1580 in 2022-23.10 GCCs are being set up by multinational corporations in India for efficiency gains and reduction in their business costs. They have now transformed into analytics capability development centres and research & development (R&D) centres, leveraging India's analytics talent force and rich ecosystem of startups. The Business Process Management (BPM) industry has advanced remarkably due to innovation in digital consumer experience and data driven transformation.11 India's success story has also benefitted from the global boom in digital services exports. According to the WTO, global exports of digitally delivered services have more than tripled since 2005, growing at 8.1 per cent per annum on average during 2005-22, thus outpacing the growth in exports of both goods and other services (WTO, 2023). The exports of digitally delivered services in 2022 were 37 per cent above their 2019 level, mainly due to a rise in remote-work set-up. India's performance over this period was even more striking with growth of 93 per cent (Chart 4a).12 As a result, India's share with respect to the world in digitally delivered services exports improved to 5.9 per cent in 2022 from 4.2 per cent in 2019 (Chart 4b). III.2 Other Business Services Around one-fourth of India's services exports is contributed by other business services which exhibited a robust average growth of around 28 per cent in the recent two years (Chart 5). In 2022-23, India's other business services exports rose to US$ 80.4 billion from US$ 59.0 billion in 2021-22. More than three-fourths of this growth is driven by five major categories – business and management consultancy and public relations services; engineering services; advertising, trade fair services; R&D services; and other technical services including scientific/space services (Chart 6). India's other business services export is growing rapidly owing to its status as the destination preferred by multinationals to set up GCCs. A survey of 99 multinationals by Deloitte reveals that engineering research and development (ER&D) GCCs in India have met the expectations of their parent organisations, and higher budget allocations for India operations are on the horizon. India is well-positioned to leverage this success and cater to more skill-intensive and increasingly digitalised services. Innovation in new areas of technology, which comprised about 5-10 per cent of the work executed by the GCCs around five years ago, has shot up by over three times now.13 By 2030, India is expected to house around 2,400 GCCs (EY, 2023). In 2022, India turned out to be the largest recipient of FDI in the R&D segment (O'Farrell, 2023). Innovation R&D, and digitalisation14 are expected to be the powerful forces boosting productivity through economy-wide forward and backward linkages in the medium to long-term (Dabla-Norris et al., 2023). 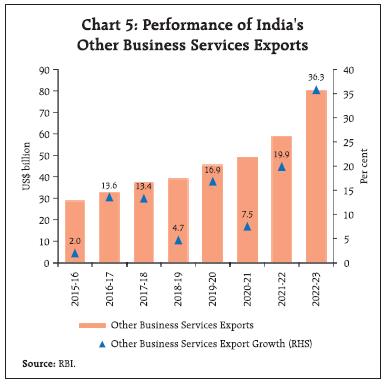 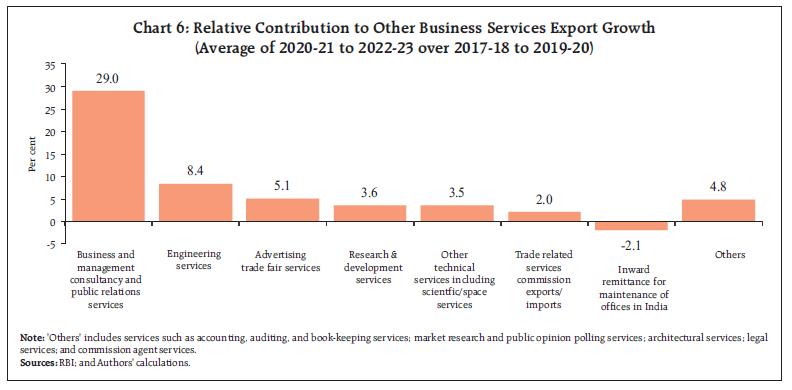 III.3 Travel While India's travel export has been resurgent in terms of global share, the sector is still reeling from the effect of pandemic-induced movement restrictions. After steadily increasing to US$ 30.0 billion in 2019-20 from US$ 18.5 billion in 2011-12, travel services receipts dropped post-pandemic to US$ 9.1 billion in 2021-22 but recovered sharply in 2022-23 to US$ 27.0 billion. Travel services receipts are driven by foreign tourist arrivals (FTAs). Due to the pandemic, the share of leisure travellers declined from 57.1 per cent in 2019 to 5.8 per cent in 2021, while the share of tourists arriving for medical purposes increased from 6.4 per cent in 2019 to 21.2 per cent in 2021 (Chart 7). During 2022 and 2023, the share of leisure travellers rose, although it remains below the pre-pandemic level. According to the data for 2022 from the Ministry of Tourism (GoI), India received the highest number of medical tourists from Bangladesh, followed by Iraq, Yemen, Oman and Maldives. The growth of the medical tourism industry in India may be attributed to better affordability and the improving availability of high-quality healthcare services and infrastructure.  Trade in travel services depends upon economic and geo-political conditions both in the source and host economies, as well as regulatory norms such as visa rules and health certificates. As a step towards a facilitative visa regime, the e-visa facility has been extended to the nationals of 171 countries under 7 sub-categories, viz., 'e-Tourist visa', 'e-Business visa', 'e-medical visa', 'e-Medical Attendant Visa', 'e-Ayush', 'e -Ayush Attendant' and 'e-Conference Visa' (as of February 2024).15 Empirically, FTAs were found to be significantly positively correlated with the travel and tourism competitiveness index (TTCI). Cross-sectional correlation between FTAs and TTCI across 139 countries for 2019 turned out to be 0.57 (Chart 8). India's performance with respect to the TTCI has improved over the years with its rank rising from 68 in 2011 to 34 in 2019.16 III.4 Transport In transport services exports, India's rank in global transport earnings has jumped up from 19 in 2005 to 10 in 2022.17 Earnings via the sea transport route constituted the bulk of transport revenues with an average share of 68 per cent in value terms during 2018-19 to 2022-23. Owing to container shortages and turnaround delays, the pandemic had initially struck a heavy blow to transportation services, thus impacting global freight rates as reflected in a dip in the Baltic Exchange Dry Index (Chart 9). However, the surge in demand for goods during H2:2020-21 and H1:2021-22 against supply-side capacity constraints resulted in a jump in freight rates during this period. Due to subdued demand across markets, freight rates have corrected post Q1:2022-23, which is also reflected in a fall in India's transportation receipts during the same period.18 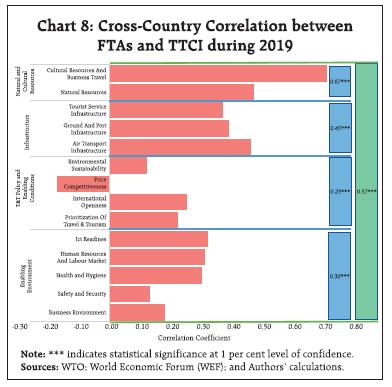 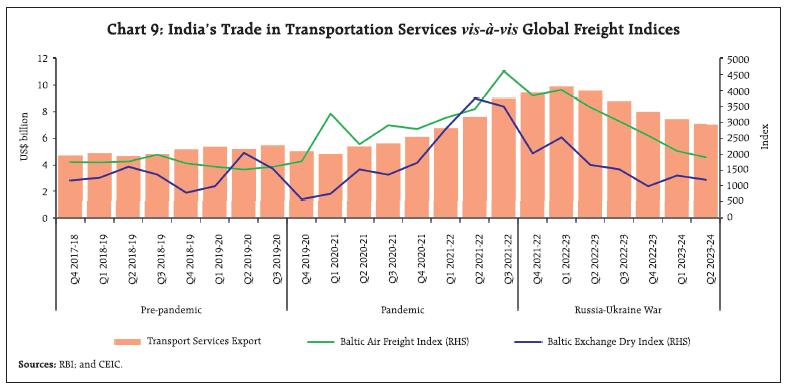 As per the World Bank's logistics performance index (LPI)19, India was ranked 44th in 2018 out of 160 countries, with a score of 3.18. In 2023, India's rank stood at 38 out of 139 countries, with a score of 3.40 led by pro-active government reforms.20 The PM Gati Shakti National Master Plan (PMGS-NMP) launched in October 2021 is focused on leveraging technology for infrastructure planning and development. The National Logistics Policy (NLP) launched in September 2022 aims to upgrade and digitise logistics infrastructure and services, and facilitate green transition using energy-efficient modes of transportation, greener fuels, and targeted policy measures to reduce cargo-delays at ports and airports. IV. Determinants of India's Services Exports: An Empirical Analysis This section analyses the determinants of India's services exports, in particular, their income and price (exchange rate) elasticities. The sample period spans from 2010q1 to 2022q4, i.e., post-GFC. Various econometric techniques, including Dynamic Ordinary Least Squares (DOLS), Vector Error Correction Models (VECMs), Autoregressive Distributed Lag (ARDL) models, and cross-sectional regressions have been used to study the determinants of services exports in the extant literature. Given the available data (Annex Table 1), their time series properties, and the need to study both short-run and long-run relationships, we model the data under a VECM framework, as all variables were found to be integrated of order 1 and have a cointegrating relationship as per the Johansen cointegration test (Annex Tables 2 and 3).21 Income elasticity is measured by estimating the sensitivity of real exports to external demand (proxied differently in different studies through global growth, partner country growth, and global exports), while price elasticity is measured by estimating the impact of the real exchange rate on real exports (Chinoy and Jain, 2019). In this article, the real GDP index for OECD countries and the RBI's trade-weighted real effective exchange rate (REER) are considered to estimate income and price elasticities, respectively. A real services export index has been constructed for the analysis.22 Alongside these variables, a proxy for digitalisation and technological advancement is included in the VECM (the number of subscribers to telecommunication services, Table 2 Specification 2). Additionally, to explore the relationship between FDI and India's services exports, the model has been augmented with FDI in the services sector23 as a long-run exogenous variable (Table 2 Specification 3).24 The REER was considered to be an endogenous variable across specifications, while real GDP index of the OECD was considered to be a long-run exogenous variable. Results The results indicate a statistically significant impact of external demand and relative prices on India's services exports, with the expected signs and magnitudes in line with the available literature25 (Table 2). As per the regression estimates (Specification 1), a 1 per cent rise in global GDP leads to a 2.5 per cent rise in India's real services exports while a 1 per cent rise in REER (currency appreciation) can result in a 0.8 per cent fall in India's real services exports. The price and income elasticities, controlling for the number of telecom subscribers and FDI in services, are somewhat higher at (-) 1.2/(-)1.3 and 2.8, respectively (Specifications 2 and 3). The error correction terms are negative and significant. Further, the results indicate that services exports benefit from an increase in the number of telecom subscribers (Specification 2) and higher FDI in services (Specification 3). The estimates are in line with the literature, which conclude that exports are strongly determined by the output of trading partners (Ahmad et al., 2017; Malik and Velan, 2020; Thomas, 2015; Sahoo et al., 2013). In the case of India's software exports, physical distance has been found to not significantly hinder trade (Tharakan et al., 2005). In addition, the literature provides similar evidence of a significant impact of REER on India's services exports. Services, especially modern services, use fewer imported inputs, have lower fixed costs of entry and are in highly competitive sectors which allow for an elastic supply response (Eichengreen and Gupta, 2012; Chinoy and Jain, 2019). | Table 2: Income and Price Elasticities of India's Services Exports (VECM Model) | | Long-run Results | | Specification 1 | Services Exports = 2.45***OECD-GDP - 0.81**REER | | Specification 2 | Services Exports = 2.79***OECD-GDP - 1.16**REER | | Specification 3 | Services Exports = 2.82***OECD-GDP - 1.31**REER + 0.07*FDI-SERVICES | | Short-Run Results | | Variables | Specification 1 | Specification 2 | Specification 3 | | 1 | 2 | 3 | 4 | | Error Correction Term | -0.29*** | -0.22** | -0.11*** | | | (0.08) | (0.09) | (0.04) | | | [-3.60] | [-2.45] | [-2.68] | | D(Log Service Exports (-1)) | 0.17 | -0.09 | 0.07 | | | (0.11) | (0.12) | (0.10) | | | [1.49] | [0.71] | [0.72] | | D(Log Service Exports (-2)) | 0.23** | 0.17 | 0.14* | | | (0.11) | (0.12) | (0.09) | | | [2.04] | [1.44] | [1.53] | | D(Log Service Exports (-3)) | 0.23* | 0.17 | - | | | (0.12) | (0.13) | - | | | [1.90] | [1.29] | - | | D(Log_REER (-1)) | 0.18 | 0.14 | -0.04 | | | (0.27) | (0.27) | (0.20) | | | [0.65] | [0.52] | [-0.20] | | D(Log_REER (-2)) | 0.05 | 0.035 | -0.02 | | | (0.27) | (0.26) | 0.19 | | | [0.17] | [0.13] | [-0.08] | | D(Log_REER (-3)) | -0.03 | -0.05 | - | | | (0.26) | (0.26) | - | | | [-0.10] | [-0.20] | - | | COVID_dummy (Q22020) | 0.02 | 0.01 | -0.03 | | | (0.04) | (0.05) | (0.03) | | | [0.40] | [0.18] | [-0.87] | | Q42010 dummy^ | - | - | 0.09*** | | | - | - | (0.03) | | | - | - | [2.78] | | Q42011_dummy^ | 0.08** | 0.07* | 0.07** | | | (0.04) | (0.04) | (0.03) | | | [2.03] | [1.74] | [2.32] | | Q22017_dummy^ | 0.11*** | 0.11*** | 0.13*** | | | (0.04) | (0.04) | (0.03) | | | [2.95] | [3.01] | [4.78] | | Q22022_dummy^ | 0.14*** | 0.14*** | 0.14*** | | | (0.04) | (0.04) | (0.03) | | | [3.76] | [3.65] | [5.01] | | D(Log_telecom subscribers) | - | 0.40* | - | | | - | (0.24) | - | | | - | [1.68] | - | | Diagnostics | | Adj. R-squared | 0.41 | 0.43 | 0.57 | | F-Statistic | 4.60 | 4.44 | 8.28 | | VEC Residual Portmanteau Tests for Autocorrelations for Lag h (P-value)26 | 0.36 | 0.54 | 0.71 | | Sample period | 2010q1-2022q4 | 2010q1-2022q4 | 2010q1-2022q4 | | Observations | 52 | 52 | 52 | Notes: 1. ***, ** and *: Represent significance at 1 per cent, 5 per cent and 10 per cent levels of significance, respectively.
2. Figures in ( ) and [ ] indicate standard errors and t-statistics, respectively.
3. ^: Period dummies to control for outliers. | V. Conclusion India's services exports have exhibited resilience over the past decade. A deep dive suggests that volume effects have majorly driven India's services exports relative to price effects. There has been a visible rise in the trend component of India's services exports, benefitting from infrastructural developments (transport/logistics/IT) and technological advancements. Furthermore, the RCA analysis indicates that India has a comparative advantage in telecommunication, computer and information services and also has the potential to diversify its export basket towards other business services. The empirical analysis suggests that global demand as well as relative prices impact India's services exports. To harness the benefits of digitalisation and generative AI, a supportive policy environment would be critical. Additionally, policies to attract FDI in the services sector could provide a further boost to India's exports of services in the medium to long-run. References Ahmad, S. A., Kaliappan, S. R. & Ismail, N.W. (2017) Determinants of Services Exports in Selected Developing Asian Countries. International Journal of Business and Society, Vol. 18(1), 113-132. Anand, R., Mishra, S., & Spatafora, N. (2012). Structural transformation and the sophistication of production. IMF Working Paper No. 12/59. Anand, R., Kochhar, K. & Mishra, S. (2015). Make in India: Which Exports Can Drive the Next Wave of Growth? IMF Working Paper No. 15/119. Bhattacharjee, S. and Chakrabarti, D. (2015). Investigating India's competitive edge in the IT-ITeS sector. IIMB Management Review, Vol. 27(1), 19-34. Bloomberg. (2023). Generative AI to Become a $1.3 Trillion Market by 2032, Research Finds. June. Chakraborty, C. and Dutta, D. (2002). Indian Software Industry: Growth Patterns, Constraints and Government Initiatives. Downloaded from www.researchgate.net/publication/5223758. Chakrabarty, S. (2019). Services Contribution to Manufacturing Exports and Value-Added: Evidence from India and China. Indian Institute of Management, Bangalore, Working Paper, No. 602. Chinoy, S. Z. and Jain, T. (2019). What Drives India's Exports and What Explains the Recent Slowdown? New Evidence and Policy Implications. India Policy Forum, National Council of Applied Economic Research, Vol. 15(1), pp. 217-256. Cleveland, R. B., Cleveland, W. S., McRae, J. E., & Terpenning, I. (1990). STL: A seasonal-trend decomposition. Journal of Official Statistics, 6(1), 3-73. Dabla-Norris, E., et al. (2023). Accelerating Innovation and Digitalization in Asia to Boost Productivity. IMF Departmental Papers 2023/01. Das, A., Banga, R., & Kumar, D. (2011). Global economic crisis: Impact and restructuring of the services sector in India. ADBI Working Paper Series No. 311. Dehejia, R. H. & Panagariya, A. (2014). The Link Between Manufacturing Growth and Accelerated Services Growth in India. National Bureau of Economic Research Working Paper No. 19923. Deloitte. (2017). Your move in the right direction: Investing in Ireland. Eichengreen, B. & Gupta, P. (2009). The Two Waves of Service Sector Growth. National Bureau of Economic Research Working Paper No. 14968. Eichengreen, B. & Gupta, P. (2012). The Real Exchange Rate and Export Growth: Are Services Different? Munich Personal RePEc Archive, Paper No. 43358. EY (2023). Future of GCCs in India - a vision 2030 report. June. Gajbhiye, D., R. Arora, A. Nahar, R. Yangdol and I. Thakur. (2022). Measuring India's Digital Economy. Reserve Bank of India Bulletin, Vol. 76(12). Hofmann B., Park, T., and Tejada, A.P. (2023). Commodity prices, the dollar and stagflation risk. BIS Quarterly Review, March 2023. Hyvonen, M. & Wang, H. (2012). India's Services Exports. Reserve Bank of Australia. IMF, OECD, UNCTAD, World Bank and WTO (2023). Digital Trade for Development. Malik, M. H. & and Velan, N. (2020). An Analysis of IT Software and Service Exports from India. International Trade, Politics and Development. Pondicherry University, Vol. 4(1), 2020. Nano E. and Stolzenburg V. (2021). The Role of Global Services Value Chains for Services-Led Development. Global Value Chain Development Report 2021: Beyond Production. Nasir, S. & Kalirajan, K. (2014). Modern Services Export Performances Among Emerging and Developed Asian Economies. ADB Working Paper Series on Regional Economic Integration, No. 143. O'Farrell, S. (2023). India Switches to R&D. fDi Intelligence, June. Reserve Bank of India (2022). Report on Currency and Finance. Sahoo, P., Das, R. and Mishra, P. (2013). Determinants of India's Services Exports. IEG Working Paper, No. 333. Statista (2023). Artificial Intelligence: in-depth market analysis. Market Insights Report. April. Tharakan, P. K. M., Beveren, I. V. & Ourti, T. V. (2005). Determinants of India's Software Exports and Goods Exports. The Review of Economics and Statistics, Vol. 28(1), pp. 108-143. Thomas, M. (2015). Estimation of the Key Economic Determinants of Services Trade: Evidence from India. Institute for Social and Economic Change (ISEC), Working Paper 348. World Bank and World Trade Organization (2023). Trade in Services for Development: Fostering Sustainable Growth and Economic Diversification. World Trade Organization (2023). Global Trade Outlook and Statistics. April.
Annex | Table 1: Variables and Data Sources | | Variables | Data Source | | Services Exports | Balance of Payments Statistics, Reserve Bank of India (RBI) | | 40 Currency Trade Weighted REER | Centralised Information Management System, RBI | | OECD-Real GDP (Volume Index) | OECD.Stat | | FDI-Services | Department for Promotion of Industry and Internal Trade, Ministry of Commerce and Industry, Government of India | | Number of Telecom Subscribers | World Bank Indicators |
| Table 2: Results of Unit Root Tests | | Variables | Augmented Dickey-Fuller (ADF) Test (Probability Value) | | Log X | Δ Log X | | Log (Services Exports) | 1.00 | 0.00 | | Log (REER Trade) | 0.76 | 0.00 | | Log (OECD GDP) | 0.99 | 0.00 | | Log (Telecom Subscribers) | 0.91 | 0.00 | | Log (FDI in Services) | 0.79 | 0.00 | | Note: Null Hypothesis states that the series is non-stationary; All variables were de-seasonalised before checking for the presence of unit root. |
| Table 3: Results of the Johansen Cointegration Tests | Specification 1
Series: Log(Services Exports); Log(REER Trade); Log(OECD GDP)# | | Unrestricted Cointegration Rank Test (Trace) | | Hypothesized No. of CE(s) | Eigenvalue | Trace Statistic | 0.05
Critical Value | Prob.** | | None* | 0.24 | 13.45 | 12.32 | 0.03 | | At most 1* | 0.01 | 0.54 | 4.13 | 0.53 | | Unrestricted Cointegration Rank Test (Maximum Eigenvalue) | | Hypothesized No. of CE(s) | Eigenvalue | Max-Eigen Statistic | 0.05
Critical Value | Prob.** | | None* | 0.24 | 12.91 | 11.22 | 0.03 | | At most 1* | 0.01 | 0.54 | 4.13 | 0.53 | Sample period: 2010Q1 to 2022Q4;
Observations: 52. | Specification 2
Series: Log(Services Exports); Log(REER Trade); Log(OECD GDP)# | | Unrestricted Cointegration Rank Test (Trace) | | Hypothesized No. of CE(s) | Eigenvalue | Trace Statistic | 0.05
Critical Value | Prob.** | | None* | 0.25 | 14.85 | 12.32 | 0.02 | | At most 1* | 0.00 | 0.03 | 4.13 | 0.88 | | Unrestricted Cointegration Rank Test (Maximum Eigenvalue) | | Hypothesized No. of CE(s) | Eigenvalue | Max-Eigen Statistic | 0.05
Critical Value | Prob.** | | None* | 0.25 | 14.82 | 11.22 | 0.01 | | At most 1* | 0.00 | 0.03 | 4.13 | 0.88 | Sample period: 2010Q1 to 2022Q4;
Observations: 52. | Specification 3
Series: Log(Services Exports); Log(REER Trade); Log(OECD GDP)#; Log(FDI-Services)# | | Unrestricted Cointegration Rank Test (Trace) | | Hypothesized No. of CE(s) | Eigenvalue | Trace Statistic | 0.05
Critical Value | Prob.** | | None* | 0.29 | 17.30 | 12.32 | 0.01 | | At most 1* | 0.01 | 0.27 | 4.13 | 0.67 | | Unrestricted Cointegration Rank Test (Maximum Eigenvalue) | | Hypothesized No. of CE(s) | Eigenvalue | Max-Eigen Statistic | 0.05
Critical Value | Prob.** | | None* | 0.29 | 17.03 | 11.22 | 0.00 | | At most 1* | 0.01 | 0.27 | 4.13 | 0.67 | *: Denotes rejection of the hypothesis at the 0.05 level; **: Denotes MacKinnon-Haug-Michelis (1999) p-values; #: Variable was used as exogenous variable (long-run only).
Note: Both Trace and Max Eigen value tests indicated the presence of one cointegrating equations at the 0.05 level.
Source: Authors' calculations. |
|