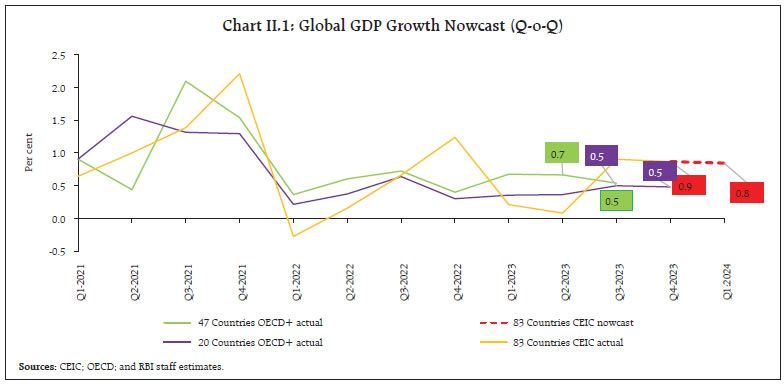
Global growth momentum has been sustained in the first quarter of 2024 and the outlook for global trade is turning positive. Treasury yields and mortgage rates are ticking up in major economies as expectations of interest rate cuts are being pared. In India, conditions are shaping up for an extension of a trend upshift in real GDP growth, backed by strong investment demand and upbeat business and consumer sentiments. CPI inflation has gravitated to 4.9 per cent in March after averaging 5.1 per cent in the preceding two months. In the near term, however, extreme weather events may pose a risk to inflation along with prolonged geo-political tensions that could keep crude oil prices volatile. I. Introduction There is a sizzle in the spring of 2024. Global weather agencies are in agreement that March 2024 was the warmest March since record-keeping began in 1850 – global surface temperature was at 1.6 degrees Celsius (3.01°F) above the 1880-1899 period. More on the weather later, but economic activity also appears to be quickening across the world. After a surge in the last quarter of 2023, global growth momentum has been sustained in the first quarter of 2024; even our nowcast presented in the next section suggests only a mild moderation. Everywhere except for a technical recession in the UK, GDP is being revised above initial releases and official targets. Despite being a touchy issue, immigration is helping to sustain activity in several advanced economies (AEs), capping inflationary pressures and expanding the workforce. April is the month of global forecast updates, and it is no surprise that forecasters of eminence are surprised by the strength of the global economy. Perhaps the outcome for 2024 will defy them, as it did in 2023. As set out in the next section, the outlook for global trade is turning positive, according to the United Nations Conference on Trade and Development (UNCTAD), reversing the contraction seen in 2023 although broader risks from logistics and transport disruptions cannot be underplayed. The World Trade Organisation (WTO) revised down its merchandise trade volume growth for 2024 from its October 2023 forecast but expected demand to rebound as inflationary pressures ease and real household incomes improve. The prospects for trade in commercial services are set to maintain strength as seen in 2023 and offset some of the risk factors associated with the merchandise trade outlook. Central banks continue to speak in understandably cautious tones about growth prospects in 2024 as they deal with the interest rate conundrum, but like Freudian slips, sometimes their actions give away their assessment of the underlying global pulse. Regime shifts are underway in the form of exits from negative interest rates and their unintended consequences. Expectations of interest rate cuts are being pared where they have not yet commenced in recognition of the risk of moving too fast and turning disruptive if inflation moves up again with the lift provided by buoyant economic activity. Switzerland became the first AE to cut interest rates, reflecting a wariness of currency appreciation and an eagerness to join the growth party, given that inflation is well within the tolerance band. Emerging economies, long considered the weakest links in the global economy, have weathered the turbulence of recent years. Markets are starting to reward them for their success as they reform their way to post-pandemic recovery. They include not just the rising powerhouses such as Indonesia and India, but also those which until 2022 were battered by high inflation, debt, fiscal deficits and the fleeing of capital which caused foreign exchange reserves to dwindle and their currencies to wobble. Perhaps it is their strength that is now reinforcing the global economy’s resilience. An increasing number of passive investors are reallocating to emerging market exchange traded funds – the Morgan Stanley Capital International (MSCI) EM ex-China index is outperforming its counterpart sub-indices. The Bloomberg Emerging Market Capital Flow Proxy index is already 150 points above its ten-year average. As capital flows return, bond premia decline and currency discounts diminish in the emerging world, the global economy feels less fragile. In financial markets, treasury yields and mortgage rates are ticking up as markets realise that their bets on cuts are being pushed back in time. Corporates are rushing to issue bonds to take advantage of the highest yields in years and tight spreads, including for junk paper that are at multi-year lows – making hay while the sun shines. Even though some commodity prices – edible oils being a notable exception – have been easing, crude oil prices have firmed up as geopolitical tensions rise and OPEC+ chose to stick with supply cuts for the first half of the year. Although analysts believe that OPEC+ has regained control over the market, fuel demand remained surprisingly resilient which is expected to sustain world oil demand at 2.25 million barrels per day in 2024. This presents another dampener for the easing of monetary policy. Accordingly, the US dollar has surged on the back of safe haven demand. On the charts, its near-term outlook remains positive, with support from 104 for the dollar index (DXY) keeping the upside open. As other currencies struggle to recover from this bounce, the shine is back in gold prices. In 2024, global stock markets have recorded their best first quarter performance in five years, apparently fuelled by the artificial intelligence (AI) boom best exemplified by stocks of chip designer Nvidia, and by growing confidence in economic performance. The MSCI world equity index has already gained close to 10 per cent, outperforming bonds by the biggest margin in any quarter since 2020. The World Meteorological Organisation (WMO) sounded a red alert about global warming in its latest report “State of the Global Climate 2023”, stating that there is a high probability that 2024 will breach the threshold set in 2023 as the hottest year on record even as the world careens towards a freshwater shortage crisis. According to the WMO report, “data from the Indian Meteorological Department (IMD) reflects a worrying escalation in extreme weather events necessitating an urgent and collective response.” Amidst these dire forecasts, there is also hope. According to Australia’s Bureau of Meteorology and the US National Oceanic and Atmosphere Administration, the chances of La Nina - which results in heavy rainfall in India – emerging after June have increased even as El Nino is dissipating. For the longer-term outlook, the evolution of renewable energy has surpassed expectations. According to the International Energy Agency, renewables are poised to account for 90 per cent of global electricity expansion over the next five years while becoming the largest source of global electricity generation by 2025. India has been a leader in this transition, having increased its renewable energy capacity by 250 per cent between 2014 and 2021 in its ambition of achieving 500 gigawatts by 2030. India is redoubling its efforts towards achieving its renewable energy goals so as to decouple emissions from economic growth. Harnessing regional variations in renewable energy production capacity will involve tailoring strategies to suit the specific characteristics and potential of each state. Among a slew of initiatives, the national green hydrogen mission, the production-linked incentive (PLI) scheme for high efficiency solar photovoltaic cell modules and the green energy corridor inter-state transmission system stand out in the transformation of India’s energy sector that is underway. In an influential view, climate change is one of the biggest crises of our time, but it is also the biggest opportunity to change the development paradigm.1 In India, conditions are shaping up for an extension of the trend upshift that took the average real GDP growth above 8 per cent during 2021-24. In order to achieve its developmental aspirations over the next three decades, the Indian economy must grow at a rate of 8-10 per annum over the next decade to reap the demographic dividend that started accruing from 2018 and, as calculations show, will last till 2055. So far, capital deepening is powering the step-up in the growth trajectory, led by sustained public investment, and supported by productivity improvements. More recently, a resurgence of private investment has become visible, according to the Asian Development Bank (ADB), which is shifting its investment strategy to expand space for private capital.2 The conditions are apposite, with the credit quality of Indian corporates having strengthened on the back of deleveraged balance sheets, sustained domestic demand and public capital expenditure – rating upgrades have continued to surpass downgrades.3 Analysis within the India’s KLEMS4 growth accounting framework shows that the contribution of fixed capital stock to the growth of gross value added (GVA) in India has started improving from the low to which it had declined during the pandemic. By 2021-22, its contribution to the growth of GVA had recovered to 32 per cent, although there is still catch-up to attain vis-a-vis pre-pandemic levels. If this is augmented by the quality of the capital stock embodied in its composition, the contribution goes up close to 34 per cent. Total factor productivity (TFP) has become the most important driver of GVA growth in the post-pandemic period after declining during 2018-21. By 2021-22, it accounted for close to 45 per cent of the growth of GVA. TFP growth improved across all the sectors of the economy, with the sharpest enhancement observed in services. For India to harness its favourable demographics and achieve the escape velocity required to breach the low middle income barrier, the developmental strategy over the next few decades must centre around extracting the maximum possible contribution of its young and rising labour force to the growth of GVA. Raising employability – the set of skills that makes a person more likely to gain employment in a chosen occupation to benefit the person, the workforce, the community and the economy – with a focus on the formalisation of employment opportunities for the youth and women should continue to be the hallmark of the strategy. With the working age population set to expand at the rate of about 9.7 million per annum during 2021-31 and 4.2 million per annum during 2031-41, the cutting edge of the growth strategy will be provided by a focus on labour quality. While labour quality has grown slowly in past years, i.e., at the rate of 0.7 per cent per annum between 1980 and 2021, there is growing evidence that the growth rate of aggregate labour quality has improved since 2017-18. The services sector has been driving this improvement, although labour quality in the manufacturing sector has maintained growth after moderating from a spike in 2019-20. In both sectors, it has been supported by increases in wage earnings (viewed as returns on education) in almost every educational category, but especially among those with secondary education and above. Global capability centres (GCCs) are increasingly looking to tap into revenue opportunities embedded in India’s talent pool and are focused on converting this advantage into delivering exceptional values in the form of innovations, high quality services and solutions and data-driven business models on a worldwide scale. Consequently, hiring by GCCs has maintained a positive trend. An important development that favours India’s growth ambitions is the evolution of inflation dynamics in recent prints. Starting in January 2024, the softening of headline inflation is providing a tailwind to growth impulses. As Section III will point out, consumer price index (CPI) inflation has gravitated to 4.9 per cent in March after averaging 5.1 per cent in the preceding two months following the recent peak at 5.7 per cent in December 2023. This trajectory was along anticipated lines, with Q4:2023-24 inflation outcome of 5.0 per cent in alignment with projections. The softening of core (CPI excluding food and fuel) inflation to historic lows in March, driven by moderation across goods and services components, gives credence to the conduct of disinflationary monetary policy. With 4 per cent inflation finally being sighted, there is greater confidence now that the descent of inflation to the target is imminent. Food inflation, despite some signs of moderation, remains elevated and a potential source of risk to the disinflation trajectory. Careful monitoring during the summer is warranted as overlapping food price shocks play out, before an above normal Southwest monsoon this year, as projected by the India Meteorological Department (IMD), enabling an easing of food price pressures. In the near term, however, extreme weather events may pose a risk to inflation along with prolonged geo-political tensions that could keep crude oil prices volatile. Overall, the projection indicates further easing of headline inflation in the coming months before unfavourable base effects kick in during the second half of the year which have to be seen off. While alignment with the inflation target is gradually occurring, incoming data will provide greater clarity and confidence on the disinflation path. On April 1, 2024 the Reserve Bank of India (RBI) commemorated the commencement of its 90th year. It has been an eventful journey from its origins as a private joint stock institution to the modern full service central bank it is today. Several distinguishing aspects of its evolution have already been noted in public discourse. Perhaps two facets deserve mention in this article. The institutional deepening of India’s financial sector owes a lot to the RBI’s developmental role. Besides promoting and facilitating rapid expansion of banking services to every corner of the country, several national-level development financial institutions have been incubated within the RBI as its departments or as subsidiaries in which the RBI has had a major share; nurturing them and eventually spinning them off from the RBI has led to their independent existence. State Finance Corporations (SFCs) were set up to cater to the long-term financial intermediation needs of industry at the state level. The Unit Trust of India (UTI) came into existence in 1964, sponsored by the RBI to provide a channel for retail investors for participating in the capital market. The RBI also established the Credit Guarantee Corporation of India Limited which later became the Deposit Insurance and Credit Guarantee Corporation (DICGC). This institution building role goes on in the form of development of central counterparties for financial markets, financial benchmark setting, bank note printing, IT and cyber security resilience of the banking industry, financial technology and allied services, several institutions for the FinTech sector5, and more recently, an innovation hub. Another area which marks a significant contribution of the RBI is the development and regulation of a spectrum of financial markets. The initial enabling conditions were put in place through inter alia the deregulation of interest rates, phasing out of ad hoc treasury bills as an instrument of automatic monetisation of fiscal deficits, sharp reduction of statutory pre-emptions through reserve requirements, the introduction of auctions for market determined pricing for government securities, the introduction of new market instruments and the establishment of a modern liquidity management framework and toolkit. In the foreign exchange market, the exchange rate regime evolved from a single currency fixed-exchange rate system to a basket of currencies regime and eventually to a market-determined floating exchange rate system. The rupee has been made fully convertible for current account transactions and substantial liberalisation of the capital account has been undertaken as an ongoing process to pave the way for the internationalisation of the rupee. Looking ahead as Governor Shri Shaktikanta Das prophesised, “As we progress towards RBI@100, the upcoming decade is going to be a transformational journey”. Set against this backdrop, the remainder of the article is structured into four sections. Section II covers the rapidly evolving developments in the global economy. An assessment of domestic macroeconomic conditions is set out in Section III. Section IV encapsulates financial conditions in India, while the last Section sets out concluding remarks. II. Global Setting Global growth remains resilient, with easing inflationary pressures and tight employment conditions in spite of geopolitical and extreme weather event risks. The International Monetary Fund (IMF) in its latest world economic outlook (WEO April 2024), raised global growth forecast for 2024 to 3.2 per cent, 10 bps higher than its January 2024 Update and expected the global economy to grow at the same pace in 2025 (Table II.1). For AEs, the growth forecast has been revised up for 2024 by 20 bps to 1.7 per cent due to a significant upward revision in the US growth forecast while for Emerging Market and Developing Economies (EMDEs), the forecast has been revised up by 10 bps to 4.2 per cent. Global headline inflation is expected to fall from an annual average of 6.8 per cent in 2023 to 5.9 per cent in 2024 and further to 4.5 per cent in 2025 (both revised up by 0.1 percentage points from previous projections), with AEs returning to their inflation targets sooner than EMDEs. Our model-based nowcast points to sustained momentum of global growth during Q1:2024, albeit a marginal blip sequentially (Chart II.1). 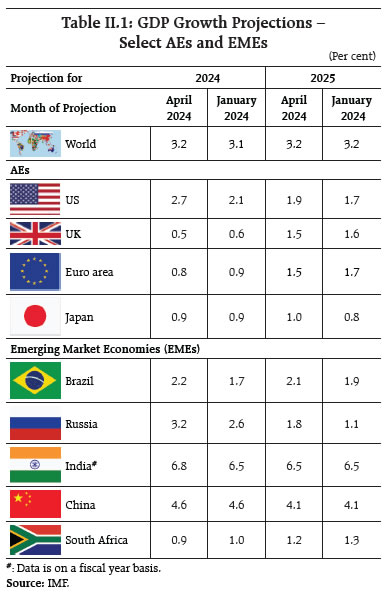
 The global supply chain pressures index (GSCPI) eased below its historical average and the geopolitical risks index dipped in March 2024 (Chart II.2 a and b).6 Container shipping costs have shot up due to ongoing hostilities in the Red Sea and remained elevated in March despite the correction witnessed since February (Chart II.2c).
Consumer sentiments continued to improve across geographies as inflationary pressures receded from year ago highs, supported by broadly stable employment prospects (Chart II.3a). Financial conditions remained accommodative on the back of strong equity market performance (Chart II.3b). The global composite purchasing managers index (PMI) recorded a sequential uptick in March 2024, supported by continued expansion in both services and manufacturing activity (Chart II.4). The services PMI rose to an eight-month high in March, driven by new businesses and gains in exports. The global manufacturing PMI accelerated to its highest reading since July 2022 as new orders, output and employment expanded. 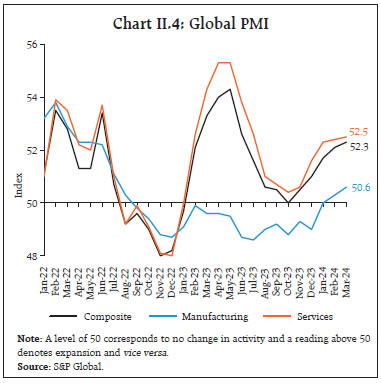 According to the UNCTAD Global Trade Update of March 2024, global trade is expected to gain momentum in 2024 after a decline of 3 per cent in 2023 (Chart II.5a). The fillip to global trade is expected from sustained global growth and increased demand for environmental goods, although geopolitical tensions and shipping disruptions remain major risks. WTO in its Global Trade Outlook and Statistics – April 2024 projected world merchandise trade volume to grow by 2.6 per cent in 2024 and 3.3 per cent in 2025, following a larger-than-expected decline of -1.2 in 2023. Mirroring this outlook, the composite PMI for export orders maintained its uptrend in March (Chart II.5b). The manufacturing component reached a 20-month high; services export orders index has remained in expansionary territory since January 2024. 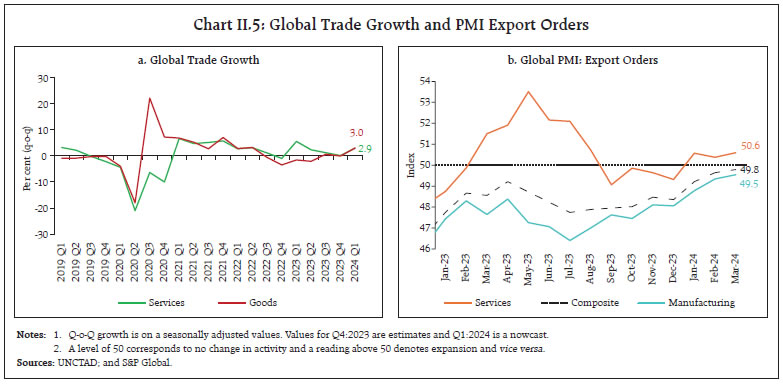 Global commodity prices surged in March, driven by crude oil and metals. Consequently, the Bloomberg commodity price index increased by 2.9 per cent (m-o-m) [Chart II.6a]. The commodity prices continued their ascent in April as crude oil and gold prices shot up further. Brent crude oil prices rose by 2.9 per cent in March amidst flaring tensions in the Middle East and predictions of oil market deficit on account of expected voluntary cuts by OPEC+ members in 2024 (Chart II.6b). The prices went up further in April as market priced in the new geopolitical conflicts in Syria and Israel. The Food and Agriculture Organization’s (FAO’s) food price index rose by 1.1 per cent (m-o-m) in March 2024, the first uptick since July 2023. This was primarily driven by a rise in the prices of vegetable oils (8.0 per cent), partially offset by a fall in sugar prices (-5.4 per cent) [Chart II.6c]. Gold prices soared in March, ending 8.6 per cent higher vis-à-vis February and continued their ascent in April propelled by safe haven demand (Chart II.6d). 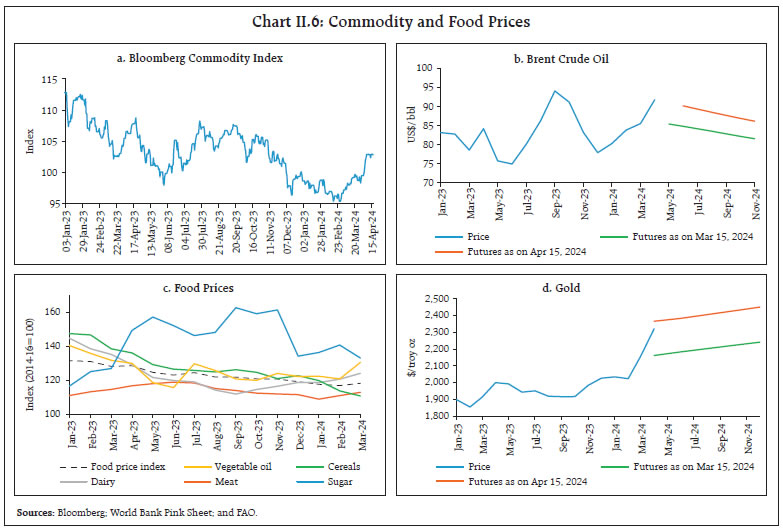 Headline inflation receded significantly from levels recorded a year ago in most economies, although it remained above targets. In the US, CPI inflation rose to 3.5 per cent in March from 3.2 per cent in February, while the headline personal consumption expenditure (PCE) inflation increased to 2.5 per cent in February. Euro area inflation moderated to 2.4 per cent in March from 2.6 per cent in February (Chart II.7a). In the UK, CPI inflation softened to 3.2 per cent in March. Japan’s inflation (CPI excluding fresh food) eased to 2.6 per cent in March from 2.8 per cent in February. Among EMEs, inflation moderated in Brazil, China and South Africa in March (Chart II.7b). Inflation in Russia remained steady for the second consecutive month in March. Core and services inflation also moderated across major AEs but remained higher than headline inflation (Chart II.7c and II.7d). Global equity markets surged in March on robust corporate earnings, optimism over prospects relating to AI, brighter growth prospects in the Euro area, and return of foreign inflows in China. The MSCI world equity index increased by 2.9 per cent in March, reflecting gains in AEs and EMEs to the tune of 3.0 per cent and 2.2 per cent, respectively (Chart II.8a). Equity markets, however, shed these gains in April after the release of higher-than-expected non-farm payroll data, rise in US CPI inflation and escalation of geopolitical tensions. US government security (G-sec) yields – both 10-year and 2-year remained range bound in March but hardened in April amidst rising inflation and the Institute for Supply Management’s (ISM) PMI manufacturing index moving into the expansion zone (Chart II.8b). In the currency markets, the US dollar index strengthened from mid-March on the back of hotter than expected CPI data spurring lower probability of rate cuts by the Fed and continued to appreciate in April. The MSCI currency index for EMEs mirrored the greenback’s movements. EMEs witnessed capital inflows, in early March but the trend reversed in late March and April as dollar strengthened (Chart II.8c and II.8d). 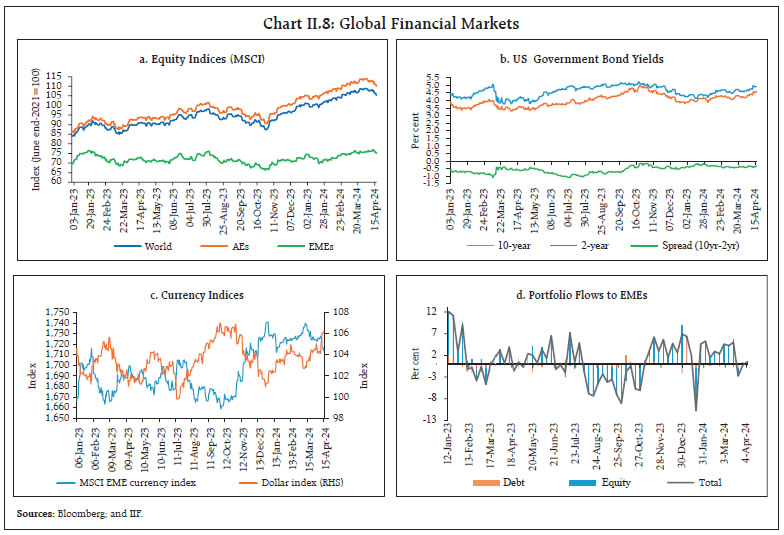
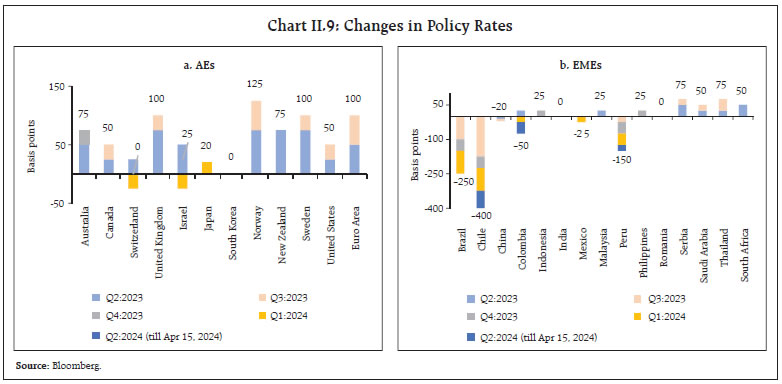 Major central banks, especially in AEs, remained cautious, balancing the risks of cutting too soon against maintaining a restrictive stance for too long and hurting economic activity with financial stability risks. Most AE central banks held their policy rates constant in their latest meetings (Chart II.9a). The Czech Republic and Switzerland lowered their policy rates by 50 bps and 25 bps, respectively. Amongst EME central banks, Chile and Hungary cut their benchmark rates by 75 bps each in their April and March meetings; Brazil and Colombia continued easing with a 50 bps rate cut in March; and Mexico started its easing cycle with a 50 bps rate cut in March (Chart II.9b). Peru continued with its easing cycle cutting the benchmark rate by 25 bps in its April meeting. III. Domestic Developments The Indian economy continued to exhibit resilience amidst external headwinds which led to the build-up of supply chain pressures (Chart III.1a). Consumer confidence strengthened across parameters set out in the RBI’s latest survey of households (Chart III.1b). Enterprise surveys indicate that business assessment and expectations remain in positive terrain, with optimism on production, capacity utilisation (CU), order books, employment and overall business conditions (Annex 1). According to the economic activity index (EAI), economic activity remained resilient in Q4:2023-24, although available data indicate some moderation in March vis-à-vis the previous month on a seasonally adjusted basis (Chart III.1c). Using the EAI, GDP growth for Q4:2023-24 is placed at 7.3 per cent (Chart III.1d) Aggregate Demand High frequency indicators point to sustained momentum in domestic demand conditions in March 2024. E-way bills reached all time high of 10.35 crore (13.9 per cent y-o-y growth) in March 2024 (Chart III.2a). Toll collections increased by 17.2 per cent (y-o-y) in March 2024 (Chart III.2b). Automobile sales increased by 13.8 per cent (y-o-y) in March 2024, led by two wheelers and passenger vehicle sales. While tractor exports recorded robust growth, domestic sales showed some improvement (Chart III.3a and III.3b). Vehicle registrations continued to rise in March 2024, driven by the non-transport vehicles segment (Chart III.3c). Average daily petroleum consumption, however, fell by 0.7 per cent (y-o-y) in March (Chart III.3d).
As per the data from the Centre for Monitoring of Indian Economy (CMIE), the all-India unemployment rate (UR) fell to 7.6 per cent in March, declining across both urban and rural regions (Chart III.4a). The labour force participation rate (LFPR) and employment rate (ER) fell marginally vis-à-vis the previous month (Chart III.4b). The employment outlook in the organised sector, as polled by the PMIs for manufacturing and services, improved in March 2024. While manufacturing employment recorded expansion after two months of contraction, services job creation expanded to a seven-month high (Chart III.5). With the commencement of the rabi harvest, the demand for work under the Mahatma Gandhi National Rural Employment Guarantee Scheme (MGNREGS) tapered off on a sequential basis, indicative of expansion in job opportunities in the rural farm market (Chart III.6a). With effect from April 01, 2024 the daily wages under the MGNREGS have been increased between 3 per cent to 10.6 per cent (₹7 - ₹34/day) across states (Chart III.6b). India’s merchandise exports at US$ 41.7 billion in March 2024 were at their highest in any month in 2023-24. A positive momentum of about 1.0 per cent notwithstanding, exports declined by 0.7 per cent on a y-o-y basis, due to unfavourable base effect (Chart III.7). Sequentially, while petroleum exports contracted by more than a third, non-POL exports expanded. On a y-o-y basis, out of 30 major export commodities, 13 commodities accounting for a share of 35.8 per cent in the export basket7 registered contraction in March. Petroleum products, marine products, gems and jewellery, oil meals and iron ore dragged exports down, whereas engineering goods, organic and inorganic chemicals, electronic goods, drugs and pharmaceuticals and spices supported export growth (Chart III.8).
Merchandise imports at US$ 57.3 billion declined by 6.0 per cent (y-o-y) due to both negative momentum and an unfavourable base effect in March 2024 (Chart III.9). Among 30 major import commodities, 18 commodities accounting for 67 per cent share in the import basket registered contraction on y-o-y basis in March. Gold, petroleum, crude and products, and precious and semi-precious stones dragged import down, while silver, pulses and electronic goods supported growth (Chart III.10).
The merchandise trade deficit was at an 11-month low of US$ 15.6 billion in March 2024, due to the sharp contraction in imports. The non-oil deficit narrowed to US$ 3.8 billion in March 2024 from US$ 10.1 billion in February. In contrast, the oil deficit widened to US$ 11.8 billion in March from US$ 8.7 billion a month ago. Concomitantly, the share of the oil deficit in the total merchandise trade deficit rose to 75.9 per cent (Chart III.11).
During 2023-24, India’s merchandise exports at US$ 437.1 billion contracted by 3.1 per cent (y-o-y), while merchandise imports declined by 5.4 per cent to US$ 677.2 billion. The merchandise trade deficit narrowed to US$ 240.2 billion in 2023-24 as compared with US$ 264.9 billion a year ago. Petroleum products were the largest source of the deficit, followed by electronic goods (Chart III.12).
In February 2024, services exports rose by 3.5 per cent (y-o-y) to US$ 28.3 billion, primarily driven by growth in software, business services, travel and transportation. Services imports at US$ 15.2 billion registered a growth of 1.8 per cent (y-o-y), mainly due to a rise in business, software, travel and transport imports (Chart III.13). Consequently, net services exports earnings grew by 5.5 per cent (y-o-y) to US$ 13.1 billion in February 2024. As per the latest data released by the Controller General of Accounts (CGA), the gross fiscal deficit (GFD) of the Union government stood at 86.5 per cent of the revised estimates (RE) during April-February 2023-24. On the expenditure side, capital spending recorded an increase of 36.5 per cent (y-o-y) while revenue expenditure growth remained contained at 1.3 per cent (y-o-y) [Chart III.14a]. Capital outlay (i.e., capital expenditure excluding loans and advances) recorded an increase of 32.8 per cent, resulting in a marked improvement in the quality of spending of the central government (Chart III.14b). 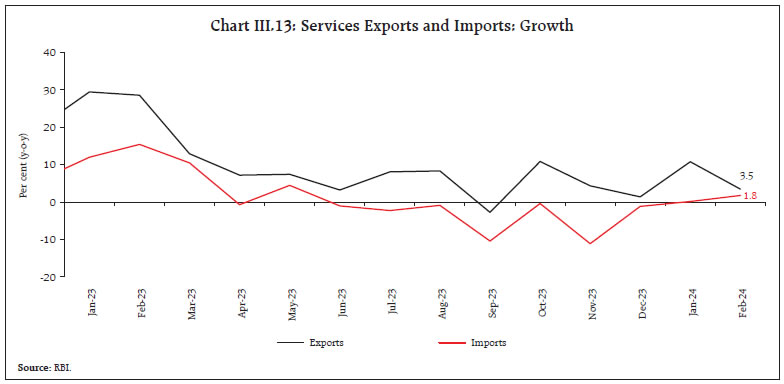
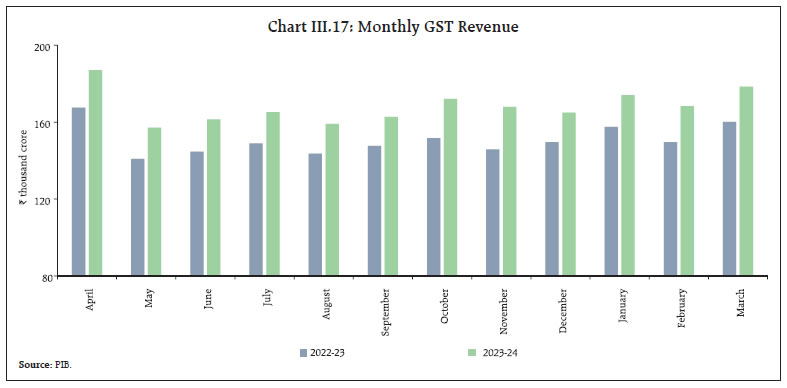
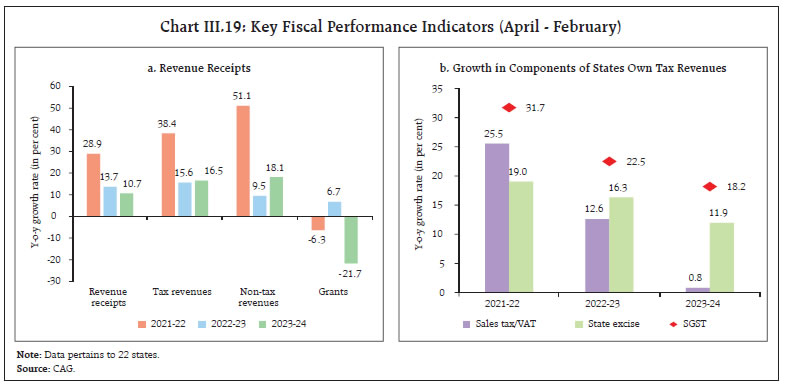
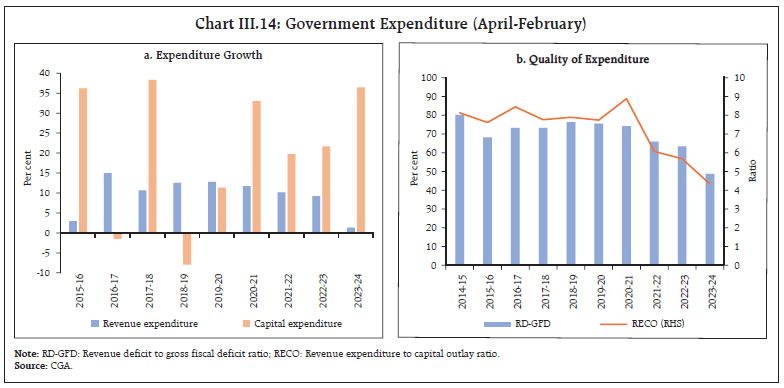 On the receipts side, direct tax collections grew by 21.6 per cent (y-o-y) during April-February 2023-24, with income tax and corporate tax collections growing at 25.8 per cent and 17.3 per cent, respectively. The robust double digit growth in direct tax collections is attributable to increased compliance, higher advance tax collections and widening of the tax base.8,9,10 Indirect tax collections grew by 4.8 per cent (y-o-y), with goods and services taxes (GST) and customs revenues recording a growth of 8.4 per cent and 3.9 per cent, respectively. On the other hand, excise duties registered a contraction of 5.8 per cent. Overall, gross tax revenue grew by 13.4 per cent over the corresponding period of the previous year, led by growth in direct tax collections (Chart III.15). Non-tax revenue collections grew by 44.9 per cent (y-o-y) during April-February 2023-24, largely due to the higher than budgeted surplus transfer from the RBI11 and dividends from public sector enterprises (Chart III.16). On the other hand, non-debt capital receipts contracted by 38.6 per cent (y-o-y). Total receipts (comprising of revenue receipts and non-debt capital receipts) of the Union government expanded by 10.1 per cent (y-o-y). GST collections (Centre plus States) at ₹1.78 lakh crore in March 2024, recorded the second highest monthly amount since its inception in 2017. The gross GST collection during 2023-24 was 11.6 per cent higher than in 2022-23 (Chart III.17). As per the data available for April-February 2024, States’ combined GFD reached 65.9 per cent of budget estimates (BE), 6.1 percentage points higher than in the corresponding period of the previous year (Chart III.18a). This increase was primarily driven by a slowdown in the growth of revenue receipts and an increase in capital expenditure (Chart III.18b). On the receipts front, States’ overall tax revenue increased due to higher devolution, while own tax revenue growth decelerated. Non-tax revenues recorded a sharp rise, mainly driven by land monetisation and mining royalty/premiums in certain States. Grants from the Union government contracted on account of cessation of GST compensation and the tapering of finance commission grants (Chart III.19a). Within States’ own tax revenue, growth in SGST, sales tax/VAT and state excise moderated y-o-y (Chart III.19b). 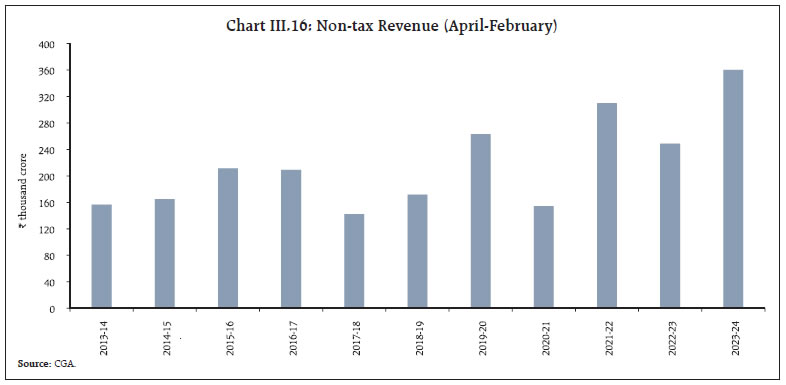
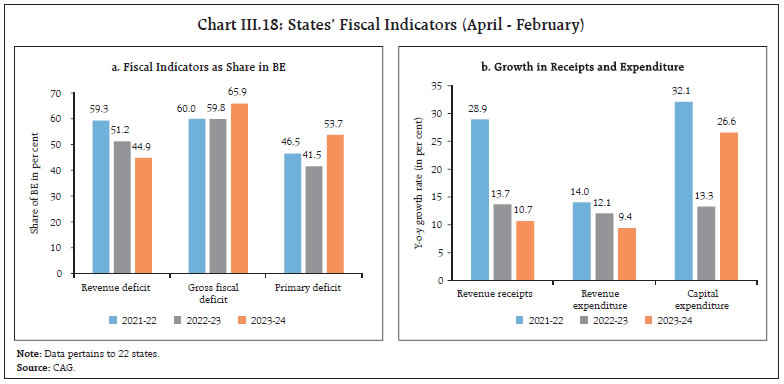
 States’ thrust on capital spending continued, with a 26.6 per cent growth in capital expenditure. This was aided by the Scheme for Special Assistance to States for Capital Investment under which ₹95,225.77 crore has already been disbursed by the Union government till February 2024.12 Aggregate Supply Agricultural prospects are expected to receive a boost amidst the IMD’s forecast of an above normal monsoon - the rainfall during Southwest monsoon season during June-September 2024, is most likely to be above normal this year at 106 per cent of the long period average (LPA) with a model error of ±5 per cent. The likely transition towards La Nina, positive Indian Ocean Dipole and below-normal snow cover over the northern hemisphere would generally be favourable for the monsoon. This augurs well for replenishment of the water level in 150 major reservoirs of the country which is down to 31 per cent of total capacity as on April 18, 2024 (Chart III.20). Water available in these reservoirs was 17.0 per cent lower than last year and 3.6 per cent below the decadal average. Higher than normal maximum temperatures, however, are likely over most parts of the country for the hot weather season (April to June 2024) [Chart III.21]. Above normal heatwave days are likely to occur over most parts of the south peninsula, central India, east India, and plains of northwest India. Unlike the heatwave episode of 2022 that began in March, the heatwaves in 2024 are likely to occur from April by when the harvesting of majority of the key rabi crops (viz., wheat, rapeseed, mustard and chana) is expected to be complete.
As of April 19, 2024, 64.5 lakh hectares (preliminary estimates) of the summer crop area13 have been sown so far, registering an increase of 8.2 per cent over a year ago. Higher acreage has been achieved under rice (8.7 per cent), pulses (9.1 per cent), coarse cereals (8.7 per cent) and oilseeds (4.9 per cent) [Chart III.22]. After interventions in the wheat market through open market sales (OMS) to curb inflationary pressures, government procurement for the rabi marketing season (RMS) of 2024-25 has commenced earlier in 2024 (the usual date is April 01) in order to replenish declining stocks. The target for the season is set at 300-320 lakh tonnes14; as of April 19, 2024, the cumulative procurement stood at 7.1 million tonnes. The cumulative procurement of rice in the kharif marketing season (KMS) so far (October 01, 2023 – April 19, 2024) stood at 462.9 lakh tonnes, 6.8 per cent lower than in the corresponding period of the previous season. As of April 1, 2024 the public stock of rice stood at 531.5 lakh tonnes (3.9 times the buffer norms). The headline PMI for the manufacturing sector reached a 16-year high of 59.1 in March 2024, backed by new orders and output (Chart III.23a). The PMI for services rose to 61.2 in March (one of the strongest in 13 years), driven by solid expansion in new business and employment (Chart III.23b). Indicators of freight transport exhibited a mixed picture. Railway freight revenue recorded a growth of 6.3 per cent (y-o-y) in February 2024, contributed by growth in freight movement of cement (Chart III.24a). Cargo traffic at major ports rose by 3.6 per cent in March 2024 driven by POL (Chart III.24b).
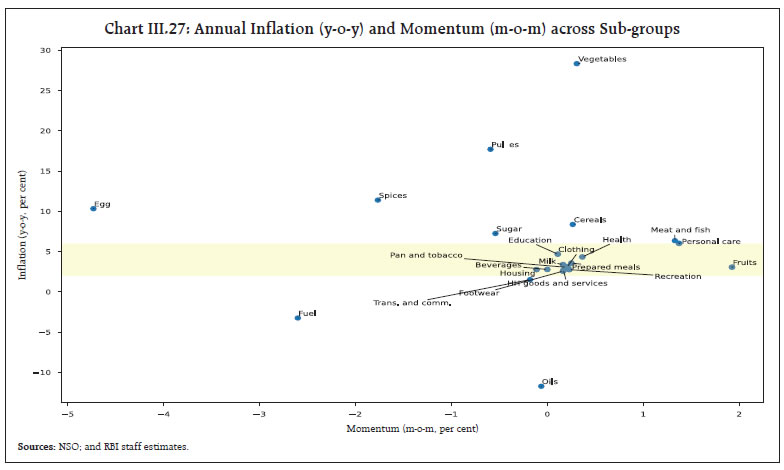
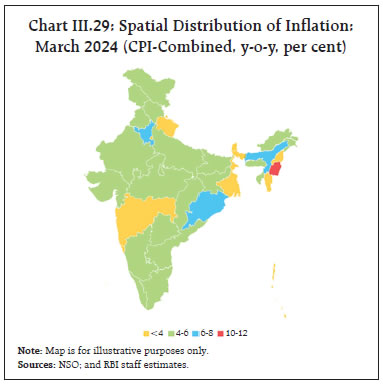
Construction sector indicators reflected sustained growth in steel consumption and cement production (Chart III.25) Available high frequency indicators for the services sector exhibited an optimistic picture in March 2024 (Table III.1). Inflation Headline inflation, as measured by y-o-y changes in the all-India CPI15, moderated to 4.9 per cent in March 2024 from 5.1 per cent in February 2024 (Chart III.26). In terms of index levels, food and core (excluding food and fuel) groups registered a m-o-m increase of around 0.2 per cent each which was offset by a m-o-m decline in fuel prices by (-) 2.6 per cent. Food inflation moderated to 7.7 per cent in March 2024 from 7.8 per cent in February as a positive price momentum of 16 bps was more than offset by a favourable base effect of 23 bps. In terms of sub-groups, notable declines in inflation was observed in respect of fruits, vegetables, pulses, and spices (Chart III.27). Inflation in cereals, meat and fish prices increased while the rate of deflation in oils and fats narrowed. Deflation in prices of fuel and light group deepened to (-) 3.2 per cent in March from (-) 0.8 per cent in February, reflecting the LPG price cut in March which translated to a y-o-y price decline of (-) 22.3 per cent. Kerosene prices also registered a decline of (-) 2.8 per cent (y-o-y). Core inflation eased further to 3.3 per cent in March from 3.4 per cent in February, the lowest in the current CPI (2012=100) series. The moderation was broad-based, with inflation softening across various sub-groups barring personal care and effects, and recreation and amusement (Chart III.28). The softening in transport and communications inflation reflected largely the impact of the cut in petrol and diesel prices in mid-March. Inflation in personal care and effects edged up due to a pick-up in gold prices. In terms of regional distribution, while CPI-rural inflation increased by around 10 bps to 5.4 per cent in March, CPI-urban inflation moderated by 64 bps to 4.1 per cent. Most of the states continued to record inflation in the range of 4-6 per cent (Chart III.29). 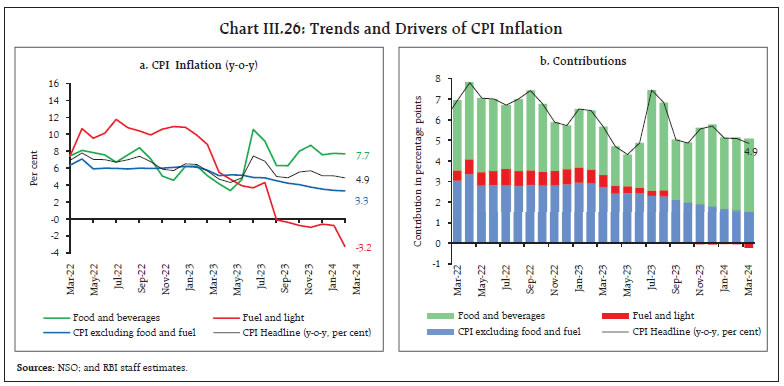
 High frequency food price data for April so far (up to 19th) show that while cereal prices registered a modest decline, pulses prices continued to edge up. Edible oil prices, which were on a declining trajectory since December 2022, witnessed a broad-based pick-up in prices in April. Among key vegetables, while tomato and potato prices displayed an uptick in April, onion prices corrected further (Chart III.30). In order to keep onion prices under check, the Government has directed the National Cooperative Consumers’ Federation of India Ltd. (NCCF) and National Agricultural Cooperative Marketing Federation of India Ltd. (NAFED) to initiate procurement of 5 lakh tonnes of onion for buffer building directly from the farmers as rabi harvest started arriving in the market. 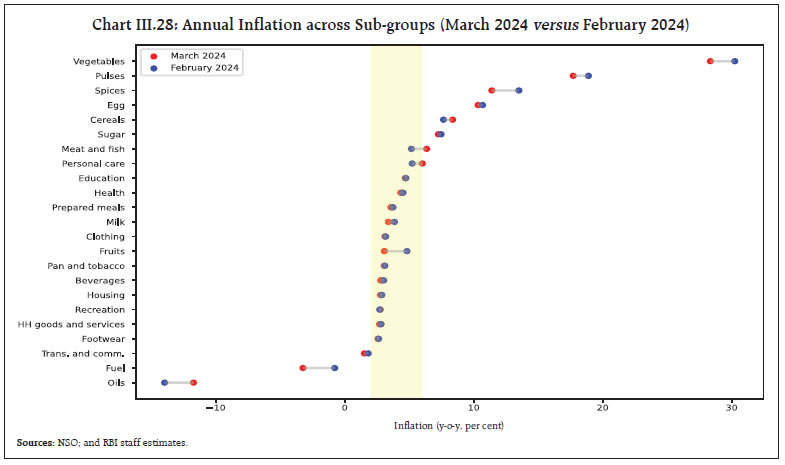
 Domestic prices of edible oils were easing since December 2022 in line with moderation in international edible oil prices (Chart III.31). The sharp rise in international prices in March 2024 across all major edible oils has, however, led to an uptick in import prices. Risks also remain from the potential rise in local consumption of edible oils due to implementation of biodiesel mandates by major exporters (e.g., Indonesia) which would constrain their exports and have implications for global prices.
Retail selling prices of petrol and diesel were reduced by ₹2 per litre each from March 15, 2024. Kerosene price, however, registered a modest increase in March. In April so far (up to 19th April), while kerosene prices declined marginally, other petroleum product prices remained unchanged (Table III.2). | Table III.2: Petroleum Products Prices | | Item | Unit | Domestic Prices | Month-over-month (per cent) | | Feb-24 | Mar-24 | Apr-24^ | Mar-24 | Apr-24^ | | Petrol | ₹/litre | 102.92 | 100.91* | 100.91 | -2.0 | 0.0 | | Diesel | ₹/litre | 92.72 | 90.72* | 90.72 | -2.2 | 0.0 | | Kerosene (subsidised) | ₹/litre | 49.43 | 49.79 | 49.57 | 0.7 | -0.44 | | LPG (non-subsidised) | ₹/cylinder | 913.25 | 813.25** | 813.25 | -10.9 | 0.0 | ^: For the period April 1-19, 2024. *: Effective from March 15, 2024
**: Effective from March 9, 2024
Note: Other than kerosene, prices represent the average Indian Oil Corporation Limited (IOCL) prices in four major metros (Delhi, Kol-kata, Mumbai and Chennai). For kerosene, prices denote the av-erage of the subsidised prices in Kolkata, Mumbai and Chennai.
Sources: IOCL; Petroleum Planning and Analysis Cell (PPAC); and RBI staff estimates. | The PMIs for March 2024 indicated an uptick in input costs across manufacturing and service firms. Selling price increases for manufacturing firms slowed down in March, whereas price increases across services firms were at their fastest pace in six-and-a half years (Chart III.32). In the latest bi-monthly round of the RBI’s inflation survey, inflation expectations of households eased by 20 bps each for 3-month and one-year ahead horizons (Chart III.33).
IV. Financial Conditions Liquidity conditions eased in March, with net liquidity adjustment facility (LAF) [including marginal standing facility (MSF)] injection narrowing to ₹0.29 lakh crore from ₹1.78 lakh crore in February 2024. Increased government spending and the RBI’s market operation smoothed system liquidity. While the buildup of government cash balances on account of GST collections and advance tax payments tightened liquidity intermittently, liquidity conditions turned into surplus towards March-end and early April in response to the increase in government spending. On a net basis, average absorption under the LAF amounted to ₹1.07 lakh crore during April 2024 (up to April 19) [Chart IV.1]. Anticipating the seasonal tightening of liquidity at end-March, the Reserve Bank injected liquidity through variable rate repo (VRR) main and fine-tuning operations. Overall, the Reserve Bank injected ₹4.16 lakh crore cumulatively into the banking system during March 16 - April 19, 2024. As a special case, standalone primary dealers (SPDs) were also allowed to participate in the 6-day VRR auction of ₹75,000 crore conducted on March 27, 2024 along with other eligible participants. In April, the Reserve Bank conducted one main variable rate reverse repo (VRRR) of 14 days maturity and seven fine-tuning VRRR auctions of overnight to three days maturity (up to April 19), cumulatively mopping up ₹2.29 lakh crore. As noted in an earlier edition of this article, banks have preferred to place funds under the overnight standing deposit facility (SDF) instead of long tenor VRRRs. Reflecting reluctance of banks to park surplus funds in longer tenors, the 14-day VRRR auction conducted on April 5, 2024 elicited a lukewarm response (offers received of ₹0.05 lakh crore as against the notified amount of ₹1.25 lakh crore). Of the average total absorption at ₹1.29 lakh crore during the second fortnight of March through April 19, 2024, placement of funds under the SDF constituted 90 per cent (₹1.16 lakh crore), while the remaining was absorbed through VRRR operations. 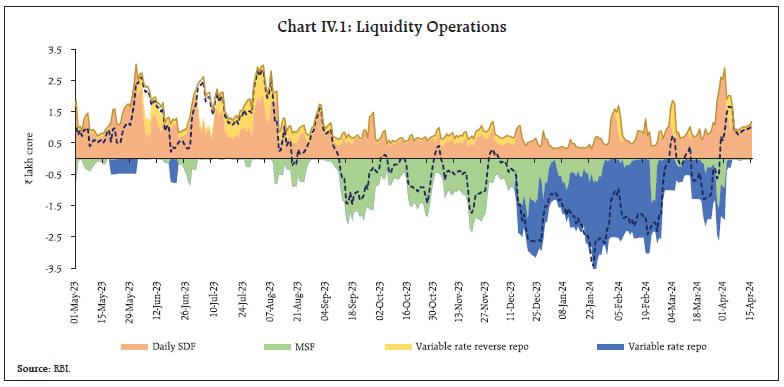
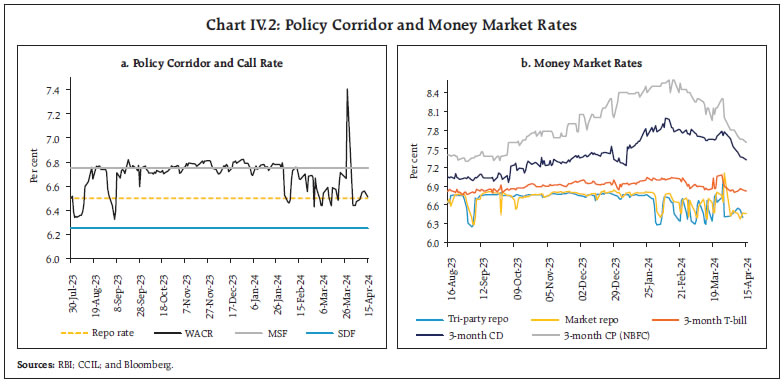 Reflecting these liquidity developments, the weighted average call rate (WACR) – the operating target of monetary policy – has remained within the policy corridor since the February policy meeting, barring the usual year-end spike. The WACR averaged 6.58 per cent during March 16 - April 19, 2024 as against 6.57 per cent during February 16-March 15, 2024 (Chart IV.2a). Rates in the collateralised segment – the triparty and market repo rates – moved in tandem with the WACR (Chart IV.2b). Across the term money market segment, yields on 3-month treasury bills (T-bills), certificates of deposit (CDs) and commercial papers (CPs) for non-banking financial companies (NBFCs) eased towards end-March and early April (Chart IV.2b). The average risk premia in the money market (3-month CP minus 91-day T-bill) reduced to 98 bps during March 16 - April 19, 2024 from 141 bps during February 16 - March 15, 2024. While short-term rates moved in tandem with the evolving liquidity developments, long-term rates remained largely stable. In the primary market, resource mobilisation through CD issuances surged to ₹8.58 lakh crore during 2023-24, from ₹6.74 lakh crore a year ago, as deposit growth trailed credit growth. CP issuances remained largely steady at ₹13.75 lakh crore during 2023-24 (₹13.73 lakh crore in the previous year). The yield on the Indian benchmark 10-year G-sec increased to 7.23 per cent on April 19, 2024 from 7.06 per cent on March 15, taking cues from the rise in US treasury yields (Chart IV.3a). The yield curve shifted upwards but remained relatively flat across the mid-to-long end of the term structure of maturities (Chart IV.3b). Corporate bond yields generally softened and risk premia narrowed during March 16 to April 19, 2024. The average risk premia in the bond market (the spread of AAA-rated 3-year corporate bond over 3-year G-sec yields) eased to 68 bps from 79 bps during February 16 - March 15, 2024 (Table IV.1). Funds mobilised through corporate bond issuances during 2023-24 (up to February) were higher at ₹7.4 lakh crore as compared to ₹6.7 lakh crore during the same period last year. Financial conditions remained conducive, as reflected in reduced term spread in the G-sec and bond market. | Table IV.1: Financial Markets - Rates and Spread | | Instrument | Interest Rates (per cent) | Spread (bps) (Over Corresponding Risk-free Rate) | | Feb 16, 2024 – Mar 15, 2024 | Mar 16, 2024 – Apr 19, 2024 | Variation | Feb 16, 2024 – Mar 15, 2024 | Mar 16, 2024 – Apr 19, 2024 | Variation | | 1 | 2 | 3 | (4 = 3-2) | 5 | 6 | (7 = 6-5) | | Corporate Bonds | | | | | | | | (i) AAA (1-year) | 8.01 | 7.86 | -15 | 79 | 70 | -9 | | (ii) AAA (3-year) | 7.96 | 7.89 | -7 | 79 | 68 | -11 | | (iii) AAA (5-year) | 7.81 | 7.79 | -2 | 63 | 55 | -8 | | (iv) AA (3-year) | 8.54 | 8.48 | -6 | 138 | 126 | -12 | | (v) BBB- (3-year) | 12.19 | 12.09 | -10 | 502 | 487 | -15 | Note: Yields and spreads are computed as averages for the respective periods.
Sources: FIMMDA; and Bloomberg. | Reserve money (RM), excluding the first-round impact of changes in the cash reserve ratio (CRR) recorded a growth of 6.3 per cent (y-o-y) as on April 12, 2024 (7.5 per cent a year ago) [Chart IV.4]. Growth in currency in circulation (CiC), the largest component of RM, decelerated to 3.8 per cent from 7.4 per cent a year ago, reflecting the withdrawal of ₹2000 banknotes16 – 97.7 per cent has been returned to the banking system, mostly in the form of deposits (as on March 29, 2024). Money supply (M3) rose by 11.4 per cent (y-o-y) as on April 5, 2024 (10.0 per cent a year ago).17 Aggregate deposits with banks, the largest component of M3, increased by 12.6 per cent (9.8 per cent a year ago). Scheduled commercial banks’ (SCBs’) credit growth stood at 16.1 per cent as on April 5, 2024 (15.8 per cent a year ago) [Chart IV.5].
SCBs’ deposit growth (excluding the impact of the merger) remained in double digits in March 2024 (Chart IV.6). As on March 22, 2024, the system level incremental credit-deposit ratio stood at 95.9 per cent (Chart IV.7). With the statutory requirements for CRR and Statutory Liquidity Ratio (SLR) at 4.5 per cent and 18 per cent, respectively, around 77 per cent of deposits were available with the banking system for funding credit expansion as on March 31, 2024. The deposit base was supplemented by CD issuances (Chart IV.8). 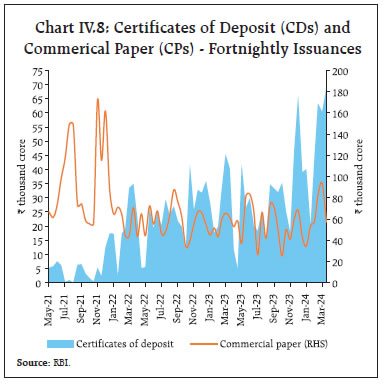
| Table IV.2: Transmission to Banks’ Deposit and Lending Rates | | (Variation in bps) | | Period | Repo Rate (bps) | Term Deposit Rates | Lending Rates | | WADTDR - Fresh Deposits | WADTDR- Outstanding Deposits | EBLR | 1-Yr. MCLR (Median) | WALR- Fresh Rupee Loans | WALR- Outstanding Rupee Loans | | Easing Period | | | | | | | | | Feb 2019 to Mar 2022 | -250 | -259 | -188 | -250 | -155 | -232 | -150 | | Tightening Period | | | | | | | | | May 2022 to Feb 2024 | +250 | 241 | 183 | 250* | 167* | 185 | 111 | Notes: Data on EBLR pertain to 32 domestic banks.
*: Data on EBLR and MCLR pertain to March 2024.
WALR: Weighted Average Lending Rate. WADTDR: Weighted Average Domestic Term Deposit Rate; MCLR: Marginal Cost of Funds-based Lending Rate; EBLR: External Benchmark based Lending Rate.
Source: RBI. | In response to the 250 bps increase in policy repo rate, the external benchmark-based lending rate (EBLR) increased by a similar magnitude. Concomitantly, the weighted average lending rate (WALR) on fresh and outstanding rupee loans increased by 185 bps and 111 bps, respectively, during May 2022 to February 2024. In case of deposits, the weighted average domestic term deposit rates (WADTR) on fresh and outstanding deposits increased by 241 bps and 183 bps, respectively, during the same period (Table IV.2). The 1-year median marginal cost of funds-based lending rate (MCLR) increased by 167 bps, during May 2022 to March 2024. Transmission across bank groups indicates that the increase in the deposit and lending rates was higher in the case of public sector banks (PSBs), except for outstanding loans, during May 2022 to February 2024 (Chart IV.9). The lending rates of PSBs continued to remain lower than those of private banks while their deposit rates were higher. On March 08, 2024 the Government of India kept interest rates on small savings schemes unchanged for Q1:2024-25. Based on the moderation in G-Sec yields of comparable maturity, the announced rates are now aligned to the formula-based rates. However, they remained lower for public provident funds and 5-year recurring deposit accounts.18 Domestic equity markets declined initially during the second half of March amidst caution ahead of the Fed’s monetary policy decision but recovered subsequently following dovish signals from the US Fed. Equity markets witnessed stellar gains in 2023-24 across sectors, with realty and PSU indices registering the maximum gains (Chart IV.10). Markets started the new financial year on a positive note and scaled fresh highs amidst strong domestic and global macroeconomic readings along with optimism over the corporate earnings season. However, markets declined thereafter, tracking negative global cues following higher-than-expected inflation figures in the US and escalation of geopolitical tensions in the Middle East. Overall, the BSE Sensex increased by 0.6 per cent since March 15, 2024 to close at 73,088 on April 19, 2024. 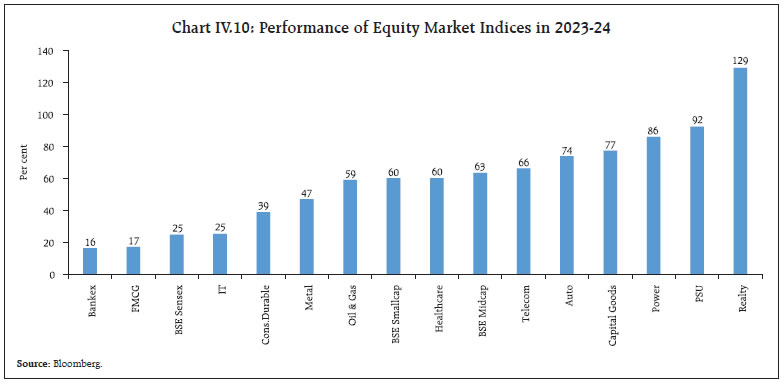 India has been a late adopter of real estate investment trusts (REITs) and infrastructure investment trusts (InvITs); however, the market is flourishing - REITs and InvITs have mobilised ₹1.3 lakh crore since 2019-20 (up to March 2024) [Chart IV.11]. March witnessed the listing of an InvIT, which raised ₹2,500 crore through a public issue, attracting substantial interest from foreign investors.19 The SEBI has progressively reduced the minimum investment size and trading lot, enabling greater retail participation in these hybrid instruments. To further develop this space, the market regulator notified regulations for small and medium REITs20 on March 8, 2024. This is expected to facilitate pooled investment in a wider range of real estate assets as a regulated financial product, thereby facilitating further growth of REITs in India. India has introduced a beta version of the T+0 rolling settlement cycle on an optional basis, in addition to the existing T+1 settlement cycle in equity cash markets for a limited set of scrips effective from March 28, 2024.21 This marks a landmark in the progress of settlement and clearing timelines relative to global financial markets, showcasing India’s Market Infrastructure Institutions’ (MIIs) global leadership in the digital ecosystem. Investment in the equity segment by mutual funds (MFs) witnessed a new record in March 2024 on the back of consistent net inflows in equity-oriented MF schemes22, especially in the smallcap and midcap schemes in the recent period (Chart IV.12). Stress tests of the liquidity profile of the portfolios of these schemes suggest that midcap schemes are relatively better placed than smallcap schemes to meet sudden redemption pressures.23 Gross inward foreign direct investment (FDI) stood at US$ 65.0 billion during April-February 2023-24 compared to US$ 66.8 billion in the corresponding period a year ago (Chart IV.13a). More than 60 per cent of the FDI equity flows were directed towards manufacturing, computer services, electricity and other energy, retail and wholesale trade, and financial services. The major source countries were Singapore, Mauritius, the US, the Netherlands, Japan and the UAE, accounting for around 80 per cent of the flows. Net FDI stood at US$ 14.6 billion during April-February 2023-24 compared to US$ 26.7 billion a year ago, primarily due to an increase in repatriation. 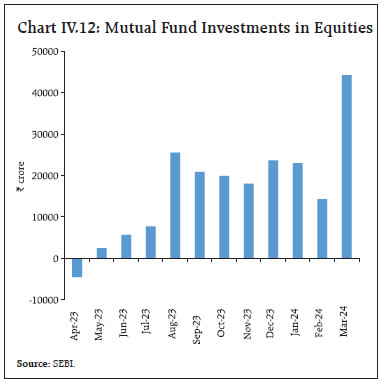 A recent UNCTAD report estimated a modest rise in global FDI flows in 2023 over 2022, driven by two European countries24; however, excluding these countries, global FDI flows declined by about 18 per cent in 2023. Amidst an uncertain global investment environment, India held its position as a favourable investment destination among peer Asian economies in 2023 (Chart IV.13b). India ranked fourth among EMEs in the 2024 FDI Confidence Index25, reflecting continued optimism over its growth potential. Additionally, India has signed a Trade and Economic Partnership Agreement (TEPA) with the European Free Trade Association (EFTA), which includes investment commitments.26 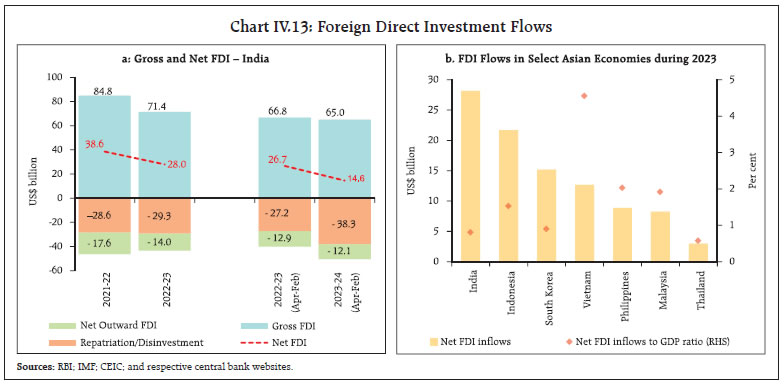
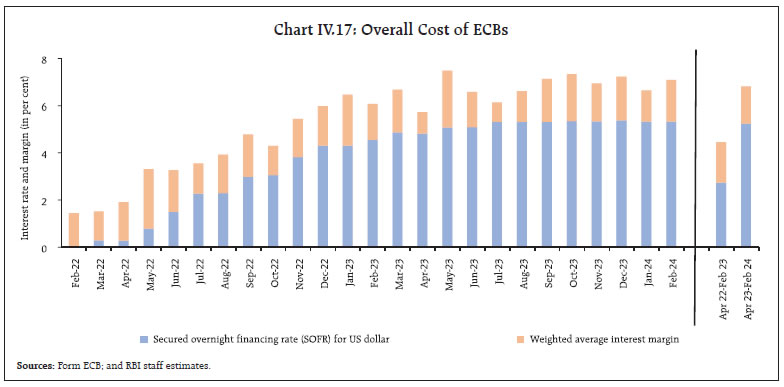
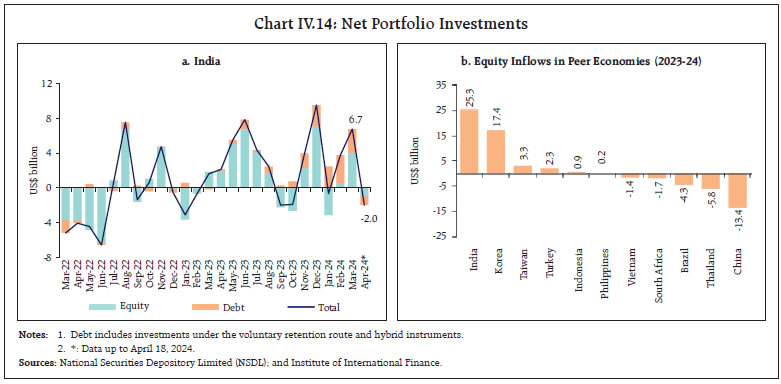 Foreign portfolio investment (FPI) flows to India remained positive in March 2024. Net FPI inflows were to the tune of US$ 6.7 billion in March 2024, with inflows in both equity (US$ 4.0 billion) and debt (US$ 2.7 billion) segments (Chart IV.14a). Cumulatively, net FPI inflows at US$ 41.6 billion in 2023-24 were the highest since 2015-16. The debt segment recorded net inflows of US$ 16.4 billion during 2023-24, the highest since 2018-19, while net FPI inflows in the equity segment were to the tune of US$ 25.3 billion, the highest among emerging market peers (Chart IV.14b). Financial services, automobile and auto components, healthcare, and capital goods were the major sectors attracting equity inflows during 2023-24. In April 2024 (up to April 18), net FPI outflows were recorded to the tune of US$ 2.0 billion. Net accretions to non-resident deposits at US$ 11.8 billion during April - February 2023-24 were higher than US$ 6.4 billion a year ago, mainly led by an increase in net accretions to Foreign Currency Non-Resident [FCNR(B)] accounts and Non-Resident (External) Rupee Accounts [NR(E)A]. During Q4:2023-24 so far (up to February), external commercial borrowing (ECB) registrations amounted to US$ 5.4 billion and net ECBs turned positive after two successive quarters of negative flows. On a cumulative basis, ECB registrations (US$ 41.5 billion) and gross disbursements (US$ 32.2 billion) during the first eleven months of 2023-24 were higher than the corresponding period of the previous year. On a net basis, ECB inflows stood at US$ 8.8 billion as compared with net outflows of US$ 1.5 billion in the corresponding period last year (Chart IV.15). Of the total ECBs registered during April 2023 - February 2024, nearly 80 per cent were related to capital expenditure (including on-lending and sub-lending) [Chart IV.16]. Global benchmark rates such as the secured overnight financing rate (SOFR) have stabilised, albeit at elevated levels. The monthly weighted average interest margins (WAIM) over the benchmark rates, however, have moved in a wider range of 0.83-1.98 per cent since July 2023 relative to the benchmark rates (Chart IV.17). India’s net international investment position improved by US$ 12.2 billion to US$ (-) 370.4 billion during October-December 2023 on the back of a rise in Indian residents’ overseas financial assets (Chart IV.18). As a result, the ratio of India’s international financial assets to international financial liabilities improved to 72.4 per cent in December 2023 from 70.9 per cent a quarter ago. Reserve assets recorded a significant rise (US$ 34.8 billion) during Q3:2023-24 and accounted for 63.9 per cent of India’s international assets in December 2023. 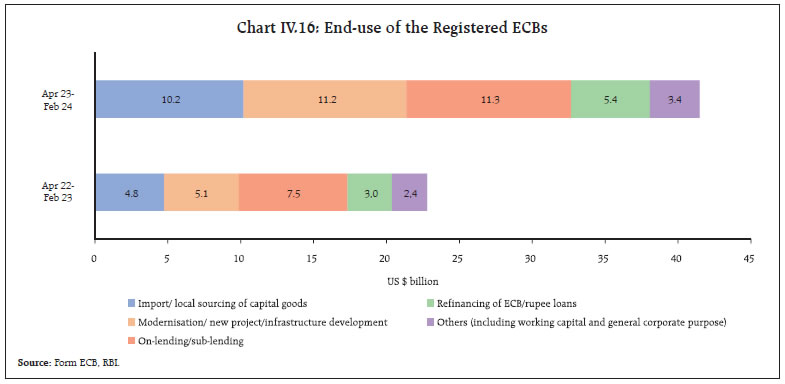
 India’s foreign exchange reserves reached an all-time high of US$ 648.6 billion on April 5, 2024. As on April 12, 2024, India’s foreign exchange reserves stood at US$ 643.2 billion, sufficient to cover for 99 per cent of total external debt outstanding at end-December 2023. (Chart IV.19a). India’s foreign exchange reserves increased by US$ 68.0 billion during 2023-24, the second highest increase among major foreign exchange reserves holding countries (Chart IV.19b).
The Indian rupee (INR) depreciated marginally by 0.04 per cent (m-o-m) vis-à-vis the US dollar in March 2024 while remaining one of the least volatile major currencies (Chart IV.20). The INR depreciated by 0.3 per cent (m-o-m) in terms of the 40-currency real effective exchange rate (REER) as negative relative price differentials more than offset the appreciation of the INR in nominal effective terms in March 2024 (Chart IV.21). India’s current account deficit (CAD) improved to 1.2 per cent of GDP in Q3:2023-24 from 1.3 per cent in Q2:2023-24 and 2.0 per cent in Q3:2022-23. Robust services exports and strong remittance receipts eased merchandise import pressures on the current account in Q3:2023-24. Net capital inflows exceeded the CAD, supported by robust FPI and banking capital, leading to an accretion of foreign exchange reserves on a balance of payment (BoP) basis (excluding valuation effects) to the tune of 6.0 billion during the quarter (Chart IV.22).
At end-December 2023, India’s external debt stood at US$ 648.2 billion (Chart IV.23a); the external debt to GDP ratio declined to 18.7 per cent at end-December 2023 (at end-September 2023 it was 18.8 per cent). India’s external sector exhibited resilience, indicated by sustainable levels of key vulnerability indicators at end-December 2023 (Chart IV.23b).
Payment Systems Digital transactions grew across different payment modes in March 2024, led by retail transactions through the Unified Payments Interface (UPI), the National Electronic Funds Transfer (NEFT) and the Bharat Bill Payment System (BBPS) [Table IV.3]. Large-value transactions through the Real Time Gross Settlement (RTGS) showed accelerated growth (y-o-y) in volume and value terms. UPI achieved a significant milestone of 13.4 billion transactions in March 2024, thereby adding another billion to its tally. Mobile transactions in the retail segment experienced consistent growth, propelled by person-to-merchant (P2M) transactions which accounted for 61.7 per cent of the total volume compared to 55.6 per cent a year ago. The transaction category upto ₹500 drove this surge, leading to a fall in the average UPI transaction size.27 This indicated heightened digital payment usage at smaller merchant outlets. Under the BBPS, the average ticket size for transactions increased by 45.7 per cent in March 2024, driven by a sharp growth (y-o-y) in the value of transactions. In February 2024, credit card transactions volume and value grew (y-o-y) by 34.0 per cent and 25.7 per cent, respectively. The number of outstanding credit cards of SCBs surpassed the 10-crore mark in February 2024 (equivalent to 26.6 per cent of total number of credit accounts of SCBs28). During 2023-24 (April-February), nearly 14.6 per cent of the increase (y-o-y) in personal loans can be attributed to the transactions on credit cards (in value terms). 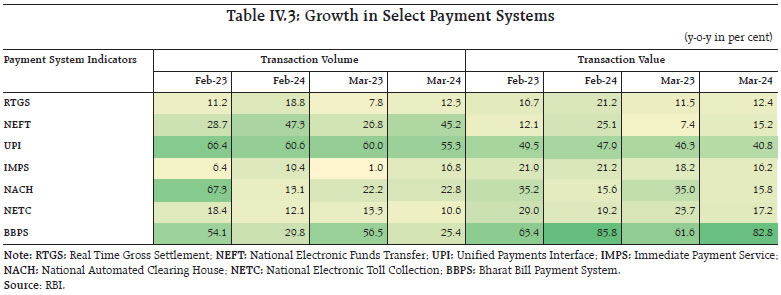 National Payments Corporation of India (NPCI)’s wholly owned subsidiary NPCI International Payments Ltd. (NIPL) in partnership with Nepal’s Fonepay Payment Service Ltd., has now made UPI operational for cross-border payments between the two countries. This enables Indian consumers to make P2M payments across several merchant locations in Nepal through QR codes. In the statement on developmental and regulatory policies dated April 5, 2024 the Reserve Bank proposed facilitating cash deposits via UPI and extending UPI access to Prepaid Payment Instruments (PPIs) through third-party applications. Additionally, the Reserve Bank proposed enabling non-bank payment system operators to provide Central Bank Digital Currency (CBDC) wallets to enhance and diversify user access and also test the resiliency of the CBDC platform. V. Conclusion Against this backdrop, the RBI’s monetary policy committee (MPC) met during April 3-5, 2024 and voted to maintain the policy rate at 6.5 per cent with the stance of withdrawal of accommodation. The MPC expected that a normal Southwest monsoon should support agricultural activity even as manufacturing would sustain profitability and services activity would likely grow above the pre-pandemic trend. In respect of demand conditions, the MPC expected private consumption to gain steam from a further pick-up in rural activity and steady urban demand as consumer confidence improves. The Committee felt that prospects for fixed investment remain bright with business optimism, healthy corporate and bank balance sheets, robust government capital expenditure and signs of upturn in the private capex cycle. On the downside, it took note of headwinds from geopolitical tensions, volatility in international financial markets, geoeconomic fragmentation, rising Red Sea disruptions, and extreme weather events. Gauging that risks are evenly balanced, the MPC projected real GDP growth for 2024-25 at 7.0 per cent and laid out a quarterly path for its likely evolution. Furthermore, in its assessment, food price uncertainties continue to weigh on the inflation outlook with the increasing incidence of climate shocks a key upside risk for food prices. It noted that early indications of a normal monsoon augur well for the kharif season. On the other hand, cost push pressures faced by firms are showing an upward bias and the recent firming up of international crude oil prices poses an upside risk to the path of inflation going forward. Accordingly, the MPC projected CPI inflation for 2024-25 at 4.5 per cent with risks evenly balanced. In the MPC’s view, domestic economic activity remains resilient, backed by strong investment demand and upbeat business and consumer sentiments. Headline inflation has come off the December peak; however, food price pressures have been interrupting the ongoing disinflation process even as shocks from adverse climate events and geo-political tensions add uncertainties to the outlook. In this environment, the MPC resolved that the path of disinflation needs to be sustained till inflation reaches the 4 per cent target on a durable basis. Monetary policy must remain actively disinflationary to ensure anchoring of inflation expectations as price stability sets the foundations for growth. In the words of Governor Shri Shaktikanta Das, “it is essential, in the best interest of the economy, that CPI inflation continues to moderate and aligns to the target on a durable basis. Till this is achieved, our task remains unfinished…Our effort is to ensure price stability on an enduring basis, paving the way for a sustained period of high growth… Our goal is in sight and we must remain vigilant”.29
Annex 1: Major Takeaways from the RBI’s Enterprise Surveys Key takeaways from the Reserve Bank’s quarterly enterprise surveys conducted during Q4:2023-24 are: -
Capacity utilisation (CU) in the manufacturing sector increased to 74.7 per cent in Q3:2023-24 from its level of 74.0 per cent in Q2:2023-24 with seasonally adjusted CU increasing by 10 bps to 74.6 per cent. -
Manufacturers maintain a positive outlook on CU in the ensuing quarters (Charts A1 and Chart A2). -
Manufacturing firms expect that production optimism is anticipated to improve in Q3:2024-25 after a seasonal moderation in Q1:2024-25. -
The outlook for turnover of services companies over the next three quarters is highly positive (Chart A3). -
Overall business sentiments among services sector companies remain highly optimistic till end-2024 (Chart A4). 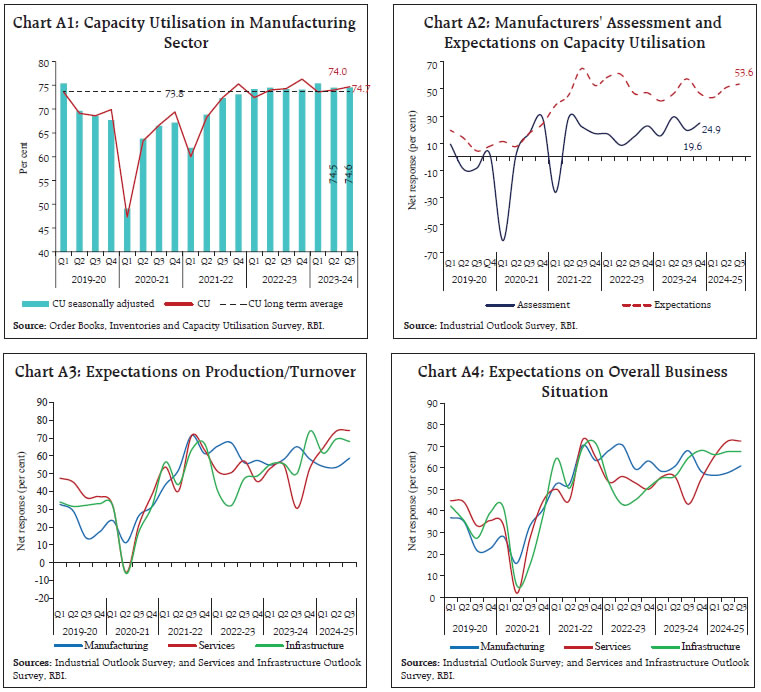
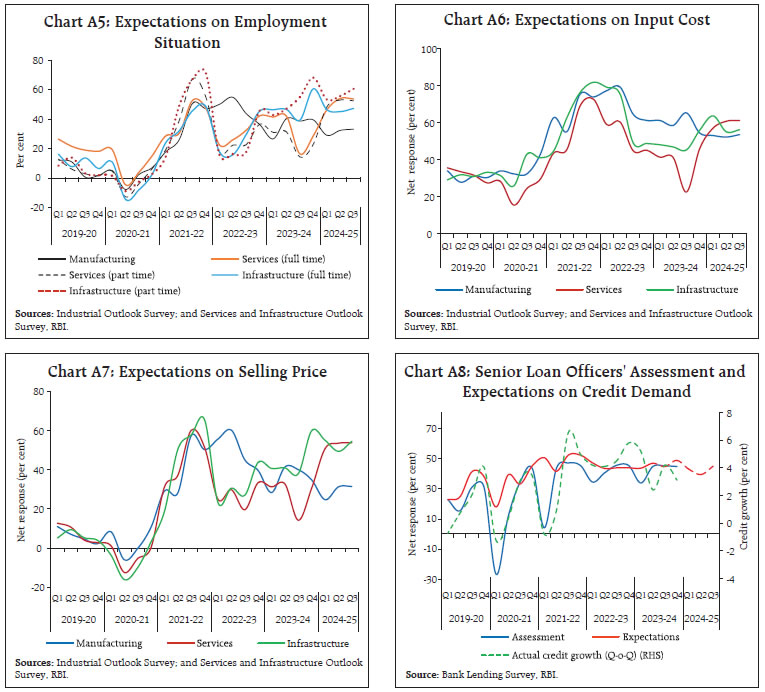 -
Firms across all the three sectors remained optimistic on employment conditions over the next three quarters (Chart A5). -
Cost pressures are likely to persist across the sectors up to end-2024. -
Business perception on selling prices remain upbeat in sync with expectations on input cost movements (Charts A6 and Chart A7). -
Senior loan officers polled optimistic loan demand conditions and expect continuation of easy terms and conditions for loans (Chart A8). Note: The ‘net response’ is calculated as the difference between the percentage of respondents reporting optimism and that reporting pessimism. The increase option (I) is an optimistic response for all parameters, except the cost related parameters, such as cost of raw materials, etc., where the decrease option (D) signifies optimism from the viewpoint of a respondent company. |
|