Rajiv Ranjan, Sarat Dhal and Bhupal Singh*
This paper explores the role of market microstructure in explaining the short-run movement in exchange rate in India. It examines the interdependence of intra-day high, low and closing exchange rates within the framework of parametric technical trading strategy combined with vector error correction and cointegration model. The closing exchange rate shows more or less symmetric response to high and low exchange rates. Market participants seem to be bound by a long-run bid-ask spread. Macroeconomic factor such as liquidity, foreign interest rate and stock return have differential impact on the daily high, low and close exchange rates.
JEL Classification : D4, F31
Keywords : Exchange Rate, Market Microstructure, Technical Trading
Introduction
Convincing explanation on what drives the short run movement in exchange rate has eluded academic and policy research in the past two decades. Conventional models of exchange rate determination such as the purchasing power parity (PPP) theory, the monetary approach to exchange rate and the portfolio balance approach were based on the macroeconomic explanations such as changes in prices, money demand, interest rate, trade balance, output and employment. However, these models could not provide satisfactory answers to short-term movements in exchange rate during the flexible exchange rate regime that followed after the break down of the Bretton Woods system in the early 1970s. The liberalisation of capital account and the surge in international capital flows during the 1990s added further complexity to the understanding of exchange rate movement over shorter horizon. The seminal works of Messe and Rogoff (1983) and Frankel and Rose (1994), which brought to the fore the weakness of macroeconomic models in forecasting exchange rate movements, opened the vistas of new research in the exchange rate literature focusing on the institutional aspects relating to microstructure of foreign exchange market (Lyons, 1995; Neely, 1997). The microstructure literature endeavours to explain exchange rate through the understanding of trading mechanism and the behaviour of market agents in terms of market activity (turnover), expectations, technical analysis and bid-ask spread. Among the elements of market microstructure, technical analysis or technical trading is recognized as one of the important ways to explain exchange rate movements. Cheung, Chinn and Marsh (2004) on the basis of a survey of the UK market observed that the non-fundamental factors dominate the short-term exchange rate movements. Similarly, Taylor and Allen (1992) found that in the London exchange market, technical analysis was used by more than 90 per cent of the dealers for their trading decisions.
In the Indian context, there is a dearth of research on the market microstructure and trading strategies with respect to foreign exchange market. A survey based study by Bhanumurthy (2005) confirms the existence of technical trading in the Indian foreign exchange market. The author finds that in the short-run the microstructure variables have relatively large influence on exchange rate than the fundamentals. Over a five year horizon, the share of technical trading increased from 33 per cent to 62 per cent. A majority of the market traders determine their bid-ask spread of the quotations based on the market convention. Furthermore, fundamentals were found to play insignificant role in the intra-day trading.
We examine the role of market microstructure in explaining the short-term movements in exchange rate based on the interaction among the intra-day high, low and close exchange rates. We use a vector error correction model (VECM). The study is organized into four sections. Section I presents a a brief review of literature. The methodology is discussed in Section II. Section III contains the empirical findings. Section IV concludes.
Section I
The Review of Literature
Technical analysis is described as the use of past price behaviour to guide trading decisions in the asset markets (Neely, 1997). According to Pring (2002), the objective of technical analysis is to identify a trend reversal at a relatively early stage and ride on that trend until the weight of the evidence shows that the trend has reversed. Technical trading comprises a set of rules that result from parameterizations and each trading rule generates trading signals (long, short, or out of market) according to the parameter values (Park and Irwin, 2004). Technical analysis is built on three essential principles: market action discounts everything (such fundamentals as inflation, interest rates), prices move in trends, and the traders react similarly under similar conditions. Foreign exchange chart patterns have been recognized and categorized for over 100 years, and the manner in which many patterns are repeated leads to the conclusion that human psychology shows little change. Since patterns have worked well in the past, it is assumed that they will continue to work well into the future. Technical analysis includes a variety of forecasting techniques (Neely, 1997; Park and Irwin, 2004). Several trading strategies can co-exist since financial markets are not homogenous in respect of the dimension, market participants and instruments. Early studies show the use of chart analysis such as filters (Alexander,1961, 1964; Fama and Blume, 1966; Levy 1971; Sweeney, 1986), stop-loss orders (Gray and Nielsen, 1963; Houthakker, 1961), moving averages (Cootner, 1962; Dale and Workman, 1980; James, 1968; Van Horne and Parker, 1968), channels (Irwin and Uhrig, 1984), momentum oscillators (Smidt, 1965) and relative strength indicators (Jensen and Benington, 1970; Levy, 1967a, 1967b). Advanced methods such as head and shoulders model (Chang and Osler, 1998), trade range breakout rules (Brock et al., 1992; Lukac et al., 1988), genetic programming (Neely et al.,1996), neural network (Tenti, 1996), stochastic oscillator and parametric trading rules (Fiess and MacDonald, 1999) are also gaining popularity in more complex financial markets.
Early literature rejected the trading rules, claiming that these lacked economic theory. Inspired by Samuelson (1965), Fama and Blume (1966) and Fama (1970), economists vigorously believed in the efficient market hypothesis; competitive financial markets are generally driven by macroeconomic fundamentals and market participants cannot make profits from technical trading. Since the mid-1990s, however, economists seem to have softened their stance on the efficient market hypothesis. Following Messe and Rogoff (1983) and Frankel and Rose (1995), there have been a spate of studies explaining exchange rate movements through the process of technical trading strategies, order flows and price formations (Curcio et al., 1997; Cheung et. al., 2004; Cheung and Wong, 2000; Cornell and Dietrich, 1978; Dooley, 1983; Evans and Lyons, 2002; Frankel and Froot, 1990; Lee and Mathur, 1996; Lee et al., 2001; Levich and Thomas, 1993; Lukac et al., 1988; Maillet and Michel, 2000; Martin, 2001; Menkhoff, 1997; Menkhoff and Schlumberger, 1995; Neely, 1997; Osler, 2003; Osler and Chang, 1995; Park and Irwin, 2004; Shafer, 1983; Sweeney, 1986; Taylor, 1986; Taylor and Allen, 1992; Yao, 1998). A key finding of the copious literature is that trading strategies have been more successful in the foreign exchange market than other financial markets. The widespread use of technical trading, especially since the mid-1990s, can be attributable to the rapid progress in financial markets, spurred by globalisation, liberalisation and information technology (Park and Irwin, 2004).
Studies have also conjectured about the correlation of technical trading strategies with central bank’s open market operation (Davutyan and Pippenger, 1989; Dooley and Shafer, 1983; Levich and Thomas, 1993; Lukac et al., 1988; Silber, 1994; Sweeney, 1986). Economic intuitions behind such relationship are given by Szakmary and Mathur (1997) and Saacke (2002). After an exogenous shock to fundamentals, the exchange rate, without the central bank intervention, jumps to a new equilibrium level, similar to the Dornbusch type overshooting effect. However, a sharp adjustment in the exchange rate may fuel uncertainties and adversely affect balance sheets of producing sectors as well as the financial intermediaries, which in turn may engender unsustainable macroeconomic outcomes and financial instability. In order to contain such volatility and facilitate smooth operation of foreign exchange market, central banks may lean against the wind by preventing sharp fluctuation in the exchange rate. In this process, they delay the adjustment of exchange rate. If adjustment is delayed, exchange rates would display a trend during the phase of adjustment. This trend may be exploited by trend-following forecasters. LeBaron (1999) shows that when a typical moving average rule generates buy signals for a foreign exchange rate, the Federal Reserve in the US tends to support the dollar the next period. This finding is consistent with a ‘leaning against the wind’ policy. LeBaron’s (1999) findings are generally confirmed by others including Neely (2002), Neely and Weller (2001), Sapp (2004), Sosvilla-Rivero et al. (2002), and suggest that technical trading rules precede interventions and interventions do not generate technical trading but rather respond to strong trends in exchange rates. However, Saacke (2002) stresses that trading strategies on days that neither coincide with nor preceded by intervention periods are also quite substantial, strongly suggesting that interventions are not the only source of technical trading in the foreign exchange markets. The key finding of the above studies is that central bank open market operations may be related to technical trading in some way; however, such relationship need not be construed as the causal relationship.
The research studies on financial markets no longer seem to be preoccupied with the dichotomous debate whether markets rally around fundamentals or trading strategies generate profits. Financial markets may not fully operate under the rules of economic theory. However, the departure of markets from fundamentals cannot be solely attributed to the existence of technical trading. Similarly, trading strategies can remain in vogue, even if market participants find them unprofitable over time. Thus, economists are comfortable with an information perspective on financial markets, relying on several analytical models encompassing market microstructure as well as economic fundamentals for a better understanding of financial markets.
Section II
The Methodology
Empirical works show that finest data on forex microstructure are confined to the transactions data (Goohart and Payne, 1996; Goodhart et al., 2006; Evans, 2001; Evans and Lyons, 1999; Rime, 2000). Studies on optimal bid-ask spread suggest that the order flow dynamics can be analysed with volume information, related prices or both. Since transaction data are hardly available on a high frequency basis in the Indian context, we work with a trading strategy based on the micro-structure of daily exchange rate, i.e. intra-day high, low and close exchange rates. According to the literature, each of these exchange rates can provide useful insights about market participants and demand and supply factors (Fiess and MacDonald, 1999). Illustratively, intra-day high and low exchange rates constitute the two extremes of price discovery in the market. They can be related to the bid-ask quotes of dealers and reflect the order flow underlying the demand-supply forces that determine the behavior of foreign exchange market (Evans and Lyons, 1999, 2002; Lyons, 2001). According to Evans and Lyons (1999), intra-day high and low exchange rates can relate to order flow, which is a measure of buying/ selling pressure.1 Buoyant demand for foreign currency would accentuate depreciation pressure on the domestic currency, leading exchange rate to reach the intra-day peak level. Similarly, higher supply of foreign currency would accentuate appreciation pressure, taking the exchange rate to intra-day low. The closing exchange rate will respond to demand and supply of foreign currency transactions and the open market operations of the central bank towards preventing market instability as it evolves through intra-day high and low levels of the exchange rate. Given the profit objective of foreign exchange traders, it could be possible that most transactions occur at a bid-ask rates corresponding to the intra-day high-low exchange rate rather than the closing exchange rate (Neely, 2002; Neely and Weller, 2001). However, the closing exchange rate may be related to the central banks’ assessment of macroeconomic fundamentals. In other words, intra-day high, low and close exchange rates can be identified with
the three types of economic forces: demand, supply and policy actions. Accordingly, investors would form expectations about the subsequent demand and supply conditions and price discovery process in the foreign exchange market based on the available information. Investors would devise suitable trading strategies, which may exclusively rely on historical information on the closing exchange rate or in a dynamic setting, on the past information on all the three exchange rates i.e., intra-day high, low and close.
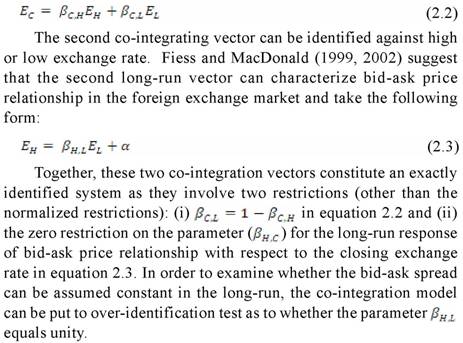
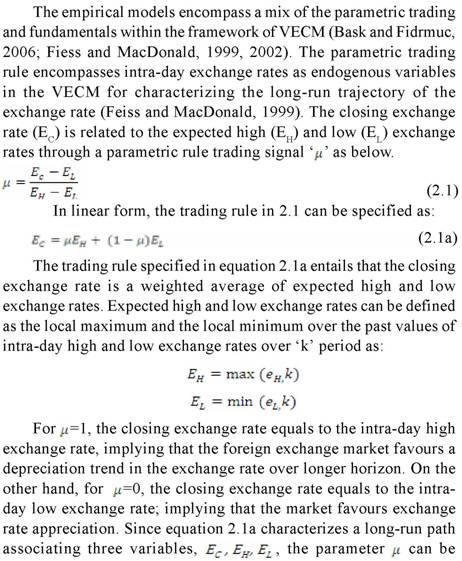 estimated using a suitable model. Given this long-run path, the variables can also exhibit simultaneous relationship in the short-run. Moreover, the variables can exhibit non-stationary trend. Thus, we follow the co-integration approach.
Given a single co-integrating vector, the co-integrating path can be identified without any restriction on the long-run coefficients, excepting the normalized restriction. However, in the presence of more than one co-integrating relationships among the variables, the empirical model would need further identification. In our case, for three exchange rate variables, there can be a maximum of two co-integrating relationships. One co-integrating path can be related to equation 2.1a:
 Apart from the micro structure of exchange rate, we also include the relevant macroeconomic variables for which high frequency data are available. These include liquidity, foreign interest rate, and asset return as exogenous variables affecting the short-run dynamics of exchange rate in the VECM. The liquidity variable is defined as the spread of inter-bank call money rate over the repo rate. The foreign interest rate is represented by changes in the US federal funds rate, to account for the changing external financial environment. Asset market development is characterized through the stock return. We use daily for the period April 1995 to September 2007.
Section III
Empirical Analysis
The Augmented Dicxey - Fuller (ADF) unit root tests of intra-day high, low and closing exchange rates suggest that these variables are non-stationary in logarithm-levels but stationary in the first difference (Table 1). In the first difference form, these exchange rate series show statistically significant contemporaneous correlation among themselves.
The closing exchange rate series has more or less similar correlation with the high and the low exchange rates (Table 2). The sample mean of daily variation in the three exchange rate series is more or less similar. However, these indicators can be different from each other in terms of volatility as measured by the standard deviation (Table 3).
Table 1: Unit Root Test of Exchange Rate |
Variables |
ADF Stat |
Probability |
Critical Value (5 per cent level) |
Lag Order (SIC) |
Logarithm Transformed |
With Intercept |
|
|
|
EC |
-2.33 |
0.16 |
-2.86 |
5 |
EH |
-2.36 |
0.15 |
-2.86 |
4 |
EL |
-2.50 |
0.12 |
-2.86 |
0 |
| |
With Intercept and Trend |
|
|
|
EC |
-0.40 |
0.99 |
-3.41 |
5 |
EH |
-0.33 |
0.99 |
-3.41 |
4 |
EL |
-0.18 |
0.99 |
-3.41 |
0 |
First Difference Series |
With Intercept |
|
|
|
DEC |
-19.55 |
0.00 |
-2.86 |
4 |
DEH |
-24.02 |
0.00 |
-2.86 |
3 |
DEL |
-50.09 |
0.00 |
-2.86 |
0 |
SIC: Schwartz Information Criterion. |
Table 2: Correlation of Intra-day High, Low and Close Exchange Rates |
| |
DEC |
DEH |
DEL |
DEC |
1.00 |
0.61 |
0.65 |
DEH |
0.61 |
1.00 |
0.53 |
DEL |
0.65 |
0.53 |
1.00 |
In line with the theoretical prediction, there are two co-integrating relationship among the trading strategy indicator and intra-day high and low exchange rates (Annex). Table 4 presents the estimated cointegrated relations based on the alternative VECM. The first co-integrating vector for Model 1 shows that the underlying trading strategy assigns more or less equal weight to the intra-day high and low exchange rates, respectively. In other words, in the long-run, the closing exchange rate can be the middle rate of intra-day high and low exchange rates. The second vector, which is identified against the intra-day high exchange rate, has the coefficient of intra-day low exchange rate closer to unity. This implies that the high and the low exchange rates share a long-run bid-ask spread relationship. The cointegrating relations are almost similar in Model 2 when the 5-day maximum and minimum of high and low exchange rates, respectively, are used. For Model 3 and Model 4, which take into account 22-day and 60-day maximum and minimum of intra-day high and low exchange rates, respectively, the intra-day close exchange rate shows higher response to the intra-day low exchange rate than the intra-day high exchange rate. The symmetric response of the close exchange rate to high and low exchange rates was not statistically rejected as suggested by chi-square test. Thus, the VECM model suggests two key characteristics of exchange rate dynamics. First, the closing exchange rate can have similar long-run response to intra-day high and low exchange rate or to the underlying demand and supply shocks affecting the foreign exchange market. Second, market participants may be guided by a long-run average bid-ask spread.
Table 3: Statistical Properties of Exchange Rates
(Annualised Variation in Daily Exchange Rate in Per cent) |
| |
DEC |
DEH |
DEL |
Mean |
1.248 |
1.263 |
1.250 |
Standard Deviation |
55.81 |
61.21 |
58.05 |
Skewness |
-1.10 |
1.20 |
-1.33 |
Kurtosis |
37.03 |
22.60 |
31.88 |
Note: Daily annualized variation in exchange rate is defined as first difference of logarithm transformed exchange rate multiplied by 100 and 250 (i.e., number of trading days in a year) |
Short-run Adjustment Process in the VECM
The estimated error correction equations for alternative VECM corresponding to different local maximum of intra-day high and local minimum of intra-day low exchange rate show differential adjustment of high and low exchange rate to shocks to the two co-integrating vectors; the first co-integrating vector characterizing the trading strategy and the second co-integrating vector characterizing excess demand or bid-ask spread (Table 5). Intra-day high and low exchange rate exhibit substantial short-run adjustment to trading strategy when the trading rule model involves a short-horizon of 5-day local maximum and local minimum of high and low exchange rate, respectively. In this model, excess demand shock in the foreign exchange market, has significant short-run impact on high and low exchange rate with appropriate sign condition. However, for the trading strategy which involves relatively longer horizon local maximum and local minimum of high and low exchange rate, short-run adjustment of exchange rates to trading strategy and excess demand shock appear sluggish.
Table 5: Short-run Adjustment of Exchange Rates (Coefficient of Error Correction Terms) |
| |
Exchange Rates |
ΔEC |
ΔEH |
ΔEL |
5-day Window |
|
|
|
Co-integration Equation 1 |
-0.03 |
-0.45 |
-0.38 |
| |
(-0.46) |
(-10.10) |
(-10.31) |
Co-integration Equation 2 |
0.01 |
0.05 |
-0.06 |
| |
(0.94) |
(8.29) |
(-11.44) |
22-day Window |
|
|
|
Co-integration Equation 1 |
0.05 |
-0.08 |
-0.10 |
| |
(2.29) |
(-4.96) |
(-8.43) |
Co-integration Equation 2 |
0.00 |
0.01 |
-0.01 |
| |
(-0.53) |
(4.83) |
(-7.77) |
60-day Window |
|
|
|
Co-integration Equation 1 |
-0.01 |
-0.03 |
-0.02 |
| |
(-2.60) |
(-8.66) |
(-8.49) |
Co-integration Equation 2 |
0.00 |
0.01 |
-0.01 |
| |
(-0.87) |
(4.09) |
(-5.70) |
Figures in bracket indicate ‘t’ statistic. |
Impact of Fundamentals
The parametric trading VECM also reveal some interesting insights of the role of domestic liquidity, foreign interest rate and asset markets on the exchange rate dynamics (Table 6). First, in the error correction equations for the exchange rate variables, the spread of call money rate over the repo rate, reflecting domestic liquidity condition, showed statistically significant inverse relationship with intra-day close and low exchange rate but statistically insignificant positive effect on intra-day high exchange rate. This implies that domestic liquidity induced changes in interest rate can affect demand side factors but not supply side factors in the foreign exchange market. Second, the external financial environment reflecting the change in the US federal funds rate (with a lag of 5-day) could have statistically significant positive impact only on the intra-day high exchange rate. This could be attributable to the linkage between foreign interest rate and capital flows.3 However, positive impact of higher foreign interest rate on intra-day high exchange rate of Indian rupee with respect to the US dollar does not culminate in to a similar impact on intra-day close exchange rate. Third, an increase in the return on equity market, which reflects the impact of foreign capital flows, mainly through the foreign institutional investors, showed significant inverse relationship with all the three intra-day high, low and close exchange rates. This finding is in line with macroeconomic models, which emphasize the key role of capital flows in the floating exchange rate regime.
Variance Decomposition Analysis
The variance decomposition analysis reveals key features of exchange rate dynamics. First, with respect to the ordering sequence of close, high and low exchange rates, the shock to close exchange rate explained most of the variation in high and low exchange rates. However, for alternate ordering of high, low, and close exchange rate, the variation in intra-day high exchange rate accounted for a major share (about 50 per cent) of variation in the closing exchange rate. The impact of intra-day low exchange rate on the closing exchange rate could be much lower than that of intra-day high exchange rate. This type of short-run adjustment in exchange rate could be reflection of the preference to depreciation pressure than the appreciating pressure.
Table 6: Impact of Select Macroeconomic Variables on Exchange Rate in the Trading Strategy Models |
Models
|
Exchange Rates |
ΔEC |
ΔEH |
ΔEL |
Model 2 |
|
|
|
Fundamentals |
|
|
|
SCMR |
-0.00608 |
0.000796 |
-0.00239 |
| |
(-6.12) |
(1.05) |
(-3.79) |
ΔFFR(5) |
0.07730 |
0.19150 |
0.03400 |
| |
(0.87) |
(2.81) |
(0.61) |
BSER |
-3.19460 |
-3.08070 |
-0.43850 |
| |
(-3.78) |
(-4.78) |
(-0.81) |
Model 3 |
|
|
|
SCMR |
-0.0062 |
0.000588 |
-0.00121 |
| |
(-6.33) |
(0.82) |
(-2.26) |
ΔFFR(5) |
0.0524 |
0.1578 |
-0.0147 |
| |
(0.59) |
2.46 |
(-0.31) |
BSER |
-3.0565 |
-2.4756 |
0.0435 |
| |
(-3.63) |
(-4.03) |
(0.09) |
Model 4 |
|
|
|
SCMR |
-0.00629 |
0.00087 |
-0.00121 |
| |
(-6.34) |
(1.27) |
(-2.23) |
ΔFFR(5) |
0.0593 |
0.1709 |
-0.0268 |
| |
(0.68) |
(2.83) |
(0.56) |
BSER |
-2.7641 |
-2.0801 |
-0.1907 |
| |
(-3.31) |
(-3.61) |
(-0.41) |
SCMR = Spread of call money rate over the repo rate DFFR (5) = changes in the US federal funds rate with a lag of 5 days, BSER = return on BSE SENSEX equity index.
Note: Model 2,3 and 4 correspond to trading strategy defined over 5-day, 22-day, and 60-day local maximum and minimum of intra-day high and low exchange rates, respectively.
Figures in bracket indicate ‘t’ statistic. |
Section IV
Conclusion
This study explored whether technical trading strategies can be useful in explaining the movement in short-term exchange rate in India. The key findings are as follows. First, the interdependence of intra-day high, low and close exchange rates encompassing trading strategies, associated with the demand and supply conditions in foreign exchange market exists. Second, the close exchange rate can have symmetric long-run response to intra-day high and low exchange rates. Third, trading strategy models coupled with macroeconomic fundamentals are useful for ascertaining the impact of a particular macroeconomic shock on the demand or supply conditions. The domestic liquidity shock can significantly influence the intra-day low and close exchange rate but not the intra-day high exchange rate. A rise in foreign interest rate may affect intra-day high but not the low and close exchange rates. Stock return can affect all the three components of exchange rate, i.e., intra-day high, low and close. Thus, trading signals characterizing the underlying demand and supply conditions and their likely influence on investors in the foreign exchange market can be ascertained by using the past history of intra-day exchange rates. From a policy perspective, these aspects of the microstructure of exchange rate contain useful information for exchange rate management.
Annex: Cointegration Rank Test: Johansen’s VECM |
Null Hypothesis/
No. of Cointegrating Relations |
Trace Statistic |
Critical Value (5%) |
Level of Significance |
Model 1 (EC, EH,EL)
Cointegration Rank Test (Trace) |
|
|
|
None |
476.67 |
29.80 |
0.00 |
At most 1 |
218.71 |
15.49 |
0.00 |
At most 2 |
1.23 |
3.84 |
0.27 |
Cointegration Rank Test (Maximum Eigen value) |
|
|
|
None |
257.96 |
21.13 |
0.00 |
At most 1 |
217.49 |
14.26 |
0.00 |
At most 2 |
1.23 |
3.84 |
0.27 |
Model 2 (EC, EH5,EL5) |
|
|
|
Unrestricted Cointegration Rank Test (Trace) |
|
|
|
None |
467.42 |
29.80 |
0.00 |
At most 1 |
189.75 |
15.49 |
0.00 |
At most 2 |
1.06 |
3.84 |
0.30 |
Unrestricted Cointegration Rank Test (Maximum Eigen value) |
|
|
|
None |
277.67 |
21.13 |
0.00 |
At most 1 |
188.70 |
14.26 |
0.00 |
At most 2 |
1.06 |
3.84 |
0.30 |
Model 3 (EC, EH22,EL22) |
|
|
|
Unrestricted Cointegration Rank Test (Trace) |
|
|
|
None |
211.43 |
29.80 |
0.00 |
At most 1 |
71.38 |
15.49 |
0.00 |
At most 2 |
1.20 |
3.84 |
0.27 |
Unrestricted Cointegration Rank Test (Maximum Eigen value) |
|
|
|
None |
140.06 |
21.13 |
0.00 |
At most 1 |
70.18 |
14.26 |
0.00 |
At most 2 |
1.20 |
3.84 |
0.27 |
Model 4 (EC, EH60,EL60) |
|
|
|
Unrestricted Cointegration Rank Test (Trace) |
|
|
|
None |
204.78 |
29.80 |
0.00 |
At most 1 |
51.96 |
15.49 |
0.00 |
At most 2 |
2.05 |
3.84 |
0.15 |
Unrestricted Cointegration Rank Test (Maximum Eigen value) |
|
|
|
None |
152.82 |
21.13 |
0.00 |
At most 1 |
49.91 |
14.26 |
0.00 |
At most 2 |
2.05 |
3.84 |
0.15 |
EC EH, EL are daily close, high and low exchange rates. EH5, EH22,EH60 are the maximum of daily high exchange rate over 5-days, 22-days and 60-days, respectively. Similarly, EL5,EL22 and EL60 are the minimum of daily low exchange rate over 5-days, 22-days and 60-days, respectively. |
* Rajiv Ranjan is Director, and Sarat Dhal and Bhupal Singh are Assistant Advisers in the Department of Economic Analysis and Policy, Reserve Bank of India, Mumbai. The views expressed in the paper are solely of the authors and have no bearing on the organisation to which the authors belong.
Note :
1 The order flow is a measure of the net of buyer-initiated orders and seller initiated
orders. In a dealer market such as the spot foreign exchange, it is the dealers who
absorb this order flow, and they are compensated for doing so.
2 An increase in foreign interest rate would moderate capital flows, accentuate demand
side relative to supply side factors in foreign exchange market and thus, exert upward (depreciation) pressure on exchange rate, which may be favorable for exports and
economic activity.
References
Alexander, S. S. (1961), ‘Price Movements in Speculative Markets: Trends or Random Walks’, Industrial Management Review, vol.2, 7-26.
Bhanumurthy, N.R. (2005), ‘Microstructure in the Indian Foreign Exchange Rate’, ICICI Research Centre.
Brock, W., Lakonishock, J. and LeBaron, B. (1992), ‘Simple Technical Trading Rules and the Stochastic Properties of Stock Returns’, Journal of Finance, vol. 47, 1731-1764.
Chang, P. H. K., and Osler, C. L. (1998), ‘Methodical Madness: Technical Analysis and the Irrationality of Exchange Rate Forecasts’, Economic Journal, vol. 109, 636-61.
Cheung, Y. W., Chinn, M.D. and Marsh, I. W. (2005), ‘How Do UK-based Foreign Exchange Dealers Think Their Market Operates?’, International Journal of Finance and Economics,9, 289-306.
Cheung, Y. W., and Wong, C. Y. P. (2000), ‘A Survey of Market Practitioners’ Views on Exchange Rate Dynamics’, Journal of International Economics, vol. 51, 401-419.
Cootner, P. H. (1962), ‘Stock Prices: Random vs. Systematic Changes’, Industrial Management Review, vol. 3, 24-45.
Cornell, W. B., and Dietrich, J. K. (1978), ‘The Efficiency of the Market for Foreign Exchange under Floating Exchange Rates’, Review of Economics and Statistics, vol. 60, 111-120.
Curcio, R., Goodhart, C., Guillaume, D. and Payne, R. (1997), ‘Do Technical Trading Rules Generate Profits? Conclusions from the Intra-day Foreign Exchange Market’, International Journal of Finance and Economics, vol.2, 267-280.
Dale, C., and Workman, R. (1980) , ‘The Arc Sine Law and the Treasury Bill Futures Market’, Financial Analysts Journal, vol.36, 71-74.
Davutyan, N. and Pippenger, J. (1989), ‘Excess Returns and Official intervention: Canada 1952- 1960’, Economic Inquiry, vol.27, 489-500.
Dooley, M. P. and Shafer, J. R. (1983), ‘Analysis of Short-run Exchange rate Behavior: March 1973 to November 1981’, in D. Bigman and T. Taya, (ed.) Exchange Rate and Trade Instability: Causes, Consequences, and Remedies, Cambridge, MA: Ballinger.
Fama, E. F. (1970), ‘Efficient Capital Markets: A Review of Theory and Empirical Work’, Journal of Finance’, vol.25, 383-417.
Fama, E. F. and Blume, M. E. (1966), ‘Filter Rules and Stock Market Trading’, Journal of Business, 39, 226-241.
Fiess, N. M., and MacDonald, R. (1999), ‘Technical Analysis in the Foreign Exchange Market: A Cointegration-based Approach’, Multinational Finance Journal, vol.3, 147-72.
Fiess, N. M., and MacDonald, R. (2002). ‘Towards the Fundamentals of Technical Analysis: Analysing the Information Content of High, Low and Close Prices’, Economic Modelling, vol.19, 353-74.
Frankel, J. A. and Froot, K. A. (1990), ‘Chartist, Fundamentalists, and Trading in the Foreign Exchange Market’, American Economic Review, vol. 80, 181-185.
Frankel, J. A. and Rose, A. K. (1994), ‘A Survey of Empirical Research on Nominal Exchange Rates,’ NBER Working Papers 4865, National Bureau of Economic Research, US.
Goodhart, C., Ito, T. and Payne, R. (1996), ‘One Day in June 1993: A Study of the Workings of Reuters Electronic Foreign Exchange Trading System’, in The Microstructure of Foreign Exchange Markets, eds., J. Frankel, G. Galli and A. Giovannini (University of Chicago Press, Chicago: 1996).
Gray, R. W., and Nielsen, S. T. (1963). ‘Rediscovery of Some Fundamental Price Behavior Characteristics’, Paper Presented at the Meeting of the Econometric Society, Cleveland, Ohio, September.
Houthakker, H. (1961) ,’Systematic and Random Elements in Short-Term Price Movements’, American Economic Review, vol. 51, 164-172.
Irwin, S. H., and Uhrig, J. W. (1984), ‘Do Technical Analysts Have Holes in Their Shoes?’, Review of Research in Futures Markets, vol 3, 264-277.
James, F. E. (1968), ‘Monthly Moving Averages: An Effective Investment Tool?’, Journal of Financial and Quantitative Analysis, September, 315-326.
Jensen, M. C. and Benington, G. A. (1970), ‘Random Walks and Technical Theories: Some Additional Evidence’, Journal of Finance, 25, 469-482.
LeBaron, B. (1999), ‘Technical Trading Rule, Profitability and Foreign Exchange Intervention’, Journal of International Economics, vol.49, 125-143.
Lee, C. I. and Mathur, I. (1996), ‘Trading Rule Profits in European Currency Spot Cross-Rates’, Journal of Banking and Finance, vol. 20, 949-962.
Lee, C. I., Gleason, K. C. and Mathur, I. (2001), ‘Trading Rule Profits in Latin American Currency Spot Rates’, International Review of Financial Analysis, vol.10, 135-156.
Levich, R. M. and Thomas, L. R. (1993), ‘The Significance of Technical Trading Rule Profits in the Foreign Exchange Market: A Bootstrap Approach’, Journal of International Money and Finance, vol.12, 451-474.
Levy, R. A. (1967a), ‘Random Walks: Reality or Myth’, Financial Analysts Journal, vol. 23, 69-77.
Levy, R. A. (1967b), ‘Relative Strength as a Criterion for Investment Selection’, Journal of Finance, vol. 22, 595-610.
Levy, R. A. (1971), ‘The Predictive Significance of Five-point Chart Patterns’, Journal of Business, vol. 44, 316-323.
Lui, Y. H. and Mole, D. (1998), ‘The Use of Fundamental and Technical Analyses by Foreign Exchange Dealers: Hong Kong Evidence’, Journal of International Money and Finance, vol. 17, 535-545.
Lukac, L. P., Brorsen, B. W. and Irwin, S. H. (1988), ‘A Test of Futures Market Disequilibrium using Twelve Different Technical Trading Systems’, Applied Economics, vol.20, 623-639.
Lyons, R. K. (1995), ‘Test of Microstructure Hypotheses in the Foreign Exchange Market’, Journal of Financial Economics, vol.39, 321-351.
Lyons, R. K. (2001), ‘New Perspective on Foreign Exchange Markets: Order-flow Analysis’, International Finance, vol. 4, 303-320.
Maillet, B. and Michel, T. (2000), ‘Further Insights on the Puzzle of Technical Analysis Profitability’, European Journal of Finance, vol. 6, 196-224.
Martin, A. D. (2001), ‘Technical Trading Rules in the Spot Foreign Exchange Markets of Developing countries’, Journal of Multinational Financial Management, vol.11, 59-68.
Meese, R. A. and Rogoff, K.S. (1983), ‘Empirical Exchange Rate Models of the Seventies: Do They Fit Out of Sample?’, Journal of International Economics, vol. 14, 3-24.
Menkhoff, L. (1997), ‘Examining the Use of Technical Currency Analysis’, International Journal of Finance and Economics, vol. 2, 307-318.
Menkhoff, L. and Schlumberger, M. (1995), ‘Persistent Profitability of Technical Analysis on Foreign Exchange Markets?’, Banca Nazionale del Lavoro Quarterly Review, 189-216.
Neely, C. J. (1997), ‘Technical Analysis in the Foreign Exchange market: A Layman’s Guide’, Review: Federal Reserve Bank of St. Louis, September/ October, 23-38.
Neely, C. J. (2002), ‘The Temporal Pattern of Trading Rule Returns and Exchange Rate Intervention: Intervention does not Generate Technical Trading Profits’, Journal of International Economics, vol. 58, 211-232.
Neely, C. J. and Weller, P. A. (2001), ‘Technical Analysis and Central Bank Intervention’, Journal of International Money and Finance, vol. 20, 949-970.
Osler, C. L. (2003), ‘Currency Orders and Exchange Rate Dynamics: An Explanation for the Predictive success of Technical Analysis’, Journal of Finance, vol. 58, 1791-1820
Osler, C. L., and Chang, P. H. K. (1995) ‘Head and Shoulders: Not Just a Flaky Pattern.’ Federal Reserve Bank of New York, Staff Reports, 4.
Park, C. and Irwin, S. H. (2004), ‘The Profitability of Technical Analysis: A review’, AgMAS Project Research Report No. 2004-04.
Pring, M. J. (2002), Technical Analysis Explained, New York, NY: McGraw-Hill.
Rossi, B. (2000), ‘Testing Out-of-Sample Predictive Ability with High Persistence: An Application to Models of Nominal Exchange-Rate Determination’, Princeton University Mimeo, April.
Saacke, P. (2002), ‘Technical Analysis and the Effectiveness of Central Bank Intervention’, Journal of International Money and Finance, vol.21, 459-479.
Samuelson, P. A. (1965), ‘Proof that properly Anticipated Prices Fluctuate Randomly’, Industrial Management Review, vol.6, 41-49.
Sapp, S. (2004), ‘Are all Central Bank Interventions Created Equal? An Empirical Investigation’, Journal of Banking and Finance, vol.28, 443-474.
Silber, W. L. (1994), ‘Technical Trading: When it Works and When it doesn’t’, Journal of Derivatives, vol.1, 39-44.
Smidt, S. (1965), Amateur Speculators, Ithaca, NY: Graduate School of Business and Public Administration, Cornell University.
Sosvilla-Rivero, S., Andrada-Felix, J. and Fernandez-Rodriguez, F. (2002), ‘Further Evidence on Technical Trade Profitability and Foreign Exchange Intervention’, Applied Economics Letters, vol.9, 827-832.
Sweeny, R. J. (1986), ‘Beating the Foreign Exchange Market’, Journal of Finance, vol. 41, 163-182.
Szakmary, A. C. and Mathur, I. (1997), ‘Central Bank Intervention and Trading Rule Profits in Foreign Exchange Markets’, Journal of International Money and Finance, vol. 16, 513-535.
Taylor, M. P. and Allen, H. (1992), ‘The Use of Technical Analysis in the Foreign Exchange Market’, Journal of International Money and Finance, vol.11, 304-314.
Van Horne, J. C. and Parker, G. G. C. (1968), ‘Technical Trading Rules: A comment’, Financial Analysts Journal, vol. 24, 128-132.
Yao, J. (1998), ‘Market making in the Interbank Foreign Exchange Market’, New York University Salomon Center Working Paper No.S-98-3.
Tenti, P. (1996), ‘Forecasting Foreign Exchange Rate Using Recurrent Neural Network’, Applied Artificial Intelligence, vol. 10, 567-581. |