| CONTENTS | | S.No. | Particulars | | 1. | Select abbreviations | | 2. | Foreword | | 3. | Executive Summary | | 4. | Chapter 1 – The Ombudsman Schemes of RBI: Activities during April 1, 2021 to March 31, 2022 | | | Receipt of complaints | | | ORBIO-wise receipt and allocation of complaints | | | Geographic dispersion of complaints across the states | | | Modes of receipt of complaints | | | Category-wise receipt of complaints | | | Population group-wise distribution of complaints | | | Complainant type-wise receipt of complaints | | | Entity type-wise receipt of complaints | | | Disposal of complaints | | | Mode of disposal of maintainable complaints | | | Reasons for closure of complaints under non-maintainable clauses | | | Receipt of Appeals | | | Cost of handling a complaint | | | Turn Around Time (TAT) for disposal of complaints | | | Bank group-wise complaint conversion rate | | 5. | Chapter 2 - The Banking Ombudsman Scheme (BOS), 2006: Activities during April 1, 2021 to November 11, 2021 | | | Receipt of complaints | | | Mode of receipt of complaints | | | Zone-wise distribution of complaints | | | Complainant group-wise classification of complaints | | | Entity type-wise classification of complaints | | | Category-wise receipt of complaints | | | Mode of disposal of complaints | | | Grounds for rejection of maintainable complaints | | | Appeals against the decisions of the Banking Ombudsmen (BOs) | | 6. | Chapter 3 - The Ombudsman Scheme for Non-Banking Financial Companies (OSNBFC), 2018: Activities during April 1, 2021 to November 11, 2021 | | | Receipt of complaints | | | Mode of receipt of complaints | | | NBFC category-wise complaints received | | | Complainant group-wise classification | | | Nature of complaints handled | | | Disposal of complaints | | | Mode of disposal of maintainable complaints | | | Grounds for rejection of maintainable complaints | | | Appeals against the decisions of the NBFC Ombudsmen (NBFCOs) | | 7. | Chapter 4 – The Ombudsman Scheme for Digital Transactions (OSDT), 2019: Activities during April 1, 2021 to November 11, 2021 | | | Receipt of complaints | | | Mode of receipt of complaints | | | Zone-wise distribution of complaints | | | Complainant group-wise classification | | | Entity type-wise classification | | | Nature of complaints handled | | | Disposal of complaints | | | Mode of disposal of maintainable complaints | | | Grounds for rejection of maintainable complaints | | | Age-wise classification of pending complaints | | | Appeals against the decisions of Ombudsmen for Digital Transactions (ODTs) | | 8. | Chapter 5 – The Reserve Bank – Integrated Ombudsman Scheme, 2021: Activities during November 12, 2021 to March 31, 2022 | | | Receipt and handling of complaints at the Centralised Receipt and Processing Center (CRPC) | | | Receipt and handling of complaints at the Offices of the RBI Ombudsman (ORBIOs) | | | Mode of receipt of complaints | | | Population group-wise distribution of complaints | | | Zone-wise distribution of complaints | | | Complainant group-wise classification of complaints | | | Entity group-wise classification of complaints | | | Nature of complaints handled | | | Disposal of complaints | | | Mode of disposal of maintainable complaints | | | Grounds for rejection of maintainable complaints | | | Turn Around Time (TAT) of complaints | | | Awards Issued | | | Appeals against the decisions of the ORBIOs | | 9. | Chapter 6 - Other developments | | | Regulations: Important regulatory measures taken by the Reserve Bank | | | Root Cause Analysis (RCA) of major areas of complaints | | | Status of implementation of the action plan set out in ‘Utkarsh 2022’ for the year, April 1, 2021 to March 31, 2022 | | | Formulate policy/scheme for handling complaints not covered under the Ombudsman Scheme | | | Efforts for inclusion of safe banking practices in educational curriculum | | | Extension of the IO Scheme to NBFCs | | | Awareness generation activities of Consumer Education and Protection Department (CEPD) and Ombudsmen Offices | | | Nationwide Customer Satisfaction Survey for RB-IOS, CRPC and the Contact Center | | | Framework for Strengthening the Grievance Redress of banks | | | Winding down of Banking Codes and Standards Board of India (BCSBI) | | | Way forward | | 10. | Chapter 7 – Complaints Centralised Public Grievance Redress and Monitoring System (CPGRAMS) and applications under Right to Information (RTI) Act, 2005 | | | CPGRAMS | | | RTI Act, 2005 | | 11. | Appendices |
| TABLES | | Table No. | Table Title | | Table 1.1 | Total receipt of complains under the Ombudsman Schemes during past three years | | Table 1.2 | Office-wise receipt of complaints under Ombudsman Schemes for past three years | | Table 1.3 | Entity type-wise top five categories of complaints received at ORBIOs | | Table 1.4 | Complainant type-wise receipt of complaints under the Ombudsman Schemes | | Table 1.5 | Entity type-wise receipt of complaints at the ORBIOs | | Table 1.6 | Disposal and pendency position at the ORBIOs during the past three years | | Table 1.7 | Mode of disposal of maintainable complaints under the Ombudsman Schemes | | Table 1.8 | Receipt and disposal of Appeals under the Ombudsman Schemes for past three years | | Table 2.1 | Number of complaints received by OBOs | | Table 2.2 | Position of customer complaints handled by OBOs | | Table 2.3 | Entity type-wise receipt of complaints during April 1, 2021 – November 11, 2021 | | Table 2.4 | Category-wise receipt of complaints under the BOS | | Table 2.5 | Mode of disposal of maintainable complaints under BOS | | Table 2.6 | Grounds/reasons for rejection of maintainable complaints under the BOS | | Table 2.7 | Receipt and disposal of Appeals under the BOS | | Table 3.1 | Position of customer complaints handled by ONBFCOs | | Table 3.2 | NBFC Category-wise receipt of complaints during April 1, 2021 to November 11, 2021 | | Table 3.3 | Category-wise distribution of complaints | | Table 3.4 | Mode of disposal of maintainable complaints by ONBFCOs | | Table 3.5 | Grounds/reasons for rejection of maintainable complaints | | Table 3.6 | Position of Appeals – ONBFCOs | | Table 4.1 | Number of complaints received by OODTs | | Table 4.2 | Position of customer complaints handled by OODTs | | Table 4.3 | Entity type-wise break-up of complaints received at OODTs during April 1, 2021 to November 11, 2021 | | Table 4.4 | Category-wise distribution of complaints | | Table 4.5 | Mode of disposal of maintainable complaints | | Table 4.6 | Grounds/reasons for rejection of maintainable complaints | | Table 5.1 | Category-wise distribution of complaints received at ORBIOs | | Table 5.2 | Disposal of complaints at ORBIOs | | Table 5.3 | Mode of disposal of maintainable complaints under RB-IOS, 2021 | | Table 5.4 | Grounds/reasons for rejection of maintainable complaints under RB-IOS, 2021 | | Table 5.5 | Position of Appeals under RB-IOS as on March 31, 2022 | | Table 6.1 | Root Cause Analysis (RCA) 2021-22 – Major concerns, root causes identified and remedial measures |
| CHARTS | | Chart No. | Chart Title | | Chart 1.1 | Distribution of complaints among the ORBIOs | | Chart 1.2 | Geographic dispersion – Complaints received per 1 lakh accounts held | | Chart 1.3 | Mode of receipt of complaints | | Chart 1.4 | Population group-wise receipt of complaints | | Chart 1.5 | Number of complaints received from Senior Citizens at ORBIOs | | Chart 1.6 | Reasons for non-maintainable complaints | | Chart 1.7 | Total volume of disposed complaints along with their TAT | | Chart 1.8 | Comparison of TAT dispersion – erstwhile Schemes vs RB-IOS | | Chart 1.9 | Bank group-wise complaint conversion ratio | | Chart 2.1 | Mode of receipt of complaints (April 1, 2021 – November 11, 2021) | | Chart 2.2 | Zone-wise receipt of complaints (April 1, 2021 – November 11, 2021) | | Chart 2.3 | Reasons for rejection of non-maintainable complaints under BOS | | Chart 3.1 | Mode of receipt of complaints (April 1, 2021 – November 11, 2021) | | Chart 3.2 | NBFC category-wise receipt of complaints at ONBFCOs (April 1, 2021 – November 11, 2021) | | Chart 3.3 | Reasons for non-maintainable complaints | | Chart 4.1 | Mode of receipt of complaints (April 1, 2021 – November 11, 2021) | | Chart 4.2 | Zone-wise receipt of complaints (April 1, 2021 – November 11, 2021) | | Chart 4.3 | Entity-wise break-up of complaints at OODTs (April 1, 2021 – November 11, 2021) | | Chart 4.4 | Reason for non-maintainable complains: Percentage of complaints | | Chart 5.1 | Number of complaints received | | Chart 5.2 | Reason for disposal at CRPC | | Chart 5.3 | ORBIO-wise receipt of complaints | | Chart 5.4 | Mode of receipt of complaints | | Chart 5.5 | Population group-wise distribution of complaints | | Chart 5.6 | Zone-wise distribution of complaints | | Chart 5.7 | Entity group-wise classification of complaints | | Chart 6.1 | Respondent profile of the Nationwide Customer Satisfaction Survey for RB-IOS, CRPC and the Contact Center |
| APPENDICES | | Appendix No. | Appendix Title | | Appendix 1.1 | Category-wise receipt of complaints under the Ombudsman Schemes for the past three years | | Appendix 1.2 | ORBIO-wise position of Appeals received during April 1, 2021 to March 31, 2022 | | Appendix 1.3 | Office-wise Cost of handling complaints at ORBIOs | | Appendix 1.4 | Complainant group-wise classification of complaints | | Appendix 1.5 | Mode of disposal of Maintainable Complaints against Scheduled Commercial Banks | | Appendix 2.1 | Mode of receipt of complaints under the BOS (April 1, 2021 – November 11, 2021) | | Appendix 2.2 | Zone-wise receipt of complaints under the BOS (April 1, 2021 – November 11, 2021) | | Appendix 2.3 | Office-wise receipt and disposal of complaints received at OBOs during April 1, 2021 – November 11, 2021. | | Appendix 3.1 | Mode of receipt of complaints during April 1, 2021 – November 11, 2021 | | Appendix 3.2 | ONBFCO-wise position of complaints during April 1, 2021 – November 11, 2021 | | Appendix 3.3 | ONBFCO-wise position of maintainable complaints disposed during April 1, 2021 – November 11, 2021 | | Appendix 4.1 | Mode of receipt of complaints | | Appendix 4.2 | Zone-wise receipt of complaints | | Appendix 4.3 | Office-wise receipt and disposal of complaints received at OODTs during the year | | Appendix 4.4 | OODT-wise distribution of maintainable complaints | | Appendix 5.1 | Mode of receipt of complaints during November 12, 2021 to March 31, 2022 | | Appendix 5.2 | Zone-wise distribution of complaints received during November 12, 2021 to March 31, 2022 | | Appendix 5.3 | Entity group-wise classification of complaints received during November 12, 2021 to March 31, 2022 | | Appendix 6.1 | Important notifications relating to Customer Service issued by RBI in 2021-22 (Apr-Mar) | | Appendix 6.2 | Number of awareness programmes conducted during April 1, 2021 to March 31, 2022 | | Appendix 7.1 | Position of complaints received by ORBIOs through CPGRAMS | | Appendix 7.2 | Applications received by ORBIOs under RTI Act, 2005 |
SELECT ABBREVIATIONS | AA | Appellate Authority | | ADR | Alternate Dispute Resolution | | AEPS | Aadhar Enabled Payment System | | AFA | Additional Factor of Authentication | | AGR | Alternate Grievance Redress | | AI | Artificial Intelligence | | APBS | Aadhaar Payment Bridge System | | ARC | Asset Reconstruction Company | | ATM | Automated Teller Machine | | BBPCU | Bharat Bill Payment Central Unit | | BBPOU | Bharat Bill Payment Operating Unit | | BBPS | Bharat Bill Payment System | | BC | Business Correspondent | | BCSBI | Banking Codes and Standards Board of India | | BO | Banking Ombudsman | | BOS | Banking Ombudsman Scheme | | BSBDA | Basic Savings Bank Deposit Account | | CC | Contact Center | | CDD | Customer Due Diligence | | CEPC | Consumer Education and Protection Cell | | CEPD | Consumer Education and Protection Department | | CIBIL | Credit Information Bureau of India Limited | | CIC | Credit Information Company | | CKYCR | Central KYC Records Registry | | CMS | Complaint Management System | | CNP | Card Not Present | | CPGRAMS | Centralised Public Grievance Redress and Monitoring System | | CRPC | Centralised Receipt and Processing Center | | CTS | Cheque Truncation System | | DC | Debit Card | | DG | Deputy Governor | | DLA | Digital Lending Application | | DO | Dealing Official | | DRBIO | Deputy RBI Ombudsman | | DSA | Direct Selling Agent | | ECS | Electronic Clearing Service | | EMI | Equated Monthly Instalment | | FB | Foreign Bank | | FIDD | Financial Inclusion and Development Department | | FPC | Fair Practices Code | | FRC | First Resort Complaint | | FSWM | Financially Sound and Well Managed | | GoI | Government of India | | HFC | Housing Finance Company | | IGR | Internal Grievance Redress | | IMPS | Immediate Payment System | | IO | Internal Ombudsman | | IRDAI | Insurance Regulatory and Development Authority of India | | IVRS | Interactive Voice Response System | | IWG | Internal Working Group | | KYC | Know Your Customer | | MITC | Most Important Terms and Conditions | | NACH | National Automated Clearing House | | NBFC | Non-Banking Financial Company | | NBFCO | NBFC Ombudsman | | NBPSP | Non Bank Payment System Participant | | NEFT | National Electronic Funds Transfer | | NETC | National Electronic Toll Collection | | NHB | National Housing Bank | | NPCI | National Payments Corporation of India | | OBO | Office of Banking Ombudsman | | ODR | Online Dispute Resolution | | ODT | Ombudsman for Digital Transactions | | ONBFCO | Office of the NBFC Ombudsman | | OODT | Office of Ombudsman for Digital Transactions | | ORBIO | Office of Reserve Bank of India Ombudsman | | OSDT | Ombudsman Scheme for Digital Transactions | | OSNBFC | Ombudsman Scheme for NBFCs | | PB | Payment Bank | | PD | Primary Dealer | | PIN | Personal Identification Number | | PMAY | Pradhan Mantri Awas Yojana | | PML | Prevention of Money Laundering | | PPI | Prepaid Payment Instrument | | PSO | Payment System Operator | | Pvt.SB | Private Sector Bank | | QR | Quick Response | | RBI | Reserve Bank of India | | RBIO | Reserve Bank of India Ombudsman | | RB-IOS | Reserve Bank – Integrated Ombudsman Scheme | | RCA | Root Cause Analysis | | RE | Regulated Entity | | RRB | Regional Rural Bank | | RTGS | Real Time Gross Settlement | | RTI | Right to Information | | SBI | State Bank of India | | SCB | Scheduled Commercial Bank | | SEBI | Securities and Exchange Board of India | | SFB | Small Finance Bank | | SMS | Short Message Service | | S-UCB | Scheduled Urban Cooperative Bank | | TAT | Turn Around Time | | TRAI | Telecom Regulatory Authority of India | | UCB | Urban Cooperative Bank | | UPI | Unified Payments Interface | | Y-o-Y | Year-on-Year |
Foreword
Anil Kumar Sharma
Executive Director & Appellate Authority The Annual Report of Ombudsman Schemes, 2021-22 marks an important juncture in the history of the Alternate Grievance Redress (AGR) framework of RBI. The year witnessed launch of Reserve Bank - Integrated Ombudsman Scheme (RB-IOS), 2021 which integrated the erstwhile three Ombudsman Schemes of RBI and brought the Non-Scheduled Urban Cooperative Banks with deposit size above ₹50 crore under its ambit. As an outcome of Centralization in the form of a CRPC, Automation of some processes in the form of initial processing by the CMS and Simplification in the form of removal of limited grounds of complaints and adoption of “deficiency in service” as a single broadbased ground for lodgement of complaints, the RB-IOS made the AGR efficient and faster. Setting up a Contact Centre for providing support in lodging complaints and providing information on the AGR has further added to the ease of lodging complaints. It is satisfying to note that the Ombudsman mechanism achieved a disposal rate of 97.97%, despite this being a transition year and despite an increase in the receipt of complaints over the previous year. The year also witnessed scaling up of the awareness generation drive with “Ombudsman Speak” on the eve of World Consumer Rights Day in March 2022 and in September 2022. This was supplemented by a “Talkathon” with the media in August and “All India Intensive Awareness Campaign” run during the month of November 2022 in collaboration with the Regulated Entities. This Annual Report is the first under the RB-IOS and thus, sets a new benchmark and creates a new legacy and I hope all stakeholders will find it useful. Sd/- (Anil Kumar Sharma)
EXECUTIVE SUMMARY The year 2021-22 marked a major milestone for the Ombudsman mechanism of RBI as it witnessed the integration of the three erstwhile Ombudsman Schemes viz., Banking Ombudsman Scheme (BOS) 2006, Ombudsman Scheme for Non-Banking Financial Companies (OSNBFC) 2018, and Ombudsman Scheme for Digital Transactions (OSDT) 2019 into the Reserve Bank - Integrated Ombudsman Scheme (RB-IOS), 2021, that was launched by the Hon’ble Prime Minister on November 12, 2021. Along with its launch, the Centralised Receipt and Processing Center (CRPC) was also established at RBI, Chandigarh to receive complaints through email/physical mode from across the country and handle the initial scrutiny and processing of these complaints before assigning the maintainable ones to Offices of RBI Ombudsman (ORBIOs) for further redressal. The CRPC also hosts a Contact Center to assist complainants in lodging their complaints, providing them information regarding redressal mechanism at RBI and awareness messages related to safe banking practices in ten regional languages (Assamese, Bengali, Gujarati, Kannada, Oriya, Punjabi, Malayalam, Marathi, Tamil and Telugu) apart from Hindi and English. A brief analysis of complaints handled under the three erstwhile Ombudsman Schemes (BOS, OSNBFC and OSDT) between April 1 and November 11, 2021 is as under: a) BOS: The total number of complaints received by the 22 Offices of the Banking Ombudsman (OBOs) between April 1 and November 11, 2021 was 2,09,196. Around 90% of the total complaints were received through digital modes, including on the online Complaint Management System (CMS) portal, email, and Centralised Public Grievance Redress and Monitoring System (CPGRAMS). The North Zone, with eight of the 22 OBOs, received the highest volume (42.70%) of complaints, followed by the West and the South Zones. Share of complaints related to ATM/ Debit Cards, at 14.65% of the total, were the highest followed by complaints related to Mobile/ Electronic Banking at 13.64%. Majority (66.11%) of the maintainable complaints were resolved through mutual settlement/ conciliation/ mediation and a total of 17 Awards were issued under BOS. During the year 51 Appeals were received against the decisions of the Banking Ombudsmen (BOs) under BOS. b) OSNBFC: The number of complaints received at the four Offices of NBFC Ombudsman (ONBFCO) between April 1 and November 11, 2021 was 20,439. Complaints relating to ‘Non-adherence of Fair Practices Code (FPC)’ were the highest, constituting 61.89% of the total, followed by complaints regarding ‘Non-observance of RBI directions’ and ‘Levy of Charges without prior notice’. Majority (70.08%) of the maintainable complaints were resolved through mutual settlement/ conciliation/ mediation and 12 Awards were issued under OSNBFC. During the year 10 Appeals were filed with Appellate Authority against the decisions of the NBFC Ombudsmen (NBFCOs). c) OSDT: The number of complaints received by the 22 Offices of Ombudsman for Digital Transactions (OODTs) between April 1 and November 11, 2021 was 2,281. Complaints relating to fund transfers/ UPI/ BBPS/ Bharat QR Code constituted the largest share of complaints i.e., 44.76%. Majority (59.65%) of maintainable complaints were resolved through mutual agreement/ conciliation /mediation process. No Appeal was received under OSDT between April 1 and November 11, 2021. The rate of disposal under the three erstwhile Ombudsman Schemes stood at 100%, as all complaints brought forward and received between April 1 and November 11, 2021 were disposed by March 31, 2022. d) RB-IOS, 2021: Under the RB-IOS, 2021, following the ‘One Nation, One Ombudsman’ principle, the territorial jurisdictions for the ORBIOs have been abrogated, and complaints are assigned to all the ORBIOs by the CMS. Grounds of complaint covered under the RB-IOS have also been expanded to cover all complaints involving “deficiency of service”, which has been defined under the scheme. The CMS was upgraded to align with the requirements under RB-IOS, 2021 to improve its overall efficiency. The coverage of RB-IOS was extended to include the non-scheduled Urban Cooperative Banks (UCBs) with a deposit size of ₹50 crore or above as at the end of previous Financial Year. Credit Information Companies (CICs) were brought under RBI-IOS with effect from September 1, 2022. Between November 12 and March 31, 2022, a total of 1,86,268 complaints were received under the RB-IOS. The CRPC handled the preliminary scrutiny of the complaints received through email/ physical mode (i.e. 1,49,419 complaints) and closed 1,07,821 complaints as non-complaints/ non-maintainable complaints during the period. A total of 72,580 complaints were assigned to the ORBIOs from the CMS portal directly or through CRPC for redress during this period. A total of 31 Appeals were received against the decisions of ORBIOs and all such Appeals were filed by the complainants. Four Awards were issued by the ORBIOs during the period. Under the erstwhile three Schemes and the RB-IOS, during the period April 1, 2021 to March 31, 2022, total number of complaints received at the ORBIOs and the CRPC, stood at 4,18,184, showing an increase of 9.39% over last year. Of these, 3,04,496 complaints were handled by the 22 ORBIOs. The overall disposal rate for the year at the ORBIOs stood at 97.97%. A total of 33 Awards were issued by the ORBIOs and 92 Appeals were received against the decisions of the RBI Ombudsmen (RBIOs) during the year. Other Developments during the year Apart from the launch of the RB-IOS, 2021 along with the setting up of the CRPC and Contact Center, several steps were undertaken to strengthen grievance redress system: -
A Nationwide Customer Satisfaction Survey to assess the satisfaction level of the complainants who had approached the RBIOs for redress of their grievances was undertaken through a third-party agency, which indicated the overall satisfaction level of the complainants at 59.55%. -
The annual Root Cause Analysis for the year 2022 was conducted and necessary action initiated based on the causes identified. -
All medium-term strategic milestones (11) identified for CEPD in terms of Utkarsh 2022 were completed. -
The ambit of RB-IOS, 2021 was extended to Credit Information Companies (CICs) with effect from September 1, 2022. -
The RBIOs conducted 29 town-hall events and 175 awareness programmes during the year. These events were focused on avenues of grievance redress and consumer protection issues. -
Nationwide Awareness Campaign was launched on the World Consumer Rights Day on March 15, 2022, to strengthen the on-going financial awareness and education by the department and Ombudsman Offices. Two phases of the programme have been completed so far. Way forward During the period April 1, 2022 to March 31, 2023, CEPD will work towards the following action plans: -
Review of the guidelines on under “Strengthening of grievance redress framework for banks” issued in January 2021. -
Extension of the RB-IOS, 2021 to more REs that are not covered presently under the Scheme. -
Extension of Internal Ombudsman (IO) Scheme for Credit Information Companies (CICs) and Housing Finance Companies (HFCs). -
Further initiatives under the nationwide awareness campaign to reach the remote and untouched regions and hitherto excluded segments of population. -
Further enhance the efficiency & ease of usage of CMS. -
Upgrade the Contact Centre and cater for Business Continuity and Disaster Recovery requirements. Appropriate regulatory initiatives regarding financial consumer protection will be further enhanced to identify issues to address and improve the grievance redress mechanism of REs as well as the RBI, and measures for implementation of the framework for financial education shall be enhanced.
Chapter 1: The Ombudsman Schemes of RBI: Activities during April 1, 2021 to March 31, 2022 The three erstwhile Ombudsman Schemes of RBI for banks, Non-Banking Financial Companies (NBFCs) and Non-Bank Payment System Participants (NBPSPs) were integrated into the ‘Reserve Bank – Integrated Ombudsman Scheme (RB-IOS), 2021 with effect from November 12, 2021. This Chapter presents the activities under the erstwhile Schemes as well as RB-IOS, 2021 in an integrated form for the year 2021-22. The launch of RB-IOS, 2021 was accompanied by setting-up of the Centralized Receipt and Processing Center (CRPC) along with a Contact Centre, at the Chandigarh Regional Office of RBI. The CRPC handles preliminary scrutiny and processing of all email and physical complaints received under RBI’s Alternate Grievance Redress (AGR) mechanism and converts them into complaints in the Complaint Management System (CMS) portal. The CRPC also weeds out certain non-maintainable complaints and assigns through CMS the maintainable complaints to the 22 Offices of RBI Ombudsman (ORBIOs) for redressal/adjudication under RB-IOS, 2021. The Contact Center, hosted at CRPC, assists/ guides the customers of the Regulated Entities (REs) to lodge their complaints with the RBI Ombudsman, check the status of already lodged complaints and provides them information related to the AGR mechanism of RBI, safe banking practices etc. Consumer Education and Protection Cells (CEPCs) functioning from 30 Regional Offices (ROs) of RBI handle those complaints against REs that are yet to be covered under RB-IOS, 2021. The total number of complaints received by RB-IOS and CEPCs during April 1, 2021 to March 31, 2022 stood at 4,18,184 as against 3,82,292 complaints during the same period in 2020-21, marking an annual growth of 9.39%. Of these, 3,04,496 complaints were handled by the 22 Offices of RBI Ombudsman (ORBIOs), including the complaints received under the three erstwhile Ombudsman Schemes till November 11, 2021. During the period, 1,07,821 complaints were disposed of the 1,13,688 complaints received at the CRPC since its creation, viz., November 12, 2021. Complaints relating to the digital modes of payment and transactions were the highest in number, constituting 42.12% of the total complaints received during the year. The rate of disposal of complaints by RBIOs improved to 97.97% in 2021-22 from 96.59% in 2020-21. Majority (63.63%) of the maintainable complaints were resolved through mutual settlement /conciliation /mediation. Thirty-three (33) Awards were issued against REs by the RBI Ombudsmen (RBIOs) during the year. Ninety-two (92) Appeals were received against the decisions of the RBIOs in 2021-22, of which 31 were received under the RB-IOS, 2021. | 1.1 The Banking Ombudsman Scheme (BOS) was launched as an AGR mechanism with a view, inter-alia, to promote expeditious, cost free and efficient redressal of customer complaints that had not been satisfactorily redressed by the banks. The Scheme was last amended in 2017 to align it with the changes in the banking landscape. Due to the growing significance of NBFCs in the financial system and rising share of NBPSPs, the Ombudsman Scheme for the NBFCs (OSNBFCs) was launched in 2018 and the Ombudsman Scheme for Digital Transactions (OSDT) was launched in 2019. 1.2 The three erstwhile schemes had limited, specified and varying grounds of complaints which acted as a limiting factor and led to uneven redress across the customers of different REs. Hence, based on the recommendations of an internal Working Group, the three Ombudsman Schemes were integrated into RB-IOS, 2021. Based on the principle of ‘One nation, One Ombudsman’, the jurisdictions of the Ombudsmen offices were done away to ensure equal distribution of complaints across all 22 offices. The grounds of complaints were broad based to include all complaints involving “deficiency in service”. The Scheme was launched by the Hon’ble Prime Minister on November 12, 2021. With a view to provide one address and one email ID for lodging physical and email complaints from anywhere in the country, a CRPC was established at RBI, Chandigarh, along with a Contact Center available at a toll-free number (14448) to provide guidance on lodging complaints and information on complaints and AGR mechanism to the complainants in Hindi, English and 10 regional languages1 available during 9:30 AM to 5:15 PM on weekdays (except banking holidays) and through Interactive Voice Response System (IVRS) on 24x7 basis. Receipt of complaints 1.3 The details relating to the total number of complaints received under the erstwhile Ombudsman Schemes (BOS, OSNBFC and OSDT) during the past three years and the RB-IOS, 2021 are provided in Table 1.1. | Table 1.1: Total receipt of complaints under the Ombudsman Schemes during past three years | | Scheme | 2019-20
(Jul-Jun) | 2020-21
(Apr-Mar) | 2021-22
(Apr-Mar) | | | Number | Share (%) | Number | Share (%) | Number | Share(%) | | BOS | 3,08,630 | 93.37 | 3,41,747 | 89.39 | 2,09,196 | 50.02 | | OSNBFC | 19,432 | 5.88 | 36,951 | 9.67 | 20,439 | 4.89 | | ODT | 2,481 | 0.75 | 3,594 | 0.94 | 2,281 | 0.54 | | RB-IOS2 | - | | - | | 72,580 | 17.35 | | Sub Total | 3,30,543 | 100.00 | 3,82,292 | 100.00 | 3,04,496 | 72.81 | | CRPC3 | - | - | - | - | 1,13,6884 | 27.19 | | Total | 3,30,543 | 100.00 | 3,82,292 | 100.00 | 4,18,184 | 100.00 | | % Change | 64.97 | | 15.7 | | 9.39 | | ORBIO-wise receipt (prior to November 12, 2021) and allocation (November 12, 2021 onwards) of complaints 1.4 ORBIO wise receipt/ allocation of complaints under the Ombudsman Schemes during the past three years is given in Table 1.2: | Table 1.2: Office wise receipt of complaints under Ombudsman Schemes for past three years | | ORBIO | 2019-20
(Jul – Jun) | 2020-21
(Apr – Mar) | 2021-22
(Apr – Mar) | BOS | OSDT | OSNBFC | RB-IOS | | Volume | Share | 2021-22 | | Ahmedabad | 16,082 | 21,078 | 16,426 | 5.39% | 12,634 | 94 | | 3,698 | | Bengaluru | 18,697 | 17,407 | 13,996 | 4.60% | 10,356 | 189 | | 3,451 | | Bhopal | 14,677 | 15,787 | 12,841 | 4.22% | 9,562 | 138 | | 3,141 | | Bhubaneswar | 5,386 | 6,920 | 7,806 | 2.56% | 4,585 | 94 | | 3,127 | | Chandigarh | 31,702 | 36,619 | 20,270 | 6.66% | 17,038 | 73 | | 3,159 | | Chennai | 21,157 | 27,446 | 21,396 | 7.03% | 13,137 | 116 | 4,415 | 3,728 | | Dehradun | 7,913 | 7,970 | 8,342 | 2.74% | 5,470 | 28 | | 2,844 | | Guwahati | 3,661 | 3,543 | 5,444 | 1.79% | 2,425 | 27 | | 2,992 | | Hyderabad | 20,143 | 22,161 | 15,212 | 5.00% | 11,404 | 204 | | 3,604 | | Jaipur | 18,285 | 22,094 | 18,145 | 5.96% | 14,794 | 129 | | 3,222 | | Jammu | 1,538 | 1,767 | 4,300 | 1.41% | 1,331 | 25 | | 2,944 | | Kanpur | 24,026 | 26,499 | 24,214 | 7.95% | 20,872 | 115 | | 3,227 | | Kolkata | 13,146 | 17,160 | 14,766 | 4.85% | 9,192 | 201 | 1,870 | 3,503 | | Mumbai I | 19,649 | 22,479 | 18,806 | 6.18% | 15,035 | 186 | | 3,585 | | Mumbai II | 26,155 | 30,999 | 20,672 | 6.79% | 11,261 | 182 | 5,526 | 3,703 | | New Delhi I | 18,289 | 23,238 | 15,310 | 5.03% | 11,836 | 137 | | 3,337 | | New Delhi II | 27,829 | 34,673 | 24,259 | 7.97% | 12,377 | 106 | 8,628 | 3,148 | | New Delhi III | 9,644 | 11,091 | 8,883 | 2.92% | 5,606 | 42 | | 3,235 | | Patna | 17,514 | 17,456 | 13,606 | 4.47% | 10,369 | 130 | | 3,107 | | Raipur | 3,705 | 4,018 | 5,362 | 1.76% | 2,217 | 26 | | 3,119 | | Ranchi | 4,622 | 4,765 | 6,307 | 2.07% | 3,189 | 29 | | 3,089 | | Thiruvananthapuram | 6,723 | 7,122 | 8,133 | 2.67% | 4,506 | 10 | | 3,617 | | Total | 3,30,543 | 3,82,292 | 3,04,496 | 100.00% | 2,09,196 | 2,281 | 20,439 | 72,580 | 1.6 As mentioned in para 1.2 above, the structural changes in the Ombudsman framework under RB-IOS 2021, particularly the setting up of CRPC for handling email and physical complaints and initial assessment on maintainability of complaints in CMS. have brought down the number of complaints handled by ORBIOs during 2021-22. During this period, the highest volume of complaints under the erstwhile Schemes were handled by ORBIO - New Delhi II at 7.97% of the total, followed by Kanpur and Chennai, while ORBIOs - Jammu, Raipur and Guwahati received the lowest volumes of complaints. 1.7 Post launch of RB-IOS, 2021, based on the ‘One Nation, One Ombudsman’ approach, the divergence in the number of complaints handled at different ORBIOs has been minimized and are primarily on account of physical complaints in regional languages and variation in the size of the office, as complaints are since assigned to ORBIOs according to a pre-defined algorithm embedded in CMS. The same can be observed in the Table 1.2 above and the Chart 1.15 given below: Geographic dispersion of complaints across the states 1.8 An analysis on the geographic dispersion of complaints received under the Ombudsman Schemes/ RB-IOS during the year across the states in the country, in proportion to the total number of accounts held (deposit and credit) by Scheduled Commercial Banks in the respective states is depicted in the map (Chart 1.2) given subsequently. The figure presented is based on complaints received per 1 lakh accounts held in the respective States/ Union Territories (UTs), as on March 31, 2022. 1.9 Major observations on geographical distribution of complaints are as follows: -
NCT of Delhi, Chandigarh, Haryana, Gujarat, and Maharashtra were the top five states/UTs to contribute to Ombudsman complaints, while Arunachal Pradesh, Meghalaya, Manipur, Nagaland, and Mizoram were the lowest contributors. -
The trends representing top five state/UTs could be attributed to higher awareness levels, better availability and higher usage of financial services, physical and broadband connectivity, etc. as compared to the other regions. -
Awareness about avenues of redress tends to be higher in metro/urban areas as per the Satisfaction Survey conducted in 2021. Modes of receipt of complaints 1.10 Complaints can be received online (through CMS portal/ CPGRAMS), through email or as physical complaints, with the CMS portal mode being the most efficient mode of complaint registration. The break-up on complaints received through the different modes of receipt in the past three years is given below (Chart 1.3). 1.11 It is observed that the CMS portal retains the highest share of complaints received/ assigned to ORBIOs. However, physical complaints have witnessed an uptick in the current year compared to the previous year, especially post launch of the RB-IOS, 2021. This could be ascribed to the convenience arising from a single address to send the physical complaints from anywhere in the country under the “One Nation One Ombudsman” approach adopted under RB-IOS. This data excludes email and physical complaints closed at CRPC which is detailed in para 1.6 of this report. Category-wise receipt of complaints 1.12 Complaints against banks formed the largest portion, accounting for 88.04% of complaints received by the ORBIOs. The top 5 categories of complaints against each entity type are represented in Table 1.3 below. The complete list of ground wise receipt of complaints is given in the Appendix 1.1. | Table 1.3: Entity type wise top five category of complaint receipt at ORBIOs | | Nature of Complaints | 2019-20
(Jul-Jun) | 2020-21
(Apr-Mar) | 2021-22
(Apr-Mar) | | Complaints against banks | | ATM / Debit Cards | 67,800 | 60,203 | 41,375 | | | 21.97% | 17.62% | 15.43% | | Mobile / electronic banking | 41,310 | 44,385 | 39,388 | | | 13.38% | 12.99% | 14.69% | | Credit Cards | 28,713 | 40,721 | 32,162 | | | 9.30% | 11.92% | 12.00% | | Loans and advances | 16,437 | 20,218 | 24,507 | | | 5.33% | 5.92% | 9.14% | | Non-observance of Fair Practices Code (FPC) | 36,215 | 33,898 | 24,446 | | | 11.73% | 9.92% | 9.12% | | Others | 118,155 | 142,322 | 106,207 | | | 38.28% | 41.65% | 39.62% | | Total (Banks) | 3,08,630 | 3,41,747 | 2,68,085 | | % Banks to Total complaints | 93.37% | 89.39% | 88.04% | | Complaints against NBFCs | | Loans & Advances related / Non-adherence to FPC | 7,052 | 17,915 | 18,729 | | | 36.29% | 48.48% | 56.22% | | Non-observance of RBI directions | 3,607 | 6,114 | 1,881 | | | 18.56% | 16.55% | 5.65% | | Levy of charges without prior notice | 1,628 | 3,189 | 1,751 | | | 8.38% | 8.63% | 5.26% | | Non-transparency in contract/ loan | 1,704 | 1,833 | 512 | | | 8.77% | 4.96% | 1.54% | | Delay in repayment of deposits | 395 | 536 | 319 | | | 2.03% | 1.45% | 0.96% | | Others | 5,046 | 7,364 | 10,122 | | | 25.97% | 19.93% | 30.38% | | Total (NBFCs) | 19,432 | 36,951 | 33,314 | | % NBFCs to Total complaints | 5.88% | 9.67% | 10.94% | | Complaints against NBPSPs | | Mobile/Electronic Fund Transfers / Mobile/Electronic Banking | 598 | 824 | 1,209 | | | 24.10% | 22.93% | 39.04% | | Fund Transfers/ UPI/ BBPS/ Bharat QR Code | 1,089 | 1,775 | 951 | | | 43.89% | 49.39% | 30.71% | | Prepaid Payment Instruments (PPI) | 198 | 253 | 218 | | | 7.98% | 7.04% | 7.04% | | Non-reversal of Funds due to Wrong Beneficiary Transfer by System Participant | 218 | 291 | 186 | | | 8.79% | 8.10% | 6.01% | | Violation of RBI Directives in relation to Fees/Charges | 58 | 100 | 61 | | | 2.34% | 2.78% | 1.97% | | Others | 320 | 351 | 472 | | | 12.90% | 9.77% | 15.24% | | Total (NBPSPs) | 2,481 | 3,594 | 3,097 | | % NBPSPs to Total complaints | 0.75% | 0.94% | 1.02% | | | | | | | Grand Total | 3,30,543 | 3,82,292 | 3,04,496* | | * Apart from the figures given in the above table, 1,13,688 complaints were closed at CRPC during 2021-22 under RB-IOS. | 1.13 Major observations are as under: -
Complaints relating to ATM/ Debit Cards have witnessed a decline over the past three years; Share of complaints related to mobile banking/ electronic banking has seen a slight increase. -
Share of complaints in respect of Loans and Advances has increased, mainly due to complaints against FPC being classified under ‘Loans and Advances’ since the launch of RB-IOS, 2021. This justifies the decline in FPC complaints. -
Post dissolution of Banking Codes and Standards Board of India (BCSBI) and the launch of RB-IOS, complaints against BCSBI codes have also been diverted to other categories, including ‘Loans and Advances’. -
Loans and Advances contribute to majority of complaints against NBFCs, followed by non-adherence to FPC, which is also indirectly related to Loans and Advances. 1.14 In addition to the above, marginal movement in a few categories is due to recategorization of ’Grounds’ of complaints in CMS post the launch of RB-IOS. Increase in share of complaints under “Loans and Advances” is contributed by diversion of certain complaints from the ‘BCSBI codes’. Population group-wise distribution of complaints 1.15 The population group wise receipt of complaints under the Ombudsman Schemes for the past three years is given in the Chart 1.4. Majority of complaints are received from metropolitan regions, followed by Urban and Semi-urban. After launch of RB-IOS with effect from November 12, 2021 there is a decline in complaints received from rural, semi-urban and metropolitan areas, while a substantive spurt in the complaints received from urban areas. Complainant-type wise receipt of complaints 1.16 The complainant type wise receipt of complaint under the Ombudsman Schemes during the past three years is given in the Table 1.4 below: | Table 1.4: Complainant type wise receipt of complaints under the Ombudsman Schemes | | Complainant Type | 2019-20
(Jul-Jun) | 2020-21
(Apr-Mar) | 2021-22
(Apr-Mar) | | Individual | 2,73,432 | 3,05,093 | 2,43,244 | | 82.72% | 79.81% | 79.88% | | Individual – Business | 10,831 | 13,614 | 10,400 | | 3.28% | 3.56% | 3.42% | | Proprietorship/ Partnership | 5,583 | 7,505 | 6,712 | | 1.69% | 1.96% | 2.20% | | Limited Company | 6,917 | 8,381 | 7,427 | | 2.09% | 2.19% | 2.44% | | Trust | 559 | 665 | 613 | | 0.17% | 0.17% | 0.20% | | Association | 446 | 372 | 427 | | 0.13% | 0.10% | 0.14% | | Government Department | 5,180 | 6,447 | 4,993 | | 1.57% | 1.69% | 1.64% | | PSU | 1,297 | 1,475 | 1,799 | | 0.39% | 0.39% | 0.59% | | Senior Citizen | 8,237 | 10,061 | 9,244 | | 2.49% | 2.63% | 3.04% | | Others | 18,061 | 28,679 | 19,637 | | 5.46% | 7.50% | 6.45% | | Total | 3,30,543 | 3,82,292 | 3,04,496* | | * Apart from the figures given in the above table, 1,13,688 complaints were closed at CRPC during 2021-22 under RB-IOS. | 1.17 It is seen that individuals constitute close to 80% of complainants. However, complaints from Senior Citizens have risen in percentage terms, even though number of these complaints has come down during 2021-22. It is also observed, as depicted in Chart 1.5, that the complaints received from senior citizens went up during the first six months of the Financial Year and declined appreciably in the later months. Entity-type wise receipt of complaints 1.18 Entity-type wise receipt of complaints for the past three years under the Ombudsman Schemes is presented in Table 1.5. | Table 1.5: Entity-type wise receipt of complaints at the ORBIOs | | | Overall | All 3 OS | RBIOS | Percentage Change | | Entity Group | 2019-20 | 2020-21
(Apr-Mar) | 2021-22
(Apr-Mar) | 2021-22 | 2021-22 | (Y-o-Y) | | (Jul-Jun) | | Public Sector Banks | 1,84,087 | 1,74,974 | 1,54,725# | 1,19,143 | 35,582 | -11.57% | | 55.69% | 45.77% | 50.81% | 51.37% | 49.02% | | Private Sector Banks | 98,623 | 1,26,303 | 94,275 | 72,703 | 21,572 | -25.36% | | 29.84% | 33.04% | 30.96% | 31.35% | 29.72% | | Payments and Small Finance Banks | 5,227 | 6,918 | 8,076 | 6,100 | 1,976 | 16.74% | | 1.58% | 1.81% | 2.65% | 2.63% | 2.72% | | Foreign Banks | 5,935 | 6,157 | 4,464 | 3,188 | 1,276 | -27.50% | | 1.80% | 1.61% | 1.47% | 1.37% | 1.76% | | RRBs/ Urban Co-op. Banks | 6,060 | 6,382 | 6,508 | 4,292 | 2,216 | 1.97% | | 1.83% | 1.67% | 2.14% | 1.85% | 3.05% | | NBFC | 15,285 | 31,158 | 22,317 | 18,084 | 4,233 | -28.37% | | 4.62% | 8.15% | 7.33% | 7.80% | 5.83% | | PPI/BBPOU | 2,172 | 3,168 | 3,040 | 2,064 | 976 | -4.04% | | 0.66% | 0.83% | 1.00% | 0.89% | 1.34% | | Others | 13,154 | 27,232 | 11,091 | 6,342 | 4,749 | -59.27% | | 3.98% | 7.12% | 3.64% | 2.73% | 6.54% | | Total | 3,30,543 | 3,82,292 | 3,04,496* | 2,31,916 | 72,580 | -20.35% | #Includes complaints received against SBI Cards which was included under BOS until the launch of RB-IOS.
* Apart from the figures given in the above table, 1,13,688 complaints were closed at CRPC during 2021-22 under RB-IOS. | 1.19 After the launch of RB-IOS, only maintainable complaints are assigned to ORBIOs post initial screening of non-maintainable/ non-complaints at the CRPC. Hence, the complaints closed at the CRPC do not get accounted for as complaints under ORBIOs as per the RB-IOS, 2021. However, the erstwhile Schemes account for all complaints/ references received at the ORBIOs. Hence, the data for 2021-22 is not comparable with previous years. Disposal of complaints 1.20 The data on disposal of complaints under the Ombudsman Schemes during the past three years, along with their age wise pendency position at the end of the year is given in Table 1.6. | Table 1.6: Disposal and pendency position at the ORBIOs during the past three years | | Number of Complaints | 2019-20
(Jul - Jun) | 2020-21
(Jul - Mar) | 2021-22
(Apr - Mar) | | Received during the year (All OS + RBIOS) | 3,30,543 | 3,03,107 | 3,04,496* | | Brought forward from previous year | 12,158 | 25,636 | 11,429 | | Complaints received by email before the start of the year but registered on or after start of the year; including complaints transferred from Consumer Education and Protection Cells on or after the start of the year | - | 6,302 | 1,589 | | Handled during the year | 3,42,701 | 3,35,045 | 3,17,514 | | Disposed during the year | 3,17,065 | 3,23,616 | 3,11,067 | | Rate of Disposal (%) | 92.52% | 96.59% | 97.97% | | Carried forward to the next year | 25,636 | 11,429 | 6,447 | | Complaints pending for less than one month (30 days) | 6,497 | 7,220 | 5,622 | | 1.90% | 2.15% | 1.77% | | Complaints pending for one to two months | 3,430 | 2,232 | 582 | | 1.00% | 0.67% | 0.18% | | Complaints pending for two to three months | 1,916 | 948 | 86 | | 0.56% | 0.28% | 0.03% | | Complaints pending for more than three months | 13,793 | 1,029 | 157 | | 4.02% | 0.31% | 0.05% | | * Apart from the figures given in the above table, 1,13,688 complaints were closed at CRPC during 2021-22 under RB-IOS. | 1.21 Observations from the table are that -
Disposal rate has improved Y-o-Y over the past three years. -
Pendency of 6,447 complaints with 157 outstanding for more than 3 months was lowest in last three years. All complaints pertaining to the years 2019-20, 2020-21 and 2021-22 stand disposed. Mode of disposal of Maintainable complaints 1.22 Under the Ombudsman Schemes, the majority of complaints are settled through conciliation and mediation efforts by the RBIOs. The mode of disposal of maintainable complaints during the past three years under the Ombudsman Schemes is given in Table 1.7. | Table 1.7: Mode of disposal of maintainable complaints under the Ombudsman Schemes | | Disposal of maintainable complaints | 2019-20
(Jul – Jun) | 2020-21
(Jul – Mar) | 2021-22
(Apr – Mar) | | By Mutual Settlement/ Agreement | 1,30,413 | 1,34,504 | 1,11,820 | | | 72.21% | 72.67% | 63.63% | | Disposal by Award | 68 | 65 | 33 | | | 0.04% | 0.04% | 0.02% | | Maintainable Complaints Rejected | 49,930 | 50,326 | 62,936 | | | 27.65% | 27.19% | 35.81% | | Maintainable Complaints Withdrawn | 182 | 197 | 952 | | | 0.10% | 0.11% | 0.54% | | Total | 1,80,593 | 1,85,092 | 1,75,741 | Reasons for closure of complaints under non-maintainable clauses 1.23 A total of 1,35,326 (42.62%) of the total handled complaints at ORBIOs were closed as non-maintainable during the year, due to reasons as mentioned in the Ombudsman Scheme. The Chart 1.6 below provides the major reasons for rejection of complaints as non-maintainable. Receipt of Appeals 1.24 Any complainant/ RE aggrieved by the decision of RBI Ombudsman can appeal before the Appellate Authority (AA) under the scheme/(s), if the complaint is closed under any of the appealable clauses as per the Scheme/(s). While the appellate mechanism under RB-IOS, 2021 remains largely unchanged, cases involving awards passed by the Ombudsmen on REs due to non-submission of requisite information/ documents by the RE, has been made non-appealable by the REs under the RB-IOS, 2021 to ensure more discipline on part of the REs. Further, the Executive Director (ED) in-charge of CEPD has been designated as the Appellate Authority under RB-IOS, 2021 for the complaints receive under RB-IOS. The receipt of appeals under the Ombudsman Schemes during the past three years is given in the Table 1.8. | Table 1.8: Receipt and disposal of Appeals under the Ombudsman Schemes for past three years | | Particulars | 2019-20
(Jul-Jun) | 2020-21
(Jul-Mar) | 2021-22
(Apr-Mar) | Break up of 2021-22 | | | OVERALL | BOS | NBFC | ODT | RB-IOS | | Appeals pending at the beginning of the year | 73 | 48 | 45 | 44 | 1 | 0 | 0 | | Appeals received during the year from complainants | 35 | 14 | 80 | 45 | 4 | 0 | 31 | | Appeals received during the year from REs | 29 | 10 | 12 | 6 | 6 | 0 | 0 | | Total appeals handled during the year | 137 | 72 | 137 | 95 | 11 | 0 | 31 | | Appeal disposed during the year | 89 | 27 | 75 | 70 | 3 | 0 | 2 | | Pending at the end of the year | 48 | 45 | 62 | 25* | 8* | 0 | 29* | | Mode of Disposal | | Appeals remanded to the RBIO | 4 | 2 | 1 | 1 | 0 | 0 | 0 | | Appeals withdrawn / settled / infructuous | 14 | 5 | 14 | 11 | 1 | 0 | 2 | | Appeals rejected | 44 | 10 | 33 | 32 | 1 | 0 | 0 | | Appeals allowed | 27 | 10 | 27 | 26 | 1 | 0 | 0 | | Appeals Disposed | | i. In favour of complainant appellant | 30 | 11 | 20 | 19 | 1 | 0 | 0 | | ii. In favour of REs | 21 | 5 | 22 | 21 | 1 | 0 | 0 | | iii. Neither in favour of complainant appellant nor in favour of REs (Remanded back to BO / infructuous) | 38 | 11 | 33 | 30 | 1 | 0 | 2 | | * All 25 BOS and 8 OSNBFC appeals pending as on March 31, 2022, have since been disposed. Of the 29 RB-IOS appeals pending up to March 31, 2022, 20 have since been disposed. | 1.25 The office wise receipt of Appeals under the erstwhile Ombudsman Schemes and RB-IOS during 2021-22 is given in the Appendix 1.2. Cost of handling a complaint 1.26 During the year 2021-22, the average cost of handling a complaint at the ORBIOs stood at ₹2,895 per complaint, as compared to ₹1,599 per complaint in 2020-21. The increase in cost is primarily due to increase in staff due to the launch of the RB-IOS, setting up of CRPC revamp of CMS and due to the wage revision of RBI employees during the year. The office-wise cost of handling complaints has been provided at Appendix 1.3. Turn Around Time (TAT) for disposal of complaints 1.27 One of the major factors impacting the level of satisfaction among the complainants is the time taken for redressal of their grievance. Based on the recommendations of the ‘Internal Working Group to review the Ombudsman Schemes’, to improve the TAT of complaints to 30 days in a phased manner, focussed efforts continue to be made in this direction. 1.28 It can be observed from the Chart 1.7 that TAT of complaint redress at ORBIOs has been improving continuously for the past three years. The TAT is expected to improve further with better systems in place streamlining of CRPC and the Contact Centre. 1.29 Further, the dispersion of TAT across complaints has also reduced significantly in the RB-IOS, 2021 as compared to the erstwhile Schemes. Under the old schemes, a total of 2.45 lakh complaints were disposed during 2021-22 with TAT of 46 Days, whereas under RB-IOS, around 66 thousand complaints were disposed with TAT of 38 Days. Granular data is shown using boxplot to reflect the dispersion in TAT in the Chart 1.86 below, indicating lesser dispersion under the new Scheme.
Bank-group wise complaint conversion rate 1.30 Several measures have been taken by RBI to propel the REs to redress complaints effectively and efficiently under their internal grievance redress system and to minimise the need for escalation thereof to the alternate redressal forums, including the RB-IOS. The steps include establishment of IO mechanism in banks to review the partly/ wholly rejected complaints, the issuance of guidelines on Strengthening of grievance redress mechanism in RBI in January 2021, which put in place a system for recovery of the cost of handling complaints under RB-IOS from the outlier banks, and the setting up of the CRPC along with the auto filtering of non-maintainable complaints in the upgraded CMS portal of RBI. 1.31 The complaint conversion rate represents the proportion of complaints received against the concerned bank group at the ORBIOs during the years ended 2021 and 2022, as compared to total volume of complaints received at the banks’ end from their customers. As seen from the Chart 1.9 given below, all bank groups have significantly improved on the conversion rates except Small Finance Banks.
Chapter 2: Banking Ombudsman Scheme (BOS) 2006, as amended upto July 01, 2017: Activities during April 1, 2021 to November 11, 2021 Since BOS 2006 was integrated into the RB-IOS, 2021 with effect from November 12, 2021, this chapter presents the activities pertaining to BOS during the period April 1, 2021 to November 11, 2021. The number of complaints received by the 22 Offices of the Banking Ombudsman (OBOs) during April 1, 2021, to November 11, 2021 was 2,09,196. The rate of disposal of complaints stood at 100% during this period, as all complaints pertaining to the erstwhile Ombudsman Schemes were disposed as on March 31, 2022. Complaints pertaining to ATM/ Debit Cards constituted the largest share at 14.65%. Around 66.11% of maintainable complaints were resolved through mutual agreement/ conciliation /mediation. The share of complaints received under BOS lodged through digital modes, including the 24x7 online CMS portal, emails and CPGRAMS stood at 89.65%. During the year, 17 Awards were passed under the BOS. 51 Appeals were received against the decisions of the Banking Ombudsmen. | Receipt of complaints 2.1 The BOS, 2006 was administered through 22 Offices of the Banking Ombudsman (OBOs) spread across the country and covering their respective territorial jurisdictions. During April 1, 2021 to November 11, 2021, a total of 2,09,196 complaints were received at the OBOs after which the BOS was integrated into the RB-IOS, 2021 with effect from November 12, 2021. The year-wise number of complaints received at OBOs in last three years is given in Table 2.1 | Table 2.1 – Number of complaints received by OBOs | | | 2019-20
(Jul-Jun) | 2020-21
(Apr-Mar) | 2021-22
(Apr 1, 2021 - Nov 11, 2021)* | | Complaints received during the year | 3,08,630 | 3,41,747 | 2,09,196 | | *BOS 2006 was integrated into the RB-IOS 2021, with effect from November 12, 2021. | 2.2 The position of customer complaints handled by OBOs during the year till the launch of RB-IOS, 2021 in November 2021 is tabulated in Table 2.2, along with age-wise pendency position. | Table 2.2 - Position of customer complaints handled by OBOs | | Particulars | 2019-20
(Jul – Jun) | 2020-21
(Jul - Mar) | 2021-22
(Apr 1, 2021 - Nov 11, 2021) | | Brought forward from previous year | 12,069 | 24,498 | 10,082 | | Complaints received by Email before June 30, 2020 but registered on or after July 01, 2020; including complaints transferred from Consumer Education and Protection Cells on or later than July 01, 2020 | - | 4,789 | 1,255 | | Received during the year | 3,08,630 | 2,73,204 | 2,09,196 | | Handled during the year | 3,20,699 | 3,02,491 | 2,20,533 | | Disposed during the year | 2,96,201 | 2,92,409 | 2,20,533 | | Rate of Disposal (%) | 92.4% | 96.7% | 100.0% | | Carried forward to the next year | 24,498 | 10,082 | - | | Complaints pending for less than one month (30 days) | 6,086 | 6543 | 0 | | 2.05% | 2.24% | 0% | | Complaints pending for one to two months | 3,223 | 1864 | 0 | | 1.09% | 0.64% | 0% | | Complaints pending for two to three months | 1,833 | 848 | 0 | | 0.62% | 0.29% | 0% | | Complaints pending for more than three months | 13,356 | 827 | 0 | | 4.51% | 0.28% | 0% | 2.3 Of the total complaints received by the OBOs, OBO, Kanpur received the maximum number of complaints, followed by Chandigarh and Mumbai. The office wise receipt of complaints under the BOS, 2006 during the period April 1, 2021 to November 11, 2021 is given in Table 1.2 in Chapter 1. Mode of receipt of complaints 2.4 During April 1, 2021 to November 11, 2021, 89.65% of the total complaints were received through digital modes, including, the 24x7 online CMS portal/ email/ CPGRAMS. A comparative position of the various modes through which the complaints were received is provided in Chart 2.1, with details provided at Appendix 2.1. Zone-wise distribution of complaints 2.5 The zone wise receipt of complaints received under the BOS 2006 during the period April 1, 2021 – November 11, 2021, is given below in Chart 2.2. The North zone received the highest volume, followed by the West and the South zones. The details of office wise, zone-wise receipt is detailed in Appendix 2.2. Complainant group-wise classification 2.6 Individual customers constituted close to 80% of the complainants. Senior citizens accounted for 3.43% of the total complaints. The complainant group-wise classification of complaints is given at Appendix 1.4. Entity type-wise classification 2.7 The entity type-wise classification of complaints received by the OBOs during April 1, 2021 to November 11, 2021 is indicated in Table 2.3. | Table 2.3: Entity-type wise receipt of complaints under BOS during April 1, 2021 - November 11, 2021 | | Bank Group | 2019-20 | 2020-21 | 2021-22 | | (Jul - Jun) | (Apr - Mar) | (Apr 1, 2021 - Nov 11, 2021) | | Public Sector Banks* | 1,84,087 | 1,74,974 | 1,19,143 | | | 59.65% | 51.20% | 56.95% | | Private Sector Banks | 98,623 | 1,26,303 | 72,703 | | | 32.00% | 37.00% | 34.80% | | Payments and Small Finance Banks | 5,227 | 6,918 | 6,100 | | | 1.70% | 2.00% | 2.90% | | Foreign Banks | 5,935 | 6,157 | 3,188 | | | 1.90% | 1.80% | 1.50% | | RRBs/ Scheduled Primary Urban Co-op. Banks | 6,060 | 6,382 | 4,292 | | | 2.00% | 1.90% | 2.10% | | Others | 8,698 | 21,013 | 3,770 | | | 2.80% | 6.10% | 1.80% | | Total | 3,08,630 | 3,41,747 | 2,09,196 | *Includes complaints against SBI Cards which were accounted along with SBI until the launch of RB-IOS, 2021
Note: Figures in percentages indicate share to total complaints | Category wise receipt of complaints 2.8 The category wise description of complaints received during April 1, 2021 to November 11, 2021 is given in the Table 2.4 below. | Table 2.4: Category wise receipt of complaints under the BOS | | Category | Complaints received during | | | 2019-20
(Jul-Jun) | 2020-21
(Apr-Mar) | 2021-22
(Apr 1, 2021 - Nov 11, 2021) | | ATM / Debit Cards | 67,800 | 60,203 | 30,652 | | | 21.97% | 17.62% | 14.65% | | Mobile / electronic banking | 41,310 | 44,385 | 28,533 | | | 13.38% | 12.99% | 13.64% | | Non-observance of FPC | 36,215 | 33,898 | 25,033 | | | 11.73% | 9.92% | 11.97% | | Credit Cards | 28,713 | 40,721 | 24,769 | | | 9.30% | 11.92% | 11.84% | | Failure to meet commitments | 25,036 | 35,999 | 22,293 | | | 8.11% | 10.53% | 10.66% | | Levy of charges without prior notice | 18,558 | 20,949 | 12,806 | | | 6.01% | 6.13% | 6.12% | | Loans and advances | 16,437 | 20,218 | 11,401 | | | 5.33% | 5.92% | 5.45% | | Deposit Accounts related | 8,778 | 8,580 | 6,196 | | | 2.84% | 2.51% | 2.96% | | Non-adherence to BCSBI Codes | 14,194 | 14,490 | 5,044 | | | 4.60% | 4.24% | 2.41% | | Pension payments | 6,307 | 4,966 | 4,321 | | | 2.04% | 1.45% | 2.07% | | Remittances | 4,045 | 3,394 | 2,164 | | | 1.31% | 0.99% | 1.03% | | DSAs and recovery agents | 1,406 | 2,440 | 1,632 | | | 0.46% | 0.71% | 0.78% | | Para banking | 1,117 | 1,236 | 778 | | | 0.36% | 0.36% | 0.37% | | Notes and Coins | 514 | 332 | 194 | | | 0.17% | 0.10% | 0.09% | | Others | 29,204 | 39,686 | 26,933 | | | 9.46% | 11.61% | 12.87% | | Out of purview of BOS | 8,996 | 10,250 | 6,447 | | | 2.91% | 3.00% | 3.08% | | Total | 3,08,630 | 3,41,747 | 2,09,196 | Mode of disposal of complaints 2.9 All complaints received during April 1, 2021 to November 11, 2021 were disposed as at the end of the year. The details of complaints disposed is given at Appendix 2.3. 2.10 Of the total complaints handled during the period, 53.09% were ‘Maintainable’ complaints and all the complaints received under BOS, 2006 during the period were disposed as at the end of the year. Majority of the maintainable complaints, viz., 66.11% were resolved through mutual settlement/ agreement, conciliation and mediation efforts of the Ombudsmen. Table 2.5: Mode of disposal of maintainable complaints under BOS | | Disposal of maintainable complaints | 2019-20
(Jul - Jun) | 2020-21
(Jul - Mar) | 2021-22
(Apr 1, 2021 - Nov 11, 2021) | | By Mutual Settlement/ Agreement | 1,25,836 | 1,24,900 | 77,411 | | | 72.34% | 72.73% | 66.11% | | Disposal by Award | 68 | 59 | 17 | | | 0.04% | 0.03% | 0.01% | | Maintainable Complaints Rejected | 47,873 | 46,566 | 39,504 | | | 27.52% | 27.12% | 33.74% | | Maintainable Complaints Withdrawn | 181 | 197 | 160 | | | 0.10% | 0.11% | 0.14% | | Total | 1,73,958 | 1,71,722 | 1,17,092 | Grounds for rejection of maintainable complaints 2.11 The grounds for rejection of maintainable complaints and their proportion to total complaints disposed under the BOS during the period April 1, 2021 – November 11, 2021 is given in the Table 2.6 below. | Table 2.6: Grounds/reasons for rejection of maintainable complaints under BOS | | Ground for rejection | No. of complaints rejected | | | 2019-20
(Jul-Jun) | 2020-21
(Jul - Mar) | 2021-22
(Apr 1, 2021 - Nov 11, 2021) | | Not on grounds of complaint (Clause 8) - Clause 13(a) | 46,237 | 44,994 | 37,624 | | | 96.58% | 96.62% | 95.24% | | Not in accordance with provisions of Clause 9 (3) - Clause 13(b) | 983 | 946 | 1,248 | | | 2.05% | 2.03% | 3.16% | | Beyond pecuniary jurisdiction of BO - Clause 12 (5) & (6) - Clause 13(c) | 147 | 142 | 94 | | | 0.31% | 0.30% | 0.24% | | Requiring elaborate documentary and oral evidence - Clause 13 (d) | 28 | 50 | 94 | | | 0.06% | 0.11% | 0.24% | | Complaints without sufficient cause - Clause 13(e) | 195 | 23 | 3 | | | 0.41% | 0.05% | 0.01% | | Not pursued by the complainants - Clause 13(f) | 27 | 81 | 72 | | | 0.06% | 0.17% | 0.18% | | No loss/ damage/ inconvenience to the complainant - Clause 13 (g) | 44 | 11 | 4 | | | 0.09% | 0.02% | 0.01% | | The complaint pertains to the same cause of action, for which any proceedings before any court, tribunal or arbitrator or any other forum is pending 13(2) | 212 | 319 | 365 | | | 0.44% | 0.69% | 0.92% | | Total maintainable complaints rejected | 47,873 | 46,566 | 39,504 | | Note: Figures in percentages indicate share to total. | 2.12 About 47% of the total complaints were closed as non-maintainable during the period April 1, 2021 – November 11, 2021. The reasons for rejection of complaints as non-maintainable are given in the Chart 2.3. Appeals against the decisions of the BOs 2.13 A total of 51 Appeals were received under the BOS during the year 2021-22. The details of receipt, disposal and pendency of Appeals as at the end of the year is given in Table 2.7. The Appellate Authority (AA) under the BOS, 2006 as amended upto July 01, 2017 was the DG-in-charge of CEPD. Subsequently, the RB-IOS, 2021, launched in November 2021, has vested the powers of the AA with the ED-in-Charge of CEPD. However, the Appeals that were received against the decisions of the Ombudsmen in terms of the erstwhile BOS, 2006 have been disposed by AA-DG, in accordance with the provisions of BOS 2006. | Table 2.7: Receipt and disposal of Appeals under the BOS | | Particulars | 2019-20
(Jul-Jun) | 2020-21
(Jul-Mar) | 2021-22
(Apr 1, 2021 - Nov 11, 2021) | | Appeals pending at the beginning | 72 | 47 | 44 | | Appeals received during the year from complainants | 34 | 13 | 45 | | Appeals received during the year from banks | 29 | 10 | 6 | | Total appeals handled during the year | 135 | 70 | 95 | | Appeal disposed during the year | 88 | 26 | 70 | | Pending at the end of the year | 47 | 44 | 25 | | Mode of Disposal | | | Appeals remanded to the BO | 4 | 2 | 1 | | Appeals withdrawn / settled / infructuous | 14 | 5 | 11 | | Appeals rejected | 43 | 9 | 32 | | Appeals allowed | 27 | 10 | 26 | | Appeals Disposed | | | i. In favour of complainant appellant | 29 | 10 | 19 | | ii. In favour of banks | 21 | 5 | 21 | | iii. Neither in favour of complainant appellant nor in favour of banks (Remanded back to BO / infructuous) | 38 | 11 | 30 | | *All 25 appeals pending as on March 31, 2022, were disposed as on October 18, 2022. |
Chapter 3: The Ombudsman Scheme for Non-Banking Financial Companies (OSNBFC), 2018: Activities during April 1, 2021 – November 11, 2021 The total number of complaints received at the four Offices of NBFC Ombudsman (ONBFCOs) during April 1, 2021 – November 11, 2021 was 20,439. Since the OSNBFC was integrated into the RB-IOS, 2021 from November 12, 2021 the data presented pertains to April 1, 2021 to November 11, 2021. The rate of disposal of complaints stood at 100% as at the end of the year i.e., March 31, 2022. Complaints relating to non-adherence to Fair Practices Code (FPC) were the highest, constituting 61.89% of the total complaints received during April 1, 2021 – November 11, 2021. Majority (70.08%) of the maintainable complaints were resolved through mutual settlement/conciliation/ mediation. During April 1, 2021 – November 11, 2021, 12 Awards were issued against NBFCs by the NBFC Ombudsmen (NBFCOs). Ten Appeals were received against the decisions of NBFCOs during April 1, 2021 – November 11, 2021. | 3.1 The OSNBFC, 2018 was administered through four ONBFCOs located at Chennai, Kolkata, Mumbai, and New Delhi, which handled complaints of South, East, West and North zones respectively covering the entire country. It has since been repealed with effect from November 12, 2021, the date on which RB-IOS, 2021 came into force. Receipt of complaints 3.2 During April 1, 2021 – November 11, 2021, 20,439 complaints were received at the ONBFCOs. ONBFCOs handled 22,077 complaints during the reference period, all of which were disposed at the end of the year. The position of customer complaints handled by ONBFCOs is tabulated in Table 3.1 below: | Table 3.1: Position of customer complaints handled by ONBFCOs | | Particulars | 2019-20
(Jul-Jun) | 2020-21
(Jul-Mar) | 2021-22
(Apr 1, 2021 - Nov 11, 2021) | | Complaints brought forward from the previous year | 36 | 908 | 1,319 | | Complaints received | 19,432 | 26,957 | 20,439 | | Draft complaints received during previous year and transferred during current year, CEPC transferred | - | 1,486 | 319 | | Total number of complaints handled | 19,468 | 29,351 | 22,077 | | Complaints disposed during the year | 18,560 | 28,032 | 22,077 | | Rate of Disposal (%) | 95.34% | 95.51% | 100% | | Complaints pending at the end of the year | 908 | 1,319 | 0 | | Complaints pending for less than one month | 380 | 659 | 0 | | Complaints pending for one to two months | 187 | 365 | 0 | | Complaints pending for two to three months | 60 | 98 | 0 | | Complaints pending for more than three months | 281 | 197 | 0 | 3.3 Of the 20,439 complaints received by the ONBFCOs, ONBFCO, New Delhi received the maximum number of complaints (8,628), which accounted for 42.21% of the total complaints received by the ONBFCOs. Office-wise receipt of complaints at ONBFCOs is given at Table 1.2 in Chapter 1. Mode of receipt of complaints 3.4 During April 1, 2021 to November 11, 2021, 94.17% (19,248) of the complaints were lodged through digital mode using the CMS portal/ email/ CPGRAMS. This reflects the tech-savvy nature of the users of digital financial products who are more comfortable in filing their complaints online as compared to other modes. A comparative position of the various modes through which the complaints were received during April 1, 2021 to November 11, 2021 is depicted in Chart 3.1, with details provided at Appendix 3.1. NBFC category-wise complaints received 3.5 Of the total complaints received during April 1, 2021 to November 11, 2021, 5,699 (27.88%) complaints were against Deposit taking NBFCs (NBFCs-D), while 12,385 (60.59%) complaints were against Non-Deposit taking NBFCs (NBFCs-ND). The NBFC category-wise classification of complaints received by ONBFCOs during April 1, 2021 to November 11, 2021 is indicated at Table 3.2 and Chart 3.2 below:
| Table 3.2 NBFC category-wise receipt of complaints during April 1, 2021 to November 11, 2021 | | NBFC Category | Complaints | % Share | | NBFCs-D | 5,699 | 27.88% | | NBFCs-ND | 12,385 | 60.59% | | Others (entities not covered under the OSNBFC) | 2,355 | 11.52% | | Total | 20,439 | 100% | Complainant group-wise classification 3.6 Individual customers constituted the largest segment (51.21%) of complainants during April 1, 2021 to November 11, 2021. Senior citizens accounted for 0.5% of the total complaints. The complainant group-wise classification of complaints is given at Appendix 1.4. Nature of complaints handled 3.7 Table 3.3 categorizes complaints received on the grounds of deficiency as specified under Clause 8 of the OSNBFC, 2018. | Table 3.3: Category-wise distribution of complaints | | Complaint category | 2019-20
(Jul-Jun) | 2020-21
(Apr- Mar) | 2021-22
(Apr 1, 2021 - Nov 11, 2021) | | Non-adherence to FPC | 7,052 | 17,915 | 12,649 | | 36.29% | 48.48% | 61.89% | | Non-observance of RBI directions | 3,607 | 6,114 | 1,875 | | 18.56% | 16.55% | 9.17% | | Levy of charges without prior notice | 1,628 | 3,189 | 1,691 | | 8.38% | 8.63% | 8.27% | | Non-transparency in contract/ loan | 1,704 | 1,833 | 507 | | 8.77% | 4.96% | 2.48% | | Delay in repayment of deposits | 395 | 536 | 317 | | 2.03% | 1.45% | 1.55% | | Delay in release of securities/ documents | 268 | 417 | 282 | | 1.38% | 1.13% | 1.38% | | No communication about loan sanctioned | 399 | 375 | 262 | | 2.05% | 1.01% | 1.28% | | Delay in payment of interest | 232 | 386 | 182 | | 1.19% | 1.04% | 0.89% | Non-understandable or no
adequate notice on terms and conditions | 82 | 145 | 89 | | 0.42% | 0.39% | 0.44% | Non-understandable or
non-issuance of sanction letter/ terms | 49 | 85 | 46 | | 0.25% | 0.23% | 0.23% | | Not covered under Clause 8 of the Scheme | 474 | 1,169 | 1,654 | | 2.44% | 3.16% | 8.09% | | Other categories | 3,542 | 4,787 | 885 | | 18.23% | 12.95% | 4.33% | | Total | 19,432 | 36,951 | 20,439 | | Note: Figures in percentages indicate share to total complaints | 3.8 During April 1, 2021 to November 11, 2021, complaints related to non-adherence to FPC constituted the largest share i.e. 61.89% of the total complaints received, followed by non-observance of RBI directions (9.17%) and levy of charges without prior notice (8.27%). Disposal of complaints 3.9 All complaints received during April 1, 2021 to November 11, 2021 were disposed as at the end of the year. The ONBFCO-wise position of complaints disposed during April 1, 2021 to November 11, 2021 is given at Appendix 3.2. 3.10 The details of the grounds under which the complaints have been disposed as non-maintainable are given in the Chart 3.3. As may be observed, complaints were considered non-maintainable largely due to i) Entity not covered under the OSNBFC ii) First Resort Complaint iii) Earlier dealt by BO. 3.11 The ONBFCO-wise distribution of maintainable and non-maintainable complaints disposed during April 1, 2021 to November 11, 2021 is given at Appendix 3.3. Mode of disposal of maintainable complaints 3.12 ‘Maintainable’ complaints are those that are made before the NBFCO, relating to the grounds of complaint specified in Clause 8 of the OSNBFC and are otherwise in compliance with the requirements laid down in the Scheme. The Scheme endeavors to promote settlement of complaints by agreement through conciliation and/ or mediation by ONBFCO. If the parties fail to arrive at an acceptable agreement, the NBFCO gives a decision or passes an Award. During April 1, 2021 – November 11, 2021, 12 Awards were issued against NBFCs by the NBFCOs. 3.13 Table 3.4 depicts the way the maintainable complaints were disposed of during the year. Of the maintainable complaints, 70.08% were resolved through agreement and 29.82% were rejected. | Table 3.4: Mode of disposal of maintainable complaints by ONBFCOs | | Mode of disposal | 2019-20
(Jul – Jun) | 2020-21
(Jul – Mar) | 2021-22
(Apr 1, 2021 - Nov 11, 2021) | | Mutual settlement/ agreement | 4,045 | 8,719 | 8,517 | | | 71.12% | 73.69% | 70.08% | | Complaints withdrawn | 1 | 0 | 0 | | | 0.02% | 0% | 0% | | Awards issued | 0 | 6 | 12 | | | 0% | 0.05% | 0.10% | | Rejected | 1,641 | 3,107 | 3,624 | | | 28.85% | 26.26% | 29.82% | | Total maintainable complaints | 5,687 | 11,832 | 12,153 | | Note: Figures in % indicate percentage to maintainable complaints | Grounds for rejection of maintainable complaints 3.15 The grounds for rejection of maintainable complaints and their proportion to total complaints disposed under the BOS during the period April 1, 2021 – November 11, 2021 is given in the Table 3.5 below. | Table 3.5: Grounds/reasons for rejection of maintainable complaints | | Ground for rejection | No. of complaints rejected | | | 2019-20 | 2020-21 | 2021-22 | | | (Jul-Jun) | (Jul - Mar) | (Apr 1, 2021 - Nov 11, 2021) | | Not on grounds of complaint (Clause 8) - Clause 13(a) | 1,528 | 2,935 | 3,330 | | | 93.11% | 94.46% | 91.89% | | Not in accordance with provisions of Clause 9 (3) - Clause 13(b) | 7 | 33 | 25 | | | 0.43% | 1.06% | 0.69% | | Beyond pecuniary jurisdiction of BO - Clause 12 (5) & (6) - Clause 13(c) | 19 | 9 | 8 | | | 1.16% | 0.29% | 0.22% | | Requiring elaborate documentary and oral evidence - Clause 13 (d) | 10 | 0 | 3 | | | 0.61% | 0.00% | 0.08% | | Complaints without sufficient cause - Clause 13(e) | 4 | 6 | 7 | | | 0.24% | 0.19% | 0.19% | | Not pursued by the complainants - Clause 13(f) | 1 | 2 | 2 | | | 0.06% | 0.06% | 0.06% | | No loss/ damage/ inconvenience to the complainant - Clause 13 (g) | 0 | 0 | 0 | | | 0.00% | 0.00% | 0.00% | | The complaint pertains to the same cause of action, for which any proceedings before any court, tribunal or arbitrator or any other forum is pending 13(2) | 72 | 122 | 249 | | | 4.39% | 3.93% | 6.87% | | Total maintainable complaints rejected | 1,641 | 3,107 | 3,624 | Appeals against the decisions of the NBFC-O 3.15 The DG-in-Charge of the CEPD, RBI was designated as the AA as per the provisions of the OSNBFC. CEPD provides the Secretariat to the AA. Ten Appeals were received against the decisions of NBFCOs during April 1, 2021 – November 11, 2021, the details of which is given in Table 3.6 below: | Table 3.6: Position of Appeals – ONBFCOs | | Particulars | 2019-20
(Jul - Jun) | 2020-21
(Jul - Mar) | 2021-22
(Apr 1, 2021 - Nov 11, 2021) | | Appeals pending at the beginning of the year | 1 | 1 | 1 | | Appeals received during the year from complainants | 1 | 1 | 4 | | Appeals received during the year from NBFCs | 0 | 0 | 6 | | Total Appeals handled during the year | 2 | 2 | 11 | | Appeal disposed during the year | 1 | 1 | 3 | | Pending at the end of the year | 1 | 1 | 8* | | Mode of Disposal: | | Appeals remanded to the NBFC-O | 0 | 0 | 0 | | Appeals withdrawn/ settled/ infructuous | 0 | 0 | 1 | | Appeals rejected | 1 | 1 | 1 | | Appeals allowed | 0 | 0 | 1 | | Appeals Disposed: | | In favour of complainants | 0 | 1 | 1 | | In favour of NBFCs | 0 | 0 | 1 | | iii. Neither in favour of complainant appellant nor in favour of REs (Remanded back to BO / infructuous) | 1 | 0 | 1 | | * All 8 appeals pending as on March 31, 2022, were disposed as on October 18, 2022. |
Chapter 4: Ombudsman Scheme for Digital Transactions (OSDT), 2019: Activities during April 1, 2021 to November 11, 2021 The number of complaints received against Non-Bank Payment System Participants (NBPSPs) by the 22 OSDT offices during April 1, 2021 to November 11, 2021 was 2,281. As OSDT was integrated into the RB-IOS, 2021 w.e.f. November 12, 2021, the data presented in this chapter covers the period April 1, 2021 to November 11, 2021. The rate of disposal of complaints stood at 100% during the period. Complaints pertaining to fund transfers/ UPI/ BBPS/ Bharat QR Code constituted the largest share of complaints i.e. 44.76%. The majority (59.65%) of maintainable complaints were resolved through mutual agreement/ conciliation /mediation process. Maximum (99.87%) number of the complaints under OSDT were lodged through digital/ electronic modes, viz., the CMS portal, emails, etc. During the year, no Award was issued under OSDT. No Appeal was received against the decisions of the Ombudsmen for Digital Transactions (ODTs) under OSDT. | 4.1 The OSDT, 2019 was administered through the 22 offices where the Offices of RBI Banking Ombudsman are situated. Receipt of complaints 4.2 During April 1, 2021 to November 11, 2021, 2,281 complaints were received at the Offices of the Ombudsman for Digital Transactions (OODTs). The year-wise number of complaints received at OODTs in last three years is given in Table 4.1. | Table 4.1 – Number of complaints received by OODTs | | | 2019-20
(Jul - Jun) | 2020-21
(Apr - Mar) | 2021-22
(Apr 1, 2021 - Nov 11, 2021) | | No. of OODTs | 22 | 22 | 22 | | Complaints received during the year | 2,481 | 3,594 | 2,281 | 4.3 During April 1, 2021 to November 11, 2021, 2,324 complaints were handled by OODTs, including the complaints from the previous year, of which, 100% complaints were disposed before the end of the year. The position of customer complaints handled by OODTs is tabulated in Table 4.2 below: | Table 4.2 - Position of customer complaints handled by OODTs | | Particulars | 2019-20
(Jul - Jun) | 2020-21
(Jul - Mar) | 2021-22
(Apr 1, 2021 - Nov 11, 2021) | | Complaints brought forward from previous year | 53 | 230 | 28 | | Previous year’s draft complaints and complaints received in CEPCs subsequently registered/transferred to OODTs | - | 27 | 15 | | Complaints received | 2,481 | 2,946 | 2,281 | | Total number of complaints handled | 2,534 | 3,203 | 2,324 | | Complaints disposed | 2,304 | 3,175 | 2,324 | | Rate of disposal (%) | 90.92% | 99.13% | 100% | | Complaints pending at the end of the year | 230 | 28 | 0 | | Complaints pending for less than one month | 31 | 18 | 0 | | Complaints pending for one to two months | 20 | 3 | 0 | | Complaints pending for two to three months | 23 | 2 | 0 | | Complaints pending for more than three months | 156 | 5 | 0 | 4.4 Of the 2,281 complaints received by the OODTs, OODT, Hyderabad received the maximum number of complaints (204), which accounted for 8.94% of the total complaints received by the OODTs, followed by Kolkata (201) and Bengaluru (189). OODT Thiruvananthapuram (10) received the lowest share of complaints with 0.44%. Office-wise receipt of complaints at OODTs is given at Table 4.3 and Appendix 4.1. Mode of receipt of complaints 4.5 During April 1, 2021 to November 11, 2021, 99.87% (2,278) of the complaints were lodged through digital mode using the CMS portal/ email/ CPGRAMS. This reflects the tech-savvy nature of the users of digital financial products who are more comfortable in filing their complaints online, as compared to other modes. Only three complaints were received in physical mode during the period. A comparative position of the various modes through which the complaints were received under OSDT during April 1, 2021 to November 11, 2021 is depicted in Chart 4.1, with details provided at Appendix 4.2. Zone-wise distribution of complaints 4.6 Under OSDT, the North zone accounted for the maximum number of complaints (28.72%) during April 1, 2021 to November 11, 2021, followed by the West zone (27.44%) and the South zone (22.75%). The East zone accounted for the lowest share i.e. 21.09% of the total OSDT complaints received. The zone-wise distribution of complaints received is given at Appendix 4.2 and depicted in Chart 4.2 below. Complainant group-wise classification 4.7 Individual customers constituted the largest segment (77.25%) of complainants during April 1, 2021 to November 11, 2021. Senior citizens accounted for 1.40% of the total OSDT complaints. The complainant group-wise classification of complaints is given at Appendix 1.4. Entity type-wise classification 4.8 The entity type-wise classification of complaints received by OODTs during April 1, 2021 to November 11, 2021 is indicated in Chart 4.3 and Table 4.3 below. 4.9 In tune with the size of their network and business among NBPSPs, PPIs had the highest share of complaints accounting for 87.77% of the total complaints, followed by Bharat Bill Payment Central Unit (BBPCU)/ Bharat Bill Payment Operating Unit (BBPOU) with 2.72% share in total complaints. Other entities accounted for 9.51% of total complaints.
| Table 4.3: Entity type-wise break-up of complaints received at OODTs during April 1, 2021 to November 11, 2021 | | Entity | 2021-22
(Apr 1, 2021 - Nov 11, 2021) | | Prepaid Payment Instruments | 2,002 | | 87.77% | | BBPCU/ BBPOU | 62 | | 2.72% | | Others | 217 | | 9.51% | | Note: Figures in % indicate percentage to total complaints | Nature of complaints handled 4.10 Table 4.4 categorizes complaints received on the grounds of deficiency in digital banking services as specified under Clause 8 of the OSDT, 2019. | Table 4.4 – Category-wise distribution of complaints | | Category | 2019-20
(Jul - Jun) | 2020-21
(Apr - Mar) | 2021-22
(Apr 1, 2021 - Nov 11, 2021) | | Fund Transfers/ UPI/ BBPS/ Bharat QR Code | 1,089 | 1,775 | 1,021 | | 43.89% | 49.39% | 44.76% | | Mobile/Electronic Fund Transfers / Mobile/Electronic Banking | 598 | 824 | 524 | | 24.10% | 22.93% | 22.97% | | Non-reversal of Funds due to Wrong Beneficiary Transfer by System Participant | 218 | 291 | 191 | | 8.79% | 8.10% | 8.37% | | Prepaid Payment Instruments (PPI) | 198 | 253 | 224 | | 7.98% | 7.04% | 9.82% | | Violation of RBI Directives in relation to Fees/Charges | 58 | 100 | 68 | | 2.34% | 2.78% | 2.98% | | Out of Subject | 75 | 57 | 29 | | 3.02% | 1.59% | 1.27% | | Others | 245 | 294 | 224 | | 9.88% | 8.18% | 9.82% | | Total | 2,481 | 3,594 | 2,281 | | Note: Figures in percentages indicate share to total complaints | 4.11 During April 1, 2021 to November 11, 2021, complaints related to fund transfers/ UPI/ BBPS/ Bharat QR code constituted the largest share i.e. 44.76% of the total complaints received, followed by mobile/electronic fund transfers / mobile/electronic banking (22.97%) and non-reversal of funds due to wrong beneficiary transfer by Payment System Participants (8.37%). Disposal of complaints 4.12 All complaints received during April 1, 2021 to November 11, 2021 were disposed at the end of the year. The OODT-wise position of complaints disposed during April 1, 2021 to November 11, 2021 is given at Appendix 4.3. 4.13 The OODT-wise distribution of maintainable complaints is given at Appendix 4.4 respectively. 4.14 The details of the grounds under which the complaints have been disposed as non-maintainable are given in the Chart 4.4 below. As may be observed, complaints were considered non-maintainable largely due to i) the complaints not being represented properly, ii) complaints being FRCs iii) not under the definition of Payment System Participants and digital transaction. Mode of disposal of maintainable complaints 4.15 ‘Maintainable’ complaints are those that are made before the ODT, relating to the grounds of complaint specified in Clause 8 of the OSDT and are otherwise in compliance with the requirements laid down in the Scheme. The Scheme endeavors to promote settlement of complaints by facilitation or agreement through conciliation and/ or mediation by OODTs. If the parties fail to arrive at an acceptable agreement, the ODT gives a decision or passes an Award. However, no Award was issued during the year under the OSDT. 4.16 Table 4.5 depicts the modes of the disposal of the maintainable complaints during the year. Of the maintainable complaints, 59.65% were resolved through agreement. | Table 4.5 - Mode of disposal of maintainable complaints | | Disposal of Maintainable Complaints | 2019-20
(Jul - Jun) | 2020-21
(Jul - Mar) | 2021-22
(Apr 1, 2021 - Nov 11, 2021) | | By Mutual Settlement/Agreement | 532 | 885 | 553 | | 56.12% | 57.54% | 59.65% | | Disposal by Award | 0 | 0 | 0 | | 0.00% | 0.00% | 0.00% | | Maintainable Complaints Rejected | 416 | 653 | 374 | | 43.88% | 42.46% | 40.35% | | Maintainable Complaints Withdrawn | 0 | 0 | 0 | | 0.00% | 0.00% | 0.00% | | Total | 948 | 1,538 | 927 | | Note: Figures in % indicate share to total complaints | Grounds for rejection of maintainable complaints 4.17 The grounds for rejection of maintainable complaints and their proportion to total complaints received during the year are indicated in Table 4.6. | Table 4.6 – Grounds/reasons for rejection of maintainable complaints | | Ground for Rejection | No. of Complaints Rejected | 2019-20
(Jul - Jun) | 2020-21
(Jul - Mar) | 2021-22
(Apr 1, 2021 - Nov 11, 2021) | | Not on the grounds of complaint referred to in Clause 8 - Clause 13(1)(a) | 409 | 631 | 362 | | 98.32% | 96.63% | 96.79% | | Not in accordance with Sub Clause (3) of Clause 9 - Clause 13(1)(b) | 2 | 16 | 11 | | 0.48% | 2.45% | 2.94% | | Beyond the limit of compensation prescribed under Clause 12 (5) and 12(6) - Clause 13(1)(c) | 1 | 4 | 1 | | 0.24% | 0.61% | 0.27% | | Complaints without any sufficient cause - Clause 13(1)(e) | 4 | 1 | 0 | | 0.96% | 0.15% | 0.00% | | The complaint pertains to the same cause of action, for which any proceedings before any court, tribunal or arbitrator or any other forum is pending 13(2) | 0 | 1 | 0 | | 0.00% | 0.15% | 0.00% | | Total | 416 | 653 | 374 | | Note: Figures in percentages indicate the share to total complaints | 4.18 As may be seen from Table 4.6, the maximum number of rejections were due to complaints ‘not on grounds of complaint referred to in Clause 8 -Clause 13(1)(a)’ of the OSDT. Age-wise classification of pending complaints 4.19 No complaints received under OSDT was pending as at the end of the year. Appeals against the decisions of the ODTs 4.20 The DG-in-Charge of the CEPD, RBI is designated as the AA as per the provisions of the OSDT. CEPD provides the Secretariat to the AA. No Appeal was received during April 1, 2021 to November 11, 2021.
Chapter 5: The Reserve Bank – Integrated Ombudsman Scheme (RB-IOS), 2021: Activities during November 12, 2021 to March 31, 2022 The three erstwhile Ombudsman schemes viz. (i) the BOS, 2006, as amended up to July 01, 2017; (ii) the OSNBFC, 2018; and (iii) the OSDT, 2019 were integrated into a single scheme, the RB-IOS, 2021 with effect from November 12, 2021. The RB-IOS 2021 offers the benefit of a single platform to customers for getting speedy resolution of their grievances. Along with the launch of the RB-IOS, a CRPC was set up at the Chandigarh Regional Office of RBI as a single point for receipt of all email and physical complaints. CRPC also hosts a Contact Centre with 24x7 IVRS facility at # 14448 which also allows personal guidance to complainants between 9:30 AM to 5:15 PM on all working days. CRPC handles the preliminary scrutiny and processing of all email and physical complaints received under RBIOS in order to weed out the non-maintainable complaints and non-complaints with a suitable communication to the complainant, and also assign the maintainable complaints to the Offices of RBI Ombudsman (ORBIOs) for further redressal. Under the RB-IOS, 2021, the territorial jurisdictions of the ORBIOs have been abrogated based on ‘One Nation, One Ombudsman’ approach and the complaints are assigned to the 22 ORBIOs in an equitable manner as per a pre-defined algorithm in the CMS. The total number of complaints received at CRPC and ORBIOs, under RB-IOS, 2021, from November 12, 2021 to March 31, 2022 stood at 1,86,268. Of these, 66,133 complaints were disposed at ORBIOs and 1,07,821 complaints were closed at the CRPC. The overall rate of disposal of complaints by CRPC and ORBIOs, under RB-IOS, 2021, as at the end of the financial year stood at 93.39%. Majority (55.61%) of maintainable complaints disposed under RB-IOS, 2021 were resolved through mutual settlement/ conciliation/ mediation. Between November 12, 2021 and March 31, 2022, 4 Awards were issued against the REs by the RBIOs and 31 Appeals were received against the decisions of the RBIOs under RB-IOS, 2021. | Receipt and handling of complaints at CRPC 5.1 During November 12, 2021, to March 31, 2022, 1,49,419 complaints were received at the CRPC. Of these, 1,07,821 complaints were closed at CRPC as non-complaints/ non-maintainable complaints, while the remaining maintainable complaints were assigned to ORBIOs for further redress. The month-wise receipt of complaints at CRPC during the period shows a steady increase in inflow of complaints to CRPC (Chart 5.1). 5.2 The average Turn Around Time (TAT) for disposal of complaints at CRPC stood at 12 days. 5.3 The details of the grounds under which the complaints have been disposed at CRPC are given in Chart 5.2 below: Complaints receipt and handling at the ORBIOs 5.4 During November 12, 2021 to March 31, 2022, 72,580 complaints were assigned to the ORBIOs for redress both from the CMS portal directly as well as through the CRPC. The ORBIO-wise receipt of complaints, provided at Table 1.2 of Chapter 1, reflects a near equitable distribution of complaints across all the 22 ORBIOs on account of deployment of a pre-specified algorithm in CMS for distribution of complaints among ORBIOs. The ORBIO, Chennai received maximum number of complaints (3,728) followed by ORBIO, Mumbai-II (3,703 complaints) and ORBIO, Ahmedabad (3,698 complaints) during the period, comprising 5.14%, 5.10% and 5.10% respectively of the total RB-IOS complaints received by the ORBIOs. The slight variation in numbers across offices is on account of vernacular complaints that get allocated to the ORBIO in the relevant linguistic region, bypassing the algorithm for allocation of complaints. A comparative position of complaints received by ORBIOs during November 12, 2021 to March 31, 2022 is given in Chart 5.3. 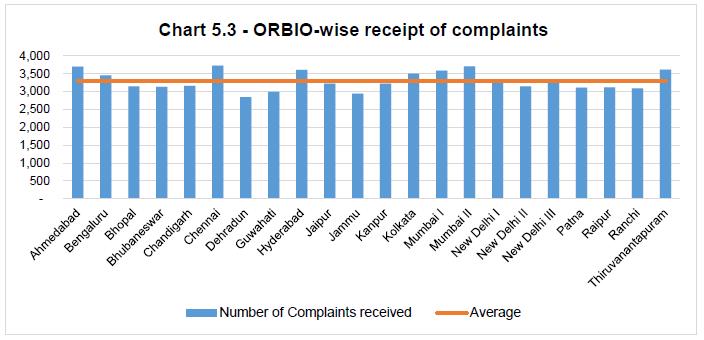 Mode of receipt of complaints 5.5 The complaints were received by the ORBIOs either directly from the CMS portal or through the CRPC, i.e. complaints received over email and physical modes, including complaints received through the Government of India’s Centralized Public Grievance Redress and Monitoring System (CPGRAMS), post their initial processing. 5.6 The mode of receipt of complaints that were handled by ORBIOs during November 12, 2021 to March 31, 2022 is given at Appendix 5.1 and is depicted in the Chart 5.4. 5.7 As can be seen from the above chart, 84.55% of complaints handled by ORBIOs have been received through the digital mode, of which 57.02% were received through the online portal (including complaints received through CPGRAMS) and 27.53% were through emails. Population group-wise distribution of complaints 5.8 The source of complaints received by ORBIOs continue to be dominated by metropolitan centers (49.27%) under the RB-IOS, 2021, followed by urban centers (31.58%), semi-urban centers (14.26%) and rural centers (4.89%). The population group-wise distribution of complaints during November 12, 2021 to March 31, 2022 is given in Chart 5.5 below: Zone-wise distribution of complaints 5.9 Though there was an equitable distribution of complaints among ORBIOs, the complaints received by ORBIOs in North-zone dominated with 34.60% of complaints received during the period, owing to highest number of ORBIOs being located in the North-zone (8 of 22 ORBIOs), followed by West-zone (5 ORBIOs) with 23.76% of complaints. 5.10 However, a shift is observed in the share of complaints received by the South and the East-zones. The East-zone that received lower volume of complaints as compared to the South-zone in the past years under the erstwhile Ombudsman schemes, witnessed a higher receipt, under RB-IOS, 2021, at 21.79% of the total complaints, as compared to 19.84% of complaints received by South-zone (4 ORBIOs). 5.11 The zone-wise distribution of complaints received during November 12, 2021 to March 31, 2022 is given in Appendix 5.2 and depicted in Chart 5.6. Complainant group-wise classification of complaints 5.12 Complaints received from individual complainants (excluding senior citizens) accounted for 83.22% of the total complaints received between November 12, 2021 to March 31, 2022, followed by 2.92% from limited companies (and 2.65% from the senior citizens). Appendix 1.4 provides the complainant group-wise classification of complaints. Entity group-wise classification of complaints 5.13 Under the RB-IOS, 2021, the ORBIOs receive complaints against banks, NBFCs and NBPSPs. The entity group-wise classification of complaints received by ORBIOs during November 12, 2021 to March 31, 2022 is provided in Appendix 5.3 and indicated in Chart 5.7 below: 5.14 The share of complaints against Private Sector Banks remained highest (21,572 complaints) with 29.72% of the total complaints assigned to ORBIOs, closely followed by Nationalized Banks (20,857 complaints) with 28.74% share. The complaints against NBFCs formed 5.83% (4,233 complaints) of the total complaints received by ORBIOs during the period. Nature of complaints handled 5.15 The RB-IOS, 2021 has done away with specific grounds of complaints and all the complaints pertaining to ‘deficiency in service’7 at the regulated entity falling under the Scheme, can be filed under the Scheme. The category/ ground wise classification of the complaints is provided in Table 5.1 below. | Table 5.1 – Category-wise distribution of complaints received at ORBIOs | | Category of complaint received at ORBIOs | Nov 12, 2021 – Mar 31, 2022 | | Loans and advances including Non-observance of FPC | 18,651 | | 25.70% | | Mobile / electronic banking | 12,180 | | 16.78% | | ATM / Debit Cards | 11,185 | | 15.41% | | Deposit Accounts related | 10,474 | | 14.43% | | Credit Cards | 10,027 | | 13.82% | | Pension payments | 1,885 | | 2.60% | | Remittances | 1,088 | | 1.50% | | Para banking | 830 | | 1.14% | | Failure to meet commitments/ Non- adherence to BCSBI Codes | 109 | | 0.15% | | Notes and Coins | 108 | | 0.15% | | Others | 6,043 | | 8.33% | | Total | 72,580 | Disposal of complaints 5.16 The disposal of complaints received at ORBIOs during November 12, 2021 to March 31, 2022 has been indicated in Table 5.2. | Table 5.2 – Disposal of complaints at ORBIOs | | Number of Complaints | Nov 12, 2021 to Mar 31, 2022 | | Received during the period | 72,580 | | Brought forward from previous period | - | | Complaints received by Email before the start of the year but registered on or after start of the year; including complaints transferred from Consumer Education and Protection Cells on or after the start of the year | - | | Handled during the period | 72,580 | | Disposed during the period | 66,133 | | Rate of Disposal at ORBIOs (%) | 91.12% | | Carried forward to the next year | 6,447 | | Complaints pending for less than one month (30 days) | 5,621 | | 7.74% | | Complaints pending for one to two months | 583 | | 0.80% | | Complaints pending for two to three months | 86 | | 0.12% | | Complaints pending for more than three months | 157 | | 0.22% | 5.17 As indicated in Table 5.2 above, the overall disposal of complaints by the ORBIOs, received under RB-IOS, 2021, stood at 91.12%, whereas, of the 8.88% pending complaints, 7.74% were pending for less than one month and only 1.14% of complaints were pending for more than a month as on March 31, 2022, representing the efficiency of the ORBIOs and effectiveness of the role played by CRPC in reducing the flow of non-maintainable8 complaints to ORBIOs. All pending complaints as on March 31, 2022 have since been disposed. Mode of disposal of maintainable complaints 5.18 During the period November 12, 2021 – March 31, 2022, 68.89% of the total complaints closed at the ORBIOs, were disposed as maintainable complaints. The mode of disposal of these maintainable complaints is detailed in the Table 5.3 below: | Table 5.3: Mode of disposal of maintainable complaints under RB-IOS, 2021 | | Disposal of maintainable complaints | Nov 12, 2021 to Mar 31, 2022 | Share | | By Mutual Settlement/ Agreement | 25,339 | 55.61% | | Disposal by Award | 4 | 0.01% | | Maintainable Complaints Rejected | 19,434 | 42.65% | | Maintainable Complaints Withdrawn | 792 | 1.74% | | Total | 45,569 | 100.00% | Grounds for rejection of maintainable complaints 5.19 During the period November 12, 2021 – March 31, 2022, 19,434 maintainable complaints were rejected as per the provisions of the Scheme. The grounds for rejection under RB-IOS, 2021 is detailed in the Table 5.4 below: | Table: 5.4 Grounds/reasons for rejection of maintainable complaints under RB-IOS, 2021 | | Ground for rejection | Nov 12, 2021 to Mar 31, 2022 | | No deficiency in service in the opinion of the Ombudsman- Clause 16(2)(a) | 19,055 | | 98.05% | | Not pursued by the complainants - Clause 16(2)(c) | 160 | | 0.82% | | Compensation sought is beyond the power of Ombudsman - Clause 16(2)(b) | 102 | | 0.52% | | Requiring elaborate documentary and oral evidence - Clause 16(2)(e) | 95 | | 0.49% | | Complaints without sufficient cause - Clause 16(2)(d) | 11 | | 0.06% | | No financial loss/ damage/ inconvenience caused to the complainant - Clause 16(2)(f) | 11 | | 0.06% | | Total maintainable complaints rejected | 19,434 | | Note: Figures in percentages indicate share to total | Turn Around Time (TAT) of complaints 5.20 The average time taken by ORBIOs to dispose complaints received under RB-IOS, 2021 stood at 38 days. Awards issued 5.21 During the period November 12, 2021 to March 31, 2022, 4 Awards were issued by ORBIOs, of which, two were implemented within the stipulated time, one was appealed by the entity and one got lapsed. Appeals against the decisions of the ORBIOs 5.22 Under provisions of RB-IOS, 2021, the Executive Director (ED) in-Charge of CEPD, RBI is designated as the Appellate Authority (AA)9. In terms of the RB-IOS, the CEPD provides the secretarial assistance to the AA. During the period November 12, 2021 to March 31, 2022, 31 Appeals were received against the decision of ORBIOs and all such Appeals were filed by the complainants (none from REs). 5.23 The position of Appeals handled by the AA during the period and the ORBIO-wise position of Appeals received during the period is given in Tables 5.5 and Appendix 1.2, respectively. | Table 5.5 – Position of Appeals under RB-IOS as on March 31, 2022 | | Particulars | Nov 12, 2021 to Mar 31, 2022 | | Appeals pending at the beginning of the year | 0 | | Appeals received during the year from complainants | 31 | | Appeals received during the year from REs | 0 | | Total appeals handled during the year | 31 | | Appeal disposed during the year | 2 | | Pending at the end of the year | 29* | | Mode of Disposal | | Appeals remanded to the RBIO | 0 | | Appeals withdrawn / settled / infructuous | 2 | | Appeals rejected | 0 | | Appeals allowed | 0 | | Appeals Disposed | | i. In favour of complainant appellant | 0 | | ii. In favour of REs | 0 | | iii. Neither in favour of complainant appellant nor in favour of REs (Remanded back to BO / infructuous) | 2 | | *Of the 29 RB-IOS appeals pending up to March 31, 2022, 20 have since been disposed |
Chapter 6: Other Developments The year marked landmark developments for customer protection as major structural improvements were brought about in the Alternate Grievance Redress domain. The year witnessed the launch of the RB-IOS, 2021 on November 12, 2021, along with setting-up of the first ever CRPC and Contact Center, at RBI Regional Office, Chandigarh. New entities have also been brought under the RB-IOS coverage. The CMS was upgraded to adapt to the structural changes in the RB-IOS, 2021 and to improve its overall efficiency. The IO Scheme for NBFCs was issued on the lines of the IO Scheme for banks and non-bank payment system participants. A nationwide customer satisfaction survey for those complainants who approached the Ombudsman Offices was undertaken in March 2022 to assess their satisfaction level. | Regulations: Important regulatory measures taken by the Reserve Bank 6.1 The most important regulatory development during the period, with implications for customer protection and customer grievance redress was the launch of the RB-IOS, 2021, along with the setting up of the CRPC and Contact Centre at RBI Regional Office, Chandigarh. In addition, the Reserve Bank issued guidelines on: appointment of IO by NBFCs; monitoring availability of cash in ATMs; Tokenisation for card transactions; restriction on storage of actual card data; framework for facilitating small value digital payments in offline mode etc., among others, which have a bearing on customer service aspects. A chronology of the salient measures is given in the Appendix 6.1. Root Cause Analysis (RCA) of major areas of complaints 6.5 The findings of RCA of the major areas of complaints undertaken by the ORBIOs and CEPCs are compiled in CEPD with the objective of identifying and addressing the underlying deficiencies in customer service and initiating actions to address them. The findings of RCA conducted during the year are tabulated below: | Table 6.1 RCA-2021 – 2022 – Major concerns, root causes identified and remedial measures | | S. No. | Issue | Major Concerns Raised | Root Causes | Remedial Measures | | 1 | Credit Cards | Charges without prior notice. | Lack of awareness among customers regarding the general terms and conditions of usage of credit cards such as minimum amount due, due date, billing cycle, total outstanding balance, impact on Credit Information Bureau of India Limited (CIBIL) score, etc. | Relevant regulatory instructions pertaining to clarity in communication of terms and conditions, reporting to CICs, Most Important Terms and Conditions (MITC) are already in place; Instructions have been reiterated to the REs for enhancing awareness among customers and strict adherence thereto. This is taken up during the RBIO and CEPD awareness programmes also. | | Fraudulent transactions in undelivered Credit Cards; | REs issuing pre-activated Credit Cards;
Billing of undelivered/ returned Credit Cards. | REs to ensure confirmation of the delivery of the credit card to the intended customer before initiation of billing;
REs advised to put in place a dynamic customer controlled mode of authentication for activation of new credit cards. | | 2 | Remittances | Erroneous Fund Transfers;
Fraudulent / unauthorized transactions. | Inaction or delay in taking remedial measures by REs;
Ineffective velocity check and alert systems of REs;
'One-size-fits-all' approach being implemented by REs in fraud detection and prevention systems;
Lack of awareness amongst the public regarding the modus operandi of the digital frauds and do’s and don’ts as safeguard measures. | Prompt raising of chargeback request in NPCI portal by REs;
REs advised to design and have in place dynamic/ robust transaction monitoring systemsbased on the individual profile and history of transactions;
Focused, intensified and wide-spread awareness campaign on the common modus operandi of fraudsters, and safe digital banking practices is underway. | | 3 | Loans and Advances | Non-release of Government subsidy on education loan, home loan under Pradhan Mantri Awas Yojana (PMAY) Scheme, Gold loan etc. | Delay at RE's end in processing/lodging the claims on the government portal;
Inability of the RE functionaries in guiding the customers on various features of the subsidy schemes due to lack of awareness/ knowledge. | REs have been advised to provide proper training to their staff on the subsidy schemes, and sensitize them on timely/ correct lodgment of claims on the government portals. | | 4 | Deposit Accounts | Settlement of Death Claim. | REs insisting on multitude of documents before releasing the claim amount to the legal heir/nominee in contravention to extant regulatory guidelines. | REs have been advised to sensitize the staff regarding the modalities of death claim settlement as outlined in relevant regulatory guidelines thereby ensuring expeditious and seamless disposal of death claim related cases. | | 5 | Pension | Non-payment/ delay in crediting of pension/ family pension/ arrears on account of wage revision, etc. | Delay in updation of life certificates by the customers;
Improper recording of submission of life certificates at the branches. | REs have been advised to employ proper mechanism to monitor, remind and update the Life Certificates in time. | | NBFCs related | | 6 | Loans and Advances | Harassment by Recovery Agents; Non-compliance to Fair Practices;
Lack of transparency in communicating interest rates on loans. | Insufficient/ improper training to recovery agents and lack of awareness on the RBI guidelines on FPC;
Lack of transparency in communicating various applicable charges like bounce charges, late payment charges, etc.;
Common public not fully aware of the interest rate terminologies used by the entities. | Relevant regulatory instructions on FPC for Lenders and NBFCs are in place, and the REs have been advised for strict adherence. | Status of implementation of the action plan set out in ‘Utkarsh 2022’ for the year, April 1, 2021 to March 31, 2022 6.6 The medium-term strategy of RBI, ‘Utkarsh 2022’, had set three milestones for the year 2021-22 as given below: -
Formulate policy/scheme for handling complaints not covered under Ombudsman Scheme; -
Efforts for inclusion of safe banking practices in educational curriculum; -
Extension of Internal Ombudsman Scheme (IOS) for Financially Sound Well Managed (FSWM) UCBs & RRBs. Formulate policy/scheme for handling complaints not covered under Ombudsman Scheme 6.7 The CEPCs, set up at 30 Regional Offices of RBI, were handling the complaints that were not covered under the erstwhile Ombudsman Schemes. The policy for CEPCs to handle such non-Ombudsman complaints was formulated and issued in June 2019 in the form of a detailed Standard Operating Procedure (SOP), which has been revised and issued in June 2022 in the wake of RB-IOS, 2021. Post the launch of RB-IOS, 2021, the CEPCs shall now handle the complaints against REs that are not covered under the RB-IOS, 2021 (i.e., non-scheduled UCBs having deposit size of less than ₹50 crore, NBFCs with asset size below ₹100 crore, All India Financial Institutions, Asset Reconstruction Companies etc.). Efforts for inclusion of safe banking practices in educational curriculum 6.8 The Department had formulated a detailed framework for enhanced education on consumer protection and safe banking practices in September 2020 with the following components – (i) Target Group, (ii) Content, (iii) Delivery Channels, (iv) Coordination Aspects, and (v) Impact analysis. The framework envisages focused financial education to target groups such as potential entrants to the financial sector, vulnerable consumers, educated but financially illiterate customers, rural youth, workers/migrants, etc. The Department prepared contents on financial awareness and consumer protection for inclusion in the educational curriculum of school students, which has been taken up with the National Centre for Financial Education through the Financial Inclusion and Development Department of RBI. Extension of the IO Scheme to NBFCs 6.9 In line with the formulation of IO Scheme for banks and Non-bank System Participants (NBSPs), considering the drastic increase in complaints received at RBI, a review was undertaken to consider extending the IO Scheme to select NBFCs. Accordingly, the IO Scheme for NBFCs, issued vide circular dated November 15, 2021, directed Deposit-taking NBFCs (NBFCs-D) with 10 or more branches and Non-Deposit taking NBFCs (NBFCs-ND) with asset size of ₹5,000 crore or above having public customer interface to appoint IO at the apex of their internal grievance redress mechanism within a period of six months from the date of issue of the direction. The direction covers, inter-alia, the appointment/tenure, role and responsibilities, procedural guidelines, and oversight mechanism for the IO. All complaints that are partly or wholly rejected by the NBFC will be reviewed by the IO before the final decision of the NBFC is conveyed to the complainant. 6.10 NBFCs not having public customer interface and certain types of NBFCs, viz., stand-alone Primary Dealers (PDs), NBFC - Infrastructure Finance Companies (NBFC-IFCs), Core Investment Companies (CICs), Infrastructure Debt Fund – Non Banking Financial Companies (IDF-NBFCs), Non-Banking Financial Company – Account Aggregators (NBFC-AAs), NBFCs under Corporate Insolvency Resolution Process, NBFCs in liquidation and NBFCs having only captive customers have been excluded from the requirement to appoint IOs. Awareness generation activities of CEPD and Ombudsmen Offices 6.11 “Ombudsman Speak” event on the World Consumer Rights Day - As part of the first phase of the nation-wide multi-phased financial awareness campaign being undertaken by CEPD during the year 2022-23, the 22 RBI Ombudsmen interacted with the local/ regional multimedia channels in their respective regions on March 15, 2022 on the occasion of “World Consumer Rights day”. The Ombudsmen covered a wide range of areas such as ‘Frequently Asked Questions’ on RB-IOS, 2021, ‘Charter of Customer Rights’, safe digital banking practices, etc. in order to ensure deeper and focused percolation of the financial consumer awareness on safe banking, RBI’s AGR avenues and extant regulations for protection of consumer interests. The event was undertaken in English, Hindi and vernacular languages and was aired on Doordarshan, All India Radio, FM and local TV channels across all regions/ states of India. These interactions have also been uploaded by media channels on social media platforms such as You Tube, Twitter and Facebook, etc. 6.12 Further, CEPD also conducted digital awareness drives through print/ television advertisements on the RB-IOS, 2021, safe banking practices, RBI regulations on consumer protection etc. Moreover, 175 awareness programmes and 29 townhall meetings were conducted through the ORBIOs and CEPCs with focus on specific groups such as servicemen, school/ college students, consumer groups etc. A list of the awareness programmes conducted by Ombudsmen is provided at Appendix 6.2. 6.13 Further, awareness messages on safe banking practices were hosted on the Reserve Bank website, the ‘RBI Kehta Hai’ webpage and the CMS webpage and included information on ‘cyber frauds’, ‘safe digital banking’, ‘Ombudsman Schemes of RBI’ and the ‘CMS’ portal, etc. Nationwide Customer Satisfaction Survey for RB-IOS, CRPC and the Contact Center 6.14 Six months post the launch of RB-IOS, 2021, a nationwide customer satisfaction survey was taken up to assess the satisfaction level of the complainants who had approached the RBI Ombudsman for redress of their grievances. Based on a volume of around 3.5 lakh complaints received during a year at the ORBIOs, a sample size of 4,120 was designed stratifying them across states and population groups (i.e. Metropolitan regions, urban, semi-urban, and rural areas). The survey was conducted through a third-party agency through telephonic access. The profile of the respondents for the survey is detailed in the Chart 6.1. 6.15 The major findings from the above survey are: -
60.09% of the respondents (who had lodged a complaint both under one of the erstwhile Ombudsman Schemes and the current RB-IOS) felt that the overall process under RB-IOS has improved, including registration, handling of complaint and resolution time; -
64.06% of the respondents felt that they were provided with necessary/ relevant/ correct information when they had approached the Contact Centre; -
The overall satisfaction level of respondents with all the ORBIOs stood at 59.55%; -
83.26% of the respondents agreed to have received acknowledgement promptly. 6.17 It is felt that the RB-IOS, 2021 is stabilizing well, with improved systems and efficiency brought in through CRPC and Contact Center. RBI is also intensifying its efforts to increase awareness regarding the RB-IOS, 2021. Framework for Strengthening the Grievance Redress of banks 6.18 Reserve Bank rolled out the ‘Framework for Strengthening the Grievance Redress of banks’ in January 2021, comprising enhanced disclosures requirements, intensive review of banks’ internal grievance redress mechanism and, supervisory/ regulatory actions against banks having persistent issues in their grievance redress mechanism. The framework introduced recovery of the cost of redressal of complaints at Ombudsmen offices, from the outlier banks to incentivize banks to strengthen their internal grievance redressal systems. The framework is expected to bring improvements in the quality of customer service and grievance redress culture in banks and thus reduce the origination of customer complaints. For the year 2021-22, recoveries to the tune of ₹7.80 crore shall be made from 33 banks. Winding down of Banking Codes and Standards Board of India (BCSBI) 6.19 BCSBI was institutionalized based on the recommendation of the Committee on Procedures and Performance Audit of Public Services under the chairmanship of Shri S.S.Tarapore, former DG of RBI. It was registered as an independent and autonomous body under the Societies Registration Act, 1860 in February 2006. Upon a review conducted by CEPD, it was concluded that Reserve Bank can, by itself, undertake the activities that were identified for BCSBI; and that the BCSBI had now served the purpose for which it was set up. As such, the need for BCSBI to continue was reviewed based on the directions of the Committee of the Central Board in its meeting dated January 30, 2019 and its dissolution was approved. BCSBI ceased its operations and initiated the dissolution process in late 2019, which was however delayed invariably due to the onset of pandemic in March 2020 hindering the conduct of General Body Meeting with member banks for passing of resolution. However, the same was conducted in September 2021 and the BSCBI is in an advanced stage of dissolution. CEPD has taken up with IBA for future updation of the BCSBI’s Codes, i.e., “Code of Bank’s Commitment to Customers” and “Code of Bank’s Commitment to Micro and Small Enterprises”, and management of the membership of the banks. Documents/ historical records relating to BCSBI are in the process of being archived for future reference. Way forward 6.20 During the period April 1, 2022 to March 31, 2023, CEPD will work towards the following action plans: -
Review of the guidelines issued under “Strengthening of grievance redress framework for banks” in January 2021. -
Extension of the ambit of the RB-IOS, 2021 to more REs that are not covered presently under the Scheme like Housing Finance Companies (HFC) etc; -
Extension of IO Scheme for Credit Information Companies (CICs) and HFCs; -
Intensified awareness initiatives to ensure percolation to the remotest and untouched regions and hitherto, excluded segments of population. 6.21 Appropriate regulatory initiatives regarding financial consumer protection will be further enhanced to identify issues to be addressed and improve the grievance redress mechanism of REs as well as the RBI, and measures for implementation of the framework for financial education shall be improved.
Chapter 7: Complaints received through Centralised Public Grievance Redress and Monitoring System (CPGRAMS) and applications under Right to Information (RTI) Act, 2005 During the year 4,956 complaints were received through CPGRAMS and 1,397 applications were received under the RTI Act, 2005 in all the ORBIOs which were replied to. | CPGRAMS 7.1 CPGRAMS is a mechanism to receive and address consumer complaints regarding different products and schemes offered by the GoI or its agencies. The CPGRAMS portal has been developed by the Department of Administrative Reforms and Public Grievances of GoI. Government departments and banks are subordinate offices in this portal. CEPD is the Nodal Office for the Reserve Bank, and the ORBIOs, inter-alia, are its subordinate offices. 7.2 During the year, 4,956 complaints were received by all the ORBIOs through CPGRAMS. A comparative position of the complaints received through this portal and handled by the ORBIOs during the last three years is given at Appendix 7.1. RTI Act, 2005 7.3 The RBI Ombudsmen are the Central Public Information Officers (CPIOs) under the RTI Act, 2005 to receive applications and furnish information related to complaints handled by the ORBIOs. During the year, 1,397 RTI applications were received by all the ORBIOs. The office-wise position of such applications received during the last three years is detailed at Appendix 7.2.
APPENDICES Appendices pertaining to Activities during April 1, 2021 to March 31, 2022 | Appendix 1.1: Category wise receipt of complaints under the Ombudsman Schemes for the past three years | | Nature of Complaints | 2019-20 (Jul-Jun) | 2020-21 (Apr-Mar) | 2021-22 (Apr-Mar) | | Complaints against banks | | ATM / Debit Cards | 67,800 | 60,203 | 41,375 | | | 21.97% | 17.62% | 15.43% | | Mobile / electronic banking | 41,310 | 44,385 | 39,388 | | | 13.38% | 12.99% | 14.69% | | Credit Cards | 28,713 | 40,721 | 32,162 | | | 9.30% | 11.92% | 12.00% | | Non-observance of FPC | 36,215 | 33,898 | 24,446 | | | 11.73% | 9.92% | 9.12% | | Loans and advances | 16,437 | 20,218 | 24,507 | | | 5.33% | 5.92% | 9.14% | | Failure to meet commitments | 25,036 | 35,999 | 22,031 | | | 8.11% | 10.53% | 8.22% | | Deposit Accounts related | 8,778 | 8,580 | 16,388 | | | 2.84% | 2.51% | 6.11% | | Levy of charges without prior notice | 18,558 | 20,949 | 12,765 | | | 6.01% | 6.13% | 4.76% | | Pension payments | 6,307 | 4,966 | 6,179 | | | 2.04% | 1.45% | 2.30% | | Non-adherence to BCSBI Codes | 14,194 | 14,490 | 4,816 | | | 4.60% | 4.24% | 1.80% | | Remittances | 4,045 | 3,394 | 3,235 | | | 1.31% | 0.99% | 1.21% | | DSAs and recovery agents | 1,406 | 2,440 | 1,604 | | | 0.46% | 0.71% | 0.60% | | Para banking | 1,117 | 1,236 | 1,480 | | | 0.36% | 0.36% | 0.55% | | Notes and Coins | 514 | 332 | 296 | | | 0.17% | 0.10% | 0.11% | | Out of purview of BOS | 8,996 | 10,250 | 5,726 | | | 2.91% | 3.00% | 2.14% | | Others | 29,204 | 39,686 | 31,687 | | | 9.46% | 11.61% | 11.82% | | Total (Banks) | 3,08,630 | 3,41,747 | 2,68,085 | | Complaints against NBFCs | | Loans & Advances related / Non-adherence to FPC | 7,052 | 17,915 | 18,729 | | | 36.29% | 48.48% | 56.22% | | Non-observance of RBI directions | 3,607 | 6,114 | 1,881 | | | 18.56% | 16.55% | 5.65% | | Levy of charges without prior notice | 1,628 | 3,189 | 1,751 | | | 8.38% | 8.63% | 5.26% | | Non-transparency in contract/ loan | 1,704 | 1,833 | 512 | | | 8.77% | 4.96% | 1.54% | | Delay in repayment of deposits | 395 | 536 | 319 | | | 2.03% | 1.45% | 0.96% | | Delay in release of securities/ documents | 268 | 417 | 284 | | | 1.38% | 1.13% | 0.85% | | No communication about loan sanctioned | 399 | 375 | 264 | | | 2.05% | 1.01% | 0.79% | | Delay in payment of interest | 232 | 386 | 185 | | | 1.19% | 1.04% | 0.56% | | Non-understandable or no adequate notice on terms and conditions | 82 | 145 | 91 | | | 0.42% | 0.39% | 0.27% | | Non-understandable or non-issuance of sanction letter/ terms | 49 | 85 | 46 | | | 0.25% | 0.23% | 0.14% | | Not covered under Clause 8 of the Scheme | 474 | 1,169 | 1,626 | | | 2.44% | 3.16% | 4.88% | | Others | 3,542 | 4,787 | 7,626 | | | 18.23% | 12.95% | 22.89% | | Total (NBFCs) | 19,432 | 36,951 | 33,314 | | Complaints against NBPSPs | | Mobile/Electronic Fund Transfers / Mobile/Electronic Banking | 598 | 824 | 1,209 | | | 24.10% | 22.93% | 39.04% | | Fund Transfers/ UPI/ BBPS/ Bharat QR Code | 1,089 | 1,775 | 951 | | | 43.89% | 49.39% | 30.71% | | Prepaid Payment Instruments (PPI) | 198 | 253 | 218 | | | 7.98% | 7.04% | 7.04% | | Non-reversal of Funds due to Wrong Beneficiary Transfer by System Participant | 218 | 291 | 186 | | | 8.79% | 8.10% | 6.01% | | Violation of RBI Directives in relation to Fees/Charges | 58 | 100 | 61 | | | 2.34% | 2.78% | 1.97% | | Out of Subject | 75 | 57 | 11 | | | 3.02% | 1.59% | 0.36% | | Others | 245 | 294 | 461 | | | 9.88% | 8.18% | 14.89% | | Total (NBPSPs) | 2,481 | 3,594 | 3,097 | | | | | | | Grand Total | 3,30,543 | 3,82,292 | 3,04,496* | | * Apart from the figures given in the above table, 1,13,688 complaints were closed at CRPC during 2021-22 under RB-IOS. |
| Appendix 1.2: ORBIO-wise position of Appeals received during April 1, 2021 to March 31, 2022 | | ORBIO | OVERALL | BOS | OSNBFC | OSDT | RBIOS | | Ahmedabad | 3 | 2 | 0 | 0 | 1 | | Bangalore | 1 | 1 | 0 | 0 | 0 | | Bhopal | 1 | 0 | 0 | 0 | 1 | | Bhubaneswar | 4 | 2 | 0 | 0 | 2 | | Chandigarh | 7 | 6 | 0 | 0 | 1 | | Chennai | 24 | 13 | 9 | 0 | 2 | | Dehradun | 0 | 0 | 0 | 0 | 0 | | Guwahati | 4 | 0 | 0 | 0 | 4 | | Hyderabad | 2 | 0 | 0 | 0 | 2 | | Jaipur | 1 | 0 | 0 | 0 | 1 | | Jammu | 2 | 1 | 0 | 0 | 1 | | Kanpur | 16 | 13 | 0 | 0 | 3 | | Kolkata | 1 | 0 | 0 | 0 | 1 | | Mumbai-I | 4 | 4 | 0 | 0 | 0 | | Mumbai-II | 7 | 3 | 0 | 0 | 4 | | New Delhi-I | 6 | 2 | 0 | 0 | 4 | | New Delhi-II | 1 | 0 | 1 | 0 | 0 | | New Delhi-III | 5 | 3 | 0 | 0 | 2 | | Patna | 0 | 0 | 0 | 0 | 0 | | Raipur | 1 | 0 | 0 | 0 | 1 | | Ranchi | 0 | 0 | 0 | 0 | 0 | | Thiruvananthapuram | 2 | 1 | 0 | 0 | 1 | | Total | 92 | 51 | 10 | 0 | 31 |
| Appendix 1.3: Office-wise Cost of handling complaints at ORBIOs | | Office | Average Cost | Total Cost | | Ahmedabad | 3,983 | 65,452,408 | | Bengaluru | 3,820 | 56,781,829 | | Bhopal | 3,432 | 43,951,512 | | Bhubaneswar | 6,089 | 46,870,000 | | Chandigarh | 2,061 | 41,800,000 | | Chennai | 3,567 | 77,533,000 | | Dehradun | 2,132 | 17,910,000 | | Guwahati | 8,852 | 48,277,000 | | Hyderabad | 3,865 | 59,970,000 | | Jaipur | 2,897 | 52,230,013 | | Jammu | 4,749 | 23,990,000 | | Kanpur | 2,104 | 54,940,000 | | Kolkata | 4,608 | 70,787,210 | | Mumbai-I | 2,865 | 55,546,975 | | Mumbai-II | 2,166 | 45,650,000 | | New Delhi-I | 4,122 | 63,071,638 | | New Delhi-II | 2,347 | 63,453,492 | | New Delhi-III | 7,237 | 66,000,000 | | Patna | 3,132 | 44,193,930 | | Raipur | 4,161 | 22,279,000 | | Ranchi | 3,660 | 22,340,000 | | Thiruvananthapuram | 4,937 | 39,260,000 | | CRPC | 327 | 48,812,000 | | CMS Cost | 190 | 79,571,790 | | Cost of handling a complaint | 2,895 | 121,06,71,797 |
| Appendix 1.4: Complainant group-wise classification of complaints | | Complainant Type | 2019-20 | 2020-21 | 2021-22 | (Apr 1, 2021 - Nov 11, 2021) | Nov 12, 2021 - Mar 31, 2022 | | (Jul-Jun) | (Apr-Mar) | (Apr-Mar) | BOS | OSNBFC | OSDT | RB-IOS | | Individual | 2,73,432 | 3,05,093 | 2,43,244 | 1,70,614 | 10,466 | 1,762 | 60,402 | | | 82.72% | 79.81% | 79.88% | 81.56% | 51.21% | 77.25% | 83.22% | | Individual – Business | 10,831 | 13,614 | 10,400 | 7,906 | 609 | 85 | 1,800 | | | 3.28% | 3.56% | 3.42% | 3.78% | 2.98% | 3.73% | 2.48% | | Proprietorship / Partnership | 5,583 | 7,505 | 6,712 | 4,795 | 351 | 31 | 1,535 | | | 1.69% | 1.96% | 2.20% | 2.29% | 1.72% | 1.36% | 2.11% | | Limited Company | 6,917 | 8,381 | 7,427 | 4,712 | 525 | 72 | 2,118 | | | 2.09% | 2.19% | 2.44% | 2.25% | 2.57% | 3.16% | 2.92% | | Trust | 559 | 665 | 613 | 428 | 28 | 7 | 150 | | | 0.17% | 0.17% | 0.20% | 0.20% | 0.14% | 0.31% | 0.21% | | Association | 446 | 372 | 427 | 288 | 11 | 5 | 123 | | | 0.13% | 0.10% | 0.14% | 0.14% | 0.05% | 0.22% | 0.17% | | Government Department | 5,180 | 6,447 | 4,993 | 3,827 | 58 | 54 | 1,054 | | | 1.57% | 1.69% | 1.64% | 1.83% | 0.28% | 2.37% | 1.45% | | PSU | 1,297 | 1,475 | 1,799 | 803 | 14 | 5 | 977 | | | 0.39% | 0.39% | 0.59% | 0.38% | 0.07% | 0.22% | 1.35% | | Senior Citizen | 8,237 | 10,061 | 9,244 | 7,185 | 103 | 32 | 1,924 | | | 2.49% | 2.63% | 3.04% | 3.43% | 0.50% | 1.40% | 2.65% | | Others | 18,061 | 28,679 | 19,637 | 8,638 | 8274 | 228 | 2,497 | | | 5.46% | 7.50% | 6.45% | 4.13% | 40.48% | 10.00% | 3.44% | | Total | 3,30,543 | 3,82,292 | 3,04,496* | 2,09,196 | 20,439 | 2,281 | 72,580 | | * Apart from the figures given in the above table, 1,13,688 complaints were closed at CRPC during 2021-22 under RB-IOS. |
| Appendix 1.5: Mode of disposal of Maintainable Complaints against Scheduled Commercial Banks | | Name of the Bank | Total Maintainable Complaints disposed during the year 2021-22 | Of (2), Complaints resolved through conciliation/ mediation/issuance of advisories | Of (2) Complaints resolved through Awards | Of (4), Awards unimplemented within stipulated time (other than appealed) | | (1) | (2) | (3) | (4) | (5) | | Public Sector Banks | | | | | | STATE BANK OF INDIA | 35,106 | 22,568 | 3 | 0 | | BANK OF BARODA | 7,754 | 5,412 | 3 | 0 | | BANK OF INDIA | 4,635 | 3,279 | 0 | 0 | | BANK OF MAHARASHTRA | 1,103 | 712 | 2 | 0 | | CANARA BANK | 7,131 | 4,855 | 1 | 0 | | CENTRAL BANK OF INDIA | 4,433 | 3,116 | 1 | 0 | | INDIAN BANK | 5,336 | 3,704 | 2 | 0 | | INDIAN OVERSEAS BANK | 1,516 | 858 | 0 | 0 | | PUNJAB AND SIND BANK | 564 | 370 | 0 | 0 | | PUNJAB NATIONAL BANK | 12,389 | 8,765 | 2 | 0 | | UCO BANK | 1,539 | 1,017 | 0 | 0 | | UNION BANK OF INDIA | 7,970 | 5,584 | 1 | 0 | | All Public Sector Banks | 89,476 | 60,240 | 15 | 0 | | | | | | | | Private Sector Banks | | | | | | AXIS BANK LIMITED | 10,181 | 6,222 | 0 | 0 | | BANDHAN BANK LIMITED | 419 | 245 | 0 | 0 | | CSB BANK LTD | 61 | 34 | 0 | 0 | | CITY UNION BANK LIMITED | 175 | 90 | 0 | 0 | | DCB BANK LIMITED | 353 | 205 | 0 | 0 | | DHANLAXMI BANK LIMITED | 31 | 16 | 0 | 0 | | FEDERAL BANK LTD | 569 | 324 | 0 | 0 | | HDFC BANK LTD. | 10,499 | 6,000 | 0 | 0 | | ICICI BANK LIMITED | 12,174 | 6,600 | 0 | 0 | | IDBI BANK LIMITED | 1,475 | 843 | 0 | 0 | | IDFC FIRST BANK LIMITED | 2,108 | 1,421 | 0 | 0 | | INDUSIND BANK LTD | 3,279 | 1,763 | 1 | 0 | | JAMMU & KASHMIR BANK LTD | 419 | 241 | 0 | 0 | | KARNATAKA BANK LTD | 381 | 202 | 0 | 0 | | KARUR VYSYA BANK LTD | 320 | 166 | 0 | 0 | | KOTAK MAHINDRA BANK LTD. | 4,708 | 2,767 | 1 | 0 | | NAINITAL BANK LTD | 37 | 20 | 0 | 0 | | RBL BANK LTD | 4,615 | 3,122 | 0 | 0 | | SOUTH INDIAN BANK LTD | 251 | 121 | 1 | 0 | | TAMILNAD MERCANTILE BANK LTD | 209 | 93 | 0 | 0 | | YES BANK LTD. | 1,563 | 911 | 1 | 0 | | All Private Sector Banks | 53,827 | 31,406 | 4 | 0 | | | | | | | | Payment Banks | | | | | | AIRTEL PAYMENTS BANK LIMITED | 1,793 | 1,385 | 0 | 0 | | FINO PAYMENTS BANK LIMITED | 107 | 64 | 0 | 0 | | INDIA POST PAYMENTS BANK LIMITED | 118 | 67 | 0 | 0 | | JIO PAYMENTS BANK LIMITED | 5 | 1 | 0 | 0 | | NSDL PAYMENTS BANK LIMITED | 45 | 36 | 0 | 0 | | PAYTM PAYMENTS BANK LIMITED | 1,275 | 828 | 0 | 0 | | All Payment Banks | 3,343 | 2,381 | 0 | 0 | | | | | | | | Small Finance Banks | | | | | | AU SMALL FINANCE BANK LIMITED | 412 | 253 | 0 | 0 | | CAPITAL SMALL FINANCE BANK LIMITED | 23 | 10 | 0 | 0 | | EQUITAS SMALL FINANCE BANK LIMITED | 202 | 107 | 0 | 0 | | ESAF SMALL FINANCE BANK LIMITED | 31 | 19 | 0 | 0 | | FINCARE SMALL FINANCE BANK LIMITED | 107 | 78 | 0 | 0 | | JANA SMALL FINANCE BANK LIMITED | 130 | 80 | 0 | 0 | | NORTH EAST SMALL FINANCE BANK LIMITED | 2 | 1 | 0 | 0 | | SURYODAY SMALL FINANCE BANK LIMITED | 22 | 13 | 0 | 0 | | UJJIVAN SMALL FINANCE BANK LIMITED | 163 | 83 | 0 | 0 | | UTKARSH SMALL FINANCE BANK LIMITED | 43 | 21 | 0 | 0 | | All Small Finance Banks | 1,135 | 665 | 0 | 0 | | | | | | | | Foreign Banks | | | | | | AB BANK LIMITED | - | - | 0 | 0 | | ABU DHABI COMMERCIAL BANK PJSC | - | - | 0 | 0 | | AMERICAN EXPRESS BANKING CORP. | 204 | 122 | 0 | 0 | | BARCLAYS BANK PLC | 14 | 11 | 0 | 0 | | BANK OF AMERICA NATIONAL ASSOCIATION | 2 | - | 0 | 0 | | BANK OF BAHRAIN & KUWAIT B.S.C. | - | - | 0 | 0 | | BNP PARIBAS | - | - | 0 | 0 | | CITIBANK N.A | 909 | 475 | 0 | 0 | | DBS BANK INDIA LIMITED | 270 | 136 | 0 | 0 | | DEUTSCHE BANK AG | 86 | 60 | 0 | 0 | | DOHA BANK QSC | 1 | 1 | 0 | 0 | | EMIRATES NBD BANK (P.J.S.C.) | - | - | 0 | 0 | | FIRSTRAND BANK LTD | - | - | 0 | 0 | | HONGKONG AND SHANGHAI BANKING CORPN.LTD. | 259 | 155 | 0 | 0 | | INDUSTRIAL AND COMMERCIAL BANK OF CHINA | - | - | 0 | 0 | | JPMORGAN CHASE BANK NATIONAL ASSOCIATION | - | - | 0 | 0 | | MIZUHO BANK LTD | 1 | - | 0 | 0 | | MUFG BANK LTD. | - | - | 0 | 0 | | NATWEST MARKETS PLC (ERSTWHILE THE ROYAL BANK OF SCOTLAND PLC) | 8 | 5 | 0 | 0 | | SBM BANK (MAURITIUS)LTD. | 72 | 54 | 0 | 0 | | SHINHAN BANK | 3 | 3 | 0 | 0 | | SONALI BANK | - | - | 0 | 0 | | STANDARD CHARTERED BANK | 1,091 | 669 | 0 | 0 | | UNITED OVERSEAS BANK LTD | - | - | 0 | 0 | | WOORI BANK | 1 | 1 | 0 | 0 | | All Foreign Banks | 2,921 | 1,692 | 0 | 0 | | | | | | | | All Regional Rural Banks | 2,416 | 1,644 | 1 | 0 | | | | | | | | All Scheduled Commercial Banks | 153,118 | 98,028 | 20 | 0 | | | | | | | | Others (including Cooperative banks, NBFCs, PPIs) | 22,623 | 13,792 | 13 | 0 | | GRAND TOTAL | 175,741 | 1,11,820 | 33 | 0 | Appendices pertaining to BOS Appendix 2.1: Mode of receipt of complaints under the BOS
(April 1, 2021 – November 11, 2021) | | Mode of Receipt | No. of complaints received during | % change
(Y-o-Y - annualised) | | 2019-20 (Jul-Jun) | 2020-21 (Apr - Mar) | 2021-22 (Apr-Nov) | | Email | 1,09,740 | 1,07,443 | 57,694 | -12.9% | | 35.56% | 31.44% | 27.58% | | Online | 1,54,580 | 2,01,581 | 1,29,845 | 4.5% | | 50.09% | 58.99% | 62.07% | | Post/Fax/Courier/hand delivery | 44,310 | 32,723 | 21,657 | 7.4% | | 14.36% | 9.58% | 10.35% | | Total | 3,08,630 | 3,41,747 | 2,09,196 | -0.7% |
| Appendix 2.2: Zone-wise receipt of complaints under BOS | | OBO | 2019-20 (Jul-Jun) | 2020-21 (Apr-Mar) | 2021-22 (Apr-Nov) | | East Zone | | Bhubaneshwar | 5,311 | 6,783 | 4,585 | | Guwahati | 3,641 | 3,493 | 2,425 | | Kolkata | 11,699 | 14,207 | 9,192 | | Patna | 17,392 | 17,253 | 10,369 | | Ranchi | 4,581 | 4,724 | 3,189 | | Total | 42,624 | 46,460 | 29,760 | | % share to All India | 13.81% | 13.59% | 14.23% | | | | | | | North Zone | | Chandigarh | 31,594 | 36,488 | 17,038 | | Dehradun | 7,858 | 7,919 | 5,470 | | Jaipur | 18,144 | 21,859 | 14,794 | | Jammu | 1,530 | 1,744 | 1,331 | | Kanpur | 23,895 | 26,278 | 20,872 | | New Delhi-I | 18,147 | 22,957 | 11,836 | | New Delhi-II | 20,817 | 19,956 | 12,377 | | New Delhi-III | 9,589 | 11,011 | 5,606 | | Total | 131,574 | 148,212 | 89,324 | | % share to All India | 42.63% | 43.37% | 42.70% | | | | | | | South Zone | | Bengaluru | 18,475 | 17,114 | 10,356 | | Chennai | 17,724 | 19,697 | 13,137 | | Hyderabad | 19,947 | 21,898 | 11,404 | | Thiruvananthapuram | 6,696 | 7,103 | 4,506 | | Total | 62,842 | 65,812 | 39,403 | | % share to All India | 20.36% | 19.26% | 18.84% | | | | | | | West Zone | | Ahmedabad | 16,008 | 20,945 | 12,634 | | Bhopal | 14,510 | 15,482 | 9,562 | | Mumbai-I | 19,473 | 22,268 | 15,035 | | Mumbai-II | 17,917 | 18,604 | 11,261 | | Raipur | 3,682 | 3,964 | 2,217 | | Total | 71,590 | 81,263 | 50,709 | | % share to All India | 23.20% | 23.78% | 24.24% | | All India Total | 3,08,630 | 3,41,747 | 2,09,196 |
| Appendix 2.3: Office-wise receipt and disposal of complaints received under BOS during April 1, 2021 – November 11, 2021. | | BO | Complaints pending at the beginning of the Year | Complaints transferred from CEPCs and Draft Complaints | Complaints received during the Year | Complaints handled | Complaints disposed | Pending at the end of the year | Rate of disposal (%) | | Ahmedabad | 21 | 102 | 12,634 | 12,757 | 12,757 | 0 | 100.00% | | Bengaluru | 1,494 | 80 | 10,356 | 11,930 | 11,930 | 0 | 100.00% | | Bhopal | 710 | 34 | 9,562 | 10,306 | 10,306 | 0 | 100.00% | | Bhubaneswar | 151 | 4 | 4,585 | 4,740 | 4,740 | 0 | 100.00% | | Chandigarh | 0 | 48 | 17,038 | 17,086 | 17,086 | 0 | 100.00% | | Chennai | 332 | 43 | 13,137 | 13,512 | 13,512 | 0 | 100.00% | | Dehradun | 174 | 22 | 5,470 | 5,666 | 5,666 | 0 | 100.00% | | Guwahati | 20 | 10 | 2,425 | 2,455 | 2,455 | 0 | 100.00% | | Hyderabad | 188 | 26 | 11,404 | 11,618 | 11,618 | 0 | 100.00% | | Jaipur | 872 | 22 | 14,794 | 15,688 | 15,688 | 0 | 100.00% | | Jammu | 1 | 3 | 1,331 | 1,335 | 1,335 | 0 | 100.00% | | Kanpur | 1,794 | 126 | 20,872 | 22,792 | 22,792 | 0 | 100.00% | | Kolkata | 678 | 81 | 9,192 | 9,951 | 9,951 | 0 | 100.00% | | Mumbai-I | 398 | 205 | 15,035 | 15,638 | 15,638 | 0 | 100.00% | | Mumbai-II | 258 | 162 | 11,261 | 11,681 | 11,681 | 0 | 100.00% | | New Delhi-I | 532 | 32 | 11,836 | 12,400 | 12,400 | 0 | 100.00% | | New Delhi-II | 1,455 | 49 | 12,377 | 13,881 | 13,881 | 0 | 100.00% | | New Delhi-III | 207 | 43 | 5,606 | 5,856 | 5,856 | 0 | 100.00% | | Patna | 525 | 105 | 10,369 | 10,999 | 10,999 | 0 | 100.00% | | Raipur | 25 | 8 | 2,217 | 2,250 | 2,250 | 0 | 100.00% | | Ranchi | 48 | 11 | 3,189 | 3,248 | 3,248 | 0 | 100.00% | | Thiruvananthapuram | 199 | 39 | 4,506 | 4,744 | 4,744 | 0 | 100.00% | | Total | 10,082 | 1,255 | 2,09,196 | 2,20,533 | 2,20,533 | 0 | 100.00% | Appendices pertaining to OSNBFC | Appendix 3.1: Mode of receipt of complaints | | Mode of receipt | No. of complaints received during | | 2019-20 (Jul-Jun) | 2020-21 (Apr - Mar) | 2021-22 (Apr 1, 2021 - Nov 11, 2021) | | Email | 10,365 | 18,156 | 8,713 | | 53.34% | 49.14% | 42.63% | | Online | 7,737 | 16,999 | 10,535 | | 39.82% | 46.00% | 51.54% | | Post / Fax / Courier / hand delivery | 1,330 | 1,796 | 1,191 | | 6.84% | 4.86% | 5.83% | | Total | 19,432 | 36,951 | 20,439 |
| Appendix 3.2: ONBFCO-wise position of complaints during April 1, 2021 to November 11, 2021 | | ONBFC-O | Complaints brought forward from previous year | Complaints received | Complaints of 2020-21 (transferred from CEPCs and drafts converted) | Complaints handled | Complaints disposed | Pending at the end of the year | Rate of disposal | | Chennai | 184 | 4,415 | 18 | 4,619 | 4,619 | 0 | 100% | | Delhi | 1,135 | 8,628 | 192 | 9,946 | 9,946 | 0 | 100% | | Kolkata | 0 | 1,870 | 33 | 1,905 | 1,905 | 0 | 100% | | Mumbai | 0 | 5,526 | 76 | 5,607 | 5,607 | 0 | 100% | | Total | 1,319 | 20,439 | 319 | 22,077 | 22,077 | 0 | 100% |
| Appendix 3.3: NBFCO-wise position of maintainable complaints disposed during April 1, 2021 to November 11, 2021 | | ONBFCO | Maintainable | Non-maintainable | Total Disposed | | Chennai | 2,969 | 1,650 | 4,619 | | Delhi | 5,549 | 4,397 | 9,946 | | Kolkata | 1,194 | 711 | 1,905 | | Mumbai | 2,441 | 3,166 | 5,607 | | Total | 12,153 | 9,924 | 22,077 | Appendices pertaining to OSDT | Appendix 4.1: Mode of receipt of complaints | | Mode of receipt | No. of complaints received during | | 2019-20 (Jul-Jun) | 2020-21 (Apr - Mar) | 2021-22 (Apr 1, 2021 - Nov 11, 2021) | | Email | 227 | 260 | 154 | | 9.15% | 7.23% | 6.75% | | Online | 2,239 | 3331 | 2124 | | 90.25% | 92.68% | 93.12% | | Post/ Fax/ Courier/ Hand delivery | 15 | 3 | 3 | | 0.60% | 0.08% | 0.13% | | Total | 2,481 | 3,594 | 2,281 |
| Appendix 4.2: Zone-wise receipt of complaints | | East Zone | 2019-20 (Jul-Jun) | 2020-21 (Apr - Mar) | 2021-22 (Apr 1, 2021 - Nov 11, 2021) | | Bhubaneshwar | 75 | 137 | 94 | | Guwahati | 20 | 50 | 27 | | Kolkata | 220 | 239 | 201 | | Patna | 122 | 203 | 130 | | Ranchi | 41 | 41 | 29 | | Total | 478 | 670 | 481 |
| North Zone | 2019-20 (Jul-Jun) | 2020-21 (Apr - Mar) | 2021-22 (Apr 1, 2021 - Nov 11, 2021) | | Chandigarh | 108 | 131 | 73 | | Dehradun | 55 | 51 | 28 | | Jaipur | 141 | 235 | 129 | | Jammu | 8 | 23 | 25 | | Kanpur | 131 | 221 | 115 | | New Delhi-I | 142 | 281 | 137 | | New Delhi-II | 128 | 129 | 106 | | New Delhi-III | 55 | 80 | 42 | | Total | 768 | 1151 | 655 |
| South Zone | 2019-20 (Jul-Jun) | 2020-21 (Apr - Mar) | 2021-22 (Apr 1, 2021 - Nov 11, 2021) | | Bengaluru | 222 | 293 | 189 | | Chennai | 133 | 149 | 116 | | Hyderabad | 196 | 263 | 204 | | Thiruvananthapuram | 27 | 19 | 10 | | Total | 578 | 724 | 519 |
| West Zone | 2019-20 (Jul-Jun) | 2020-21 (Apr - Mar) | 2021-22 (Apr 1, 2021 - Nov 11, 2021) | | Ahmedabad | 74 | 133 | 94 | | Bhopal | 167 | 305 | 138 | | Mumbai-I | 176 | 211 | 186 | | Mumbai-II | 217 | 346 | 182 | | Raipur | 23 | 54 | 26 | | Total | 657 | 1049 | 626 |
| Appendix 4.3: Office-wise receipt and disposal of complaints received at OODTs during the year | | Name of the ODT | Complaints pending at the beginning of the year | Complaints of 2020-21 (transferred from CEPCs and drafts converted) | Complaints received during the year (Apr 1, 2021 to Nov 11, 2021) | Complaints handled | Complaints disposed | Pending at the end of the year | Rate of disposal (%) | | Ahmedabad | 0 | 0 | 94 | 94 | 94 | 0 | 100.00 | | Bengaluru | 20 | 0 | 189 | 209 | 209 | 0 | 100.00 | | Bhopal | 3 | 1 | 138 | 142 | 142 | 0 | 100.00 | | Bhubaneswar | 0 | 0 | 94 | 94 | 94 | 0 | 100.00 | | Chandigarh | 0 | 0 | 73 | 73 | 73 | 0 | 100.00 | | Chennai | 0 | 0 | 116 | 116 | 116 | 0 | 100.00 | | Dehradun | 3 | 0 | 28 | 31 | 31 | 0 | 100.00 | | Guwahati | 0 | 0 | 27 | 27 | 27 | 0 | 100.00 | | Hyderabad | 0 | 0 | 204 | 204 | 204 | 0 | 100.00 | | Jaipur | 0 | 0 | 129 | 129 | 129 | 0 | 100.00 | | Jammu | 0 | 0 | 25 | 25 | 25 | 0 | 100.00 | | Kanpur | 1 | 0 | 115 | 116 | 116 | 0 | 100.00 | | Kolkata | 0 | 5 | 201 | 206 | 206 | 0 | 100.00 | | Mumbai I | 0 | 4 | 186 | 190 | 190 | 0 | 100.00 | | Mumbai II | 0 | 2 | 182 | 184 | 184 | 0 | 100.00 | | New Delhi I | 0 | 0 | 137 | 137 | 137 | 0 | 100.00 | | New Delhi II | 0 | 0 | 106 | 106 | 106 | 0 | 100.00 | | New Delhi III | 0 | 1 | 42 | 43 | 43 | 0 | 100.00 | | Patna | 1 | 2 | 130 | 133 | 133 | 0 | 100.00 | | Raipur | 0 | 0 | 26 | 26 | 26 | 0 | 100.00 | | Ranchi | 0 | 0 | 29 | 29 | 29 | 0 | 100.00 | | Thiruvananthapuram | 0 | 0 | 10 | 10 | 10 | 0 | 100.00 | | Grand Total | 28 | 15 | 2,281 | 2,324 | 2,324 | 0 | 100.00 |
| Appendix 4.4: OODT-wise distribution of maintainable complaints | | Name of the ODT | No. of maintainable complaints | | Ahmedabad | 4 | | Bengaluru | 141 | | Bhopal | 108 | | Bhubaneswar | 51 | | Chandigarh | 31 | | Chennai | 41 | | Dehradun | 14 | | Guwahati | 15 | | Hyderabad | 40 | | Jaipur | 94 | | Jammu | 13 | | Kanpur | 30 | | Kolkata | 115 | | Mumbai I | 5 | | Mumbai II | 52 | | New Delhi I | 60 | | New Delhi II | 44 | | New Delhi III | 33 | | Patna | 12 | | Raipur | 12 | | Ranchi | 10 | | Thiruvananthapuram | 2 | | Grand Total | 927 | Appendices pertaining to RB-IOS, 2021 | Appendix 5.1 – Mode of receipt of complaints during November 12, 2021 to March 31, 2022 | | Mode of receipt | Number of complaints received | % to total complaints | | CMS Portal | 40,029 | 55.15% | | CPGRAMS | 1,354 | 1.87% | | Email | 19,980 | 27.53% | | Physical Letter | 11,217 | 15.45% | | TOTAL | 72,580 | 100% |
| Appendix 5.2 – Zone-wise distribution of complaints received during November 12, 2021 to March 31, 2022 | | ORBIO | Number of complaints received | | North Zone | | Chandigarh | 3,159 | | Dehradun | 2,844 | | Jaipur | 3,222 | | Jammu | 2,944 | | Kanpur | 3,227 | | New Delhi I | 3,337 | | New Delhi II | 3,148 | | New Delhi III | 3,235 | | TOTAL | 25,116 | | % Share to All India | 34.60% | | West Zone | | Ahmedabad | 3,698 | | Bhopal | 3,141 | | Mumbai I | 3,585 | | Mumbai II | 3,703 | | Raipur | 3,119 | | TOTAL | 17,246 | | % Share to All India | 23.76% | | East Zone | | Bhubaneswar | 3,127 | | Guwahati | 2,992 | | Kolkata | 3,503 | | Patna | 3,107 | | Ranchi | 3,089 | | TOTAL | 15,818 | | % Share to All India | 21.79% | | South Zone | | Bengaluru | 3,451 | | Chennai | 3,728 | | Hyderabad | 3,604 | | Thiruvananthapuram | 3,617 | | TOTAL | 14,400 | | % Share to All India | 19.84% |
| Appendix 5.3 – Entity group-wise classification of complaints received during November 12, 2021 to March 31, 2022 | | Entity Group | Number of complaints received | | Public Sector Banks | 35,582 | | 49.02% | | Private Sector Banks | 21,572 | | 29.72% | | Payments and Small Finance Banks | 1,976 | | 2.72% | | Foreign Banks | 1,276 | | 1.76% | | RRBs/ Scheduled Primary Urban Co-op. Banks | 2,216 | | 3.05% | | NBFC | 4,233 | | 5.83% | | PPI/BBPOU | 976 | | 1.34% | | Others | 4,749 | | 6.54% | | Total | 72,580 | | Note: Figures in % indicate percentage share to total complaints. |
| Appendix 6.1: Important notifications relating to Customer Service issued by RBI in 2021-22 (Apr - Mar) | | Date of the circular | Summarized Instructions | | April 1, 2021 | Master Circular on Facility for Exchange of Notes and Coins (RBI/2021-22/01 DCM (NE) No.G-4/08.07.18/2021-22): Mandates, inter-alia, all branches of banks in all parts of the country to issue fresh/ good quality notes and coins of all denominations on demand to the members of public, so that there is no need for them to approach the RBI Regional Offices for this purpose, exchange soiled/ mutilated/ defective notes and accept coins and notes either for transactions or exchange. | | April 1, 2021 | Master Circular – Scheme of Penalties for bank branches including Currency Chests based on performance in rendering customer service to the members of public (RBI/2021-22/03 DCM (CC) No.G-3/03.44.01/2021-22): The Scheme has been formulated to ensure that all bank branches provide better customer service to members of public with regard to exchange of notes and coins, in keeping with the objectives of Clean Note Policy. | | June 10, 2021 | Usage of Automated Teller Machines / Cash Recycler Machines – Review of Interchange Fee and Customer Charges (RBI/2021-22/52 DPSS.CO.OD.No.S-182/06.07.011/2021-22): Considering the need to balance expectations of stakeholder entities and customer convenience, it has been decided to increase the customer charges to ₹21 per transaction. This increase shall be effective from January 1, 2022. Further the interchange fee per transaction has been increased from ₹15 to ₹17 for financial transactions and from ₹5 to ₹6 for non-financial transactions in all centres. This is effective from August 1, 2021. | | June 28, 2021 | Guidelines for Managing Risk in Outsourcing of Financial Services by Co-operative Banks (RBI/2021-22/64DOR.ORG.REC.27/21.04.158/2021-22): Co-operative Banks have been mandated to clearly indicate that its Grievance Redressal Machinery will also deal with the issues relating to services provided by the outsourced agencies. The name and contact number of designated grievance redressal officer of the co-operative bank should be made known and widely publicised. | | July 02, 2021 | Review of Instructions on Interest on overdue domestic deposits (RBI/2021-22/66 DoR.SPE.REC.29/13.03.00/2021-2022): It has been decided that if a Term Deposit (TD) matures and proceeds are unpaid, the amount left unclaimed with the bank shall attract rate of interest as applicable to savings account or the contracted rate of interest on the matured TD, whichever is lower. | | August 03, 2021 | Framework for Outsourcing of Payment and Settlement-related Activities by Payment System Operators (RBI/2021-22/76 CO.DPSS.POLC.No.S-384/02.32.001/2021-2022): Responsibility of addressing the grievances of its customers shall rest with the Payment System Operators (PSO), including services provided by the outsourced agency. A PSO which has outsourced its customer grievance redressal function must also provide its customers the option of direct access to its nodal officials for raising and/ or escalating complaints. | | August 10, 2021 | Monitoring of Availability of Cash in ATMs (RBI/2021-22/84 DCM (RMMT) No.S153/11.01.01/2021-22): The Scheme of Penalty for non-replenishment of ATMs has been formulated to ensure that sufficient cash is available to public through ATMs. Cash-out at any ATM of more than ten hours in a month will attract a flat penalty of ₹ 10,000/- per ATM. In case of White Label ATMs (WLAs), the penalty would be charged to the bank which is meeting the cash requirement of that particular WLA. | | August 18, 2021 | Safe Deposit Locker/Safe Custody Article Facility provided by the banks - Revised Instructions (RBI/2021-2022/86 DOR.LEG.REC/40/09.07.005/2021-22): The instructions cover fresh guidelines related to locker allotment, due diligence, locker operations, the internal controls by banks, nomination facilities and also settlement of claims, amidst others. | | August 25, 2021 | Tokenisation – Card Transactions : Extending the Scope of Permitted Devices (RBI/2021-22/92 CO.DPSS.POLC.No.S-469/02-14-003/2021-22): The scope of tokenisation includes consumer devices such as laptops, desktops, wearables (wrist watches, bands, etc.), Internet of Things (IoT) devices, etc. This initiative is expected to make card transactions more safe, secure and convenient for the users. | | August 27, 2021 | Review of incentive and other measures to enhance distribution of coins (RBI/2021-22/93 DCM (CC) No.97527/03.41.01/2021-22): To ensure that all bank branches provide better customer service and extend the outreach, an incentive of ₹65/- per bag for distribution of coins (instead of ₹25/- as earlier) will be paid on the basis of net withdrawal from currency chest (CCs), without waiting for claims from banks. | | September 07, 2021 | Tokenisation – Card Transactions: Permitting Card-on-File Tokenisation (CoFT) Services (RBI/2021-22/96 CO.DPSS.POLC.No.S-516/02-14-003/2021-22): To enable cardholders to benefit from the security of tokenised card transactions, it has been, inter-alia, decided to effect tokenisation of card data with explicit customer consent requiring Additional Factor of Authentication (AFA) validation by card issuer. | | November 12, 2021 | Reserve Bank - Integrated Ombudsman Scheme, 2021 (Ref.CEPD.PRD.No.S873/13.01.001/2021-22): To make the alternate dispute redress mechanism simpler and more responsive to the customers of entities regulated by RBI, the three Ombudsman schemes – (i) BOS, 2006, as amended up to July 01, 2017; (ii) OSNBFC, 2018; and (iii) the OSDT, 2019 were integrated into the RB,IOS, 2021, which came into force from November 12, 2021. | | November 15, 2021 | Appointment of Internal Ombudsman (IO) by Non-Banking Financial Companies (RBI/2021-2022/126 CO.CEPD.PRS.No.S874/13-01-008/2021-2022): All (i) NBFCs-D with 10 or more branches and (ii) NBFCs-ND with asset size of Rs.5,000 crore and above having public customer interface have been advised to appoint IO at the apex of their internal grievance redress mechanism within a period of six months from the date of issue of this direction, except for certain types of NBFCs as mentioned therein. | | December 30, 2021 | Periodic Updation of KYC – Restrictions on Account Operations for Non-compliance (RBI/2021-22/144 DOR.AML.REC.74/14.01.001/2021-22): REs were advised on May 05, 2021 that in respect of the customer accounts where periodic updation of KYC is due and pending as on date, no restrictions on operations of such account shall be imposed till December 31, 2021, for this reason alone, unless warranted under instructions of any regulator/ enforcement agency/ court of law, etc. In view of the prevalent uncertainty due to new variant of Covid-19, the relaxation provided was extended till March 31, 2022. | | January 03, 2022 | Framework for Facilitating Small Value Digital Payments in Offline Mode (RBI/2021-22/146 CO.DPSS.POLC.No.S1264/02-14-003/2021-2022): The framework to enable small value digital payments in offline mode using cards, wallets, mobile devices, etc., permits the upper limit of an offline payment transaction to be ₹200, with a total limit for offline transactions on a payment instrument being ₹2,000 at any point in time. | | February 10, 2022 | Master Circular - Asset Reconstruction Companies (ARCs) (RBI/2021-22/154 DOR.SIG.FIN.REC 84/26.03.001/2021-22): In order to achieve the highest standards of transparency and fairness in dealing with stakeholders, ARCs have been advised to put in place FPC duly approved by their Board, and that the FPC be placed in public domain for information of all stakeholders. ARCs have been advised to ensure that outsourcing arrangements neither diminish its ability to fulfil its obligations to customers and the Bank, nor impede effective supervision by the Bank. In the matter of recovery of loans, ARCs shall not resort to harassment of the debtor, and ARCs shall ensure that the staff are adequately trained to deal with customers in an appropriate manner, observing strict customer confidentiality. ARCs to ensure that Recovery Agents are properly trained to handle their responsibilities with care and sensitivity, particularly in respect of aspects such as hours of calling, privacy of customer information, etc. They should ensure that Recovery Agents do not induce adoption of uncivilized, unlawful and questionable behaviour or recovery process. ARCs should constitute Grievance Redressal machinery within the organisation. The name and contact number of designated grievance redressal officer of the ARC should be mentioned in the communication with the borrowers. |
| Appendix 6.2: Number of awareness programmes conducted during April 1, 2021 to March 31, 2022 | | ORBIO | No. of Townhall Events | No. of Awareness Programmes | | Ahmedabad | 2 | 9 | | Bengaluru | 1 | 10 | | Bhopal | 1 | 10 | | Bhubaneswar | 0 | 4 | | Chandigarh | 2 | 7 | | Chennai | 0 | 11 | | Dehradun | 0 | 1 | | Guwahati | 2 | 12 | | Hyderabad | 2 | 4 | | Jaipur | 0 | 4 | | Jammu | 2 | 5 | | Kanpur | 0 | 12 | | Kolkata | 0 | 2 | | Mumbai-I | 2 | 9 | | Mumbai - II | 2 | 8 | | New Delhi I | 1 | 19 | | New Delhi II | 2 | 6 | | New Delhi-III | 2 | 21 | | Patna | 2 | 3 | | Raipur | 2 | 6 | | Ranchi | 2 | 6 | | Thiruvananthapuram | 2 | 6 | | Total | 29 | 175 |
| Appendix 7.1 - Position of complaints received by ORBIOs through CPGRAMS | | Name of the RBIO | 2019-20 (Jul – Jun) | 2020-21 (Apr – Mar) | 2021-22 (Apr – Mar) | | Ahmedabad | 68 | 107 | 156 | | Bengaluru | 52 | 106 | 123 | | Bhopal | 31 | 54 | 111 | | Bhubaneswar | 40 | 31 | 33 | | Chandigarh | 31 | 62 | 102 | | Chennai | 438 | 1063 | 629 | | Dehradun | 18 | 27 | 55 | | Guwahati | 10 | 16 | 44 | | Hyderabad | 31 | 49 | 74 | | Jaipur | 58 | 59 | 94 | | Jammu | 2 | 4 | 56 | | Kanpur | 11 | 152 | 141 | | Kolkata | 40 | 737 | 568 | | Mumbai-I | 82 | 145 | 178 | | Mumbai-II | 166 | 122 | 186 | | New Delhi-I | 129 | 146 | 144 | | New Delhi-II | 225 | 74 | 136 | | New Delhi-III | 14 | 50 | 66 | | Patna | 51 | 55 | 102 | | Raipur | 2 | 8 | 82 | | Ranchi | 7 | 15 | 85 | | Thiruvananthapuram | 9 | 24 | 56 | | Total (A) | 1,515 | 3,106 | 3,221 |
| Name of the NBFCO | 2020-21 (Apr-Mar) | 2021-22 (Apr – Mar) | | Mumbai | 1,202 | 579 | | New Delhi | 1,705 | 1,156 | | Total (B) | 2,907 | 1,735 | | Grand Total (A) + (B) | 6,013 | 4,956 |
| Appendix 7.2 - Applications received by ORBIOs under RTI Act, 2005 | | Name of the RBIO | 2019-20 (Jul – Jun) | 2020-21 (Apr – Mar) | 2021-22 (Apr – Mar) | | Ahmedabad | 28 | 25 | 39 | | Bengaluru | 49 | 55 | 76 | | Bhopal | 15 | 27 | 18 | | Bhubaneswar | 18 | 35 | 20 | | Chandigarh | 175 | 150 | 155 | | Chennai | 103 | 76 | 82 | | Dehradun | 40 | 39 | 48 | | Guwahati | 9 | 15 | 13 | | Hyderabad | 80 | 33 | 47 | | Jaipur | 99 | 122 | 80 | | Jammu | 1 | 3 | 11 | | Kanpur | 159 | 186 | 187 | | Kolkata | 46 | 65 | 52 | | Mumbai-I | 106 | 106 | 113 | | Mumbai-II | 83 | 82 | 56 | | New Delhi-I | 148 | 108 | 81 | | New Delhi-II | 117 | 105 | 74 | | New Delhi-III | 33 | 45 | 42 | | Patna | 90 | 79 | 72 | | Raipur | 9 | 7 | 7 | | Ranchi | 22 | 9 | 9 | | Thiruvananthapuram | 6 | 12 | 18 | | Total (A) | 1,436 | 1,384 | 1,300 |
| Name of the NBFCO | 2020-21 (Apr – Mar) | 2021-22 (Apr – Mar) | | Chennai | 25 | 14 | | Kolkata | 3 | 9 | | Mumbai | 22 | 11 | | New Delhi | 55 | 58 | | Total (B) | 105 | 92 |
| Name of the OODT | 2020-21 (Apr – Mar) | 2021-22 (Apr – Mar) | | Bhopal | 1 | 0 | | Bhubaneswar | 0 | 1 | | Chandigarh | 0 | 1 | | Hyderabad | 1 | 1 | | Kanpur | 4 | 0 | | Kolkata | 1 | 0 | | Mumbai – I | 0 | 1 | | Mumbai - II | 1 | 1 | | Jaipur | 1 | 0 | | New Delhi-III | 1 | 0 | | Total (C) | 10 | 5 | | Grand Total (A) + (B) + (C) | 1,499 | 1,397 | | Note: Where a single RIA is marked to more than one ORBIO; that RIA is counted for all the Ombudsman concerned for that particular RIA. |
| Annex 1: Statement of complaints received against banks by the ORBIOs during April 1, 2021 – March 31, 2022 | | Name of the Bank | Total Comp laints | Comp laints per branch | Comp laints related to ATM/DC* per 1,000 ATM/DC* outsta nding | Comp laints related to CC* per 1,000 outsta nding CC* | Digital comp laints per 1,000 digital transa ctions executed through the bank | Non-digital Comp laints per 1,000 acco unts# | ATM / Debit Cards | Mobile / elec tronic banking | Non- obser vance of FPC | Credit Cards | Failure to meet commit ments | Levy of charges without prior notice | Loans and adva nces | Non- adhe rence to BCSBI Codes | Deposit Acco unts related | Pen sion pay ments | Remit tances | DSAs and reco very agents | Para banking | Notes and Coins | Others | Out of pur view of BOS | | Public Sector Banks | | | | | | | | | | | | | | | | | | | | | | | | STATE BANK OF INDIA | 58,644 | 2.37 | 0.042 | 0.108 | 0.00087 | 0.057 | 11,514 | 12,275 | 5,047 | 1,489 | 4,305 | 1,862 | 4,889 | 1,085 | 3,858 | 2,710 | 666 | 77 | 384 | 88 | 7,133 | 1,262 | | BANK OF BARODA | 13,374 | 1.59 | 0.030 | 0.880 | 0.00074 | 0.048 | 2,242 | 1,734 | 1,549 | 972 | 1,037 | 630 | 1,283 | 222 | 1,080 | 256 | 229 | 13 | 82 | 16 | 1,727 | 302 | | BANK OF INDIA | 7,832 | 1.46 | 0.062 | 0.900 | 0.00126 | 0.039 | 2,773 | 966 | 608 | 150 | 461 | 215 | 602 | 69 | 452 | 217 | 127 | 4 | 32 | 5 | 971 | 180 | | BANK OF MAHARASHTRA | 1,953 | 0.93 | 0.051 | 0.051 | 0.00059 | 0.029 | 620 | 320 | 110 | 4 | 100 | 92 | 145 | 11 | 123 | 30 | 28 | 2 | 7 | 3 | 288 | 70 | | CANARA BANK | 10,970 | 1.08 | 0.037 | 0.307 | 0.00063 | 0.069 | 1,707 | 1,111 | 1,256 | 285 | 1,010 | 581 | 1,202 | 453 | 980 | 343 | 168 | 8 | 88 | 11 | 1,487 | 280 | | CENTRAL BANK OF INDIA | 6,838 | 1.46 | 0.075 | NA | 0.00136 | 0.041 | 2,268 | 904 | 585 | 78 | 438 | 140 | 527 | 75 | 417 | 373 | 83 | 8 | 31 | 8 | 776 | 127 | | INDIAN BANK | 8,240 | 1.35 | 0.070 | 0.389 | 0.00113 | 0.045 | 1,880 | 1,168 | 777 | 60 | 635 | 275 | 792 | 106 | 757 | 429 | 135 | 7 | 41 | 10 | 999 | 169 | | INDIAN OVERSEAS BANK | 2,394 | 0.73 | 0.024 | 0.135 | 0.00042 | 0.042 | 482 | 290 | 265 | 10 | 217 | 98 | 351 | 34 | 201 | 46 | 45 | 3 | 21 | 5 | 273 | 53 | | PUNJAB AND SIND BANK | 948 | 0.60 | 0.058 | NA | 0.00239 | 0.049 | 204 | 134 | 60 | 3 | 206 | 31 | 82 | 4 | 61 | 7 | 10 | - | 4 | - | 126 | 16 | | PUNJAB NATIONAL BANK | 20,618 | 1.81 | 0.093 | 0.644 | 0.00142 | 0.063 | 4,281 | 2,909 | 1,785 | 211 | 2,624 | 645 | 1,430 | 165 | 1,600 | 1,192 | 313 | 25 | 125 | 24 | 2,834 | 455 | | UCO BANK | 2,431 | 0.78 | 0.039 | NA | 0.00074 | 0.034 | 443 | 384 | 221 | 21 | 232 | 84 | 236 | 30 | 206 | 76 | 52 | 4 | 16 | 3 | 341 | 82 | | UNION BANK OF INDIA | 12,783 | 1.39 | 0.062 | 0.659 | 0.00083 | 0.050 | 2,985 | 2,031 | 1,182 | 355 | 818 | 434 | 1,070 | 332 | 897 | 391 | 190 | 14 | 54 | 14 | 1,721 | 295 | | All Public Sector Banks | 1,47,025 | 1.63 | 0.049 | 0.212 | 0.00091 | 0.053 | 31,399 | 24,226 | 13,445 | 3,638 | 12,083 | 5,087 | 12,609 | 2,586 | 10,632 | 6,070 | 2,046 | 165 | 885 | 187 | 18,676 | 3,291 | | Private Sector Banks | | | | | | | | | | | | | | | | | | | | | | | | AXIS BANK LIMITED | 16,992 | 3.45 | 0.052 | 0.469 | 0.00060 | 0.161 | 1,450 | 1,694 | 1,424 | 4,235 | 1,460 | 1,730 | 1,499 | 319 | 856 | 7 | 130 | 193 | 101 | 18 | 1,590 | 286 | | BANDHAN BANK LIMITED | 769 | 0.14 | 0.036 | NA | 0.00069 | 0.013 | 179 | 106 | 83 | 5 | 47 | 21 | 134 | 7 | 48 | 1 | 18 | 7 | 7 | 2 | 85 | 19 | | CSB BANK LIMITED | 119 | 0.19 | 0.017 | NA | 0.00033 | 0.040 | 14 | 7 | 24 | 1 | 8 | 10 | 19 | 4 | 7 | - | 1 | - | 5 | 1 | 8 | 10 | | CITY UNION BANK LIMITED | 307 | 0.41 | 0.016 | 4.362 | 0.00026 | 0.031 | 41 | 60 | 34 | 8 | 15 | 19 | 54 | 5 | 18 | - | 5 | 4 | 1 | 1 | 32 | 10 | | DCB BANK LIMITED | 648 | 1.54 | 0.032 | 2.118 | 0.00126 | 0.242 | 27 | 26 | 90 | 8 | 90 | 50 | 188 | 18 | 31 | 1 | 6 | 1 | 5 | 4 | 86 | 17 | | DHANLAXMI BANK LIMITED | 64 | 0.24 | 0.010 | 0.140 | 0.00033 | 0.028 | 5 | 5 | 7 | 1 | 3 | 4 | 16 | 4 | 6 | - | 2 | - | 2 | - | 6 | 3 | | FEDERAL BANK LIMITED | 1,041 | 0.78 | 0.020 | 0.141 | 0.00050 | 0.030 | 222 | 207 | 118 | 19 | 51 | 38 | 119 | 15 | 77 | - | 15 | 7 | 5 | - | 110 | 38 | | HDFC BANK LIMITED | 20,044 | 3.13 | 0.041 | 0.254 | 0.00083 | 0.103 | 1,748 | 2,673 | 1,849 | 4,202 | 1,950 | 1,248 | 2,077 | 355 | 834 | 18 | 191 | 143 | 104 | 29 | 2,234 | 389 | | ICICI BANK LIMITED | 22,043 | 4.11 | 0.049 | 0.309 | 0.00108 | 0.133 | 1,804 | 3,158 | 2,102 | 4,011 | 1,882 | 1,698 | 2,529 | 416 | 1,050 | 21 | 274 | 131 | 93 | 17 | 2,424 | 433 | | IDBI BANK LIMITED | 2,500 | 1.19 | 0.027 | 0.795 | 0.00042 | 0.128 | 350 | 301 | 250 | 33 | 209 | 217 | 392 | 43 | 179 | 5 | 34 | 5 | 16 | 5 | 370 | 91 | | IDFC FIRST BANK LIMITED | 3,787 | 4.23 | 0.042 | 0.294 | 0.00057 | 0.103 | 171 | 289 | 527 | 235 | 406 | 232 | 790 | 87 | 136 | 1 | 42 | 162 | 28 | - | 564 | 117 | | INDUSIND BANK LIMITED | 5,423 | 2.59 | 0.055 | 0.840 | 0.00204 | 0.076 | 381 | 515 | 488 | 1,579 | 524 | 298 | 467 | 90 | 221 | - | 59 | 85 | 20 | 3 | 575 | 118 | | JAMMU & KASHMIR BANK LIMITED | 657 | 0.66 | 0.048 | 0.280 | 0.00070 | 0.017 | 167 | 143 | 52 | 23 | 28 | 31 | 59 | 1 | 28 | 2 | 9 | 1 | 6 | 1 | 96 | 10 | | KARNATAKA BANK LIMITED | 592 | 0.65 | 0.019 | NA | 0.00038 | 0.028 | 97 | 106 | 55 | 1 | 37 | 45 | 76 | 52 | 36 | - | 8 | 3 | 1 | - | 63 | 12 | | KARUR VYSYA BANK LIMITED | 536 | 0.61 | 0.016 | 0.448 | 0.00021 | 0.036 | 66 | 79 | 83 | 3 | 41 | 27 | 103 | 16 | 48 | 1 | 4 | 1 | 2 | 2 | 45 | 15 | | KOTAK MAHINDRA BANK LIMITED | 7,741 | 4.22 | 0.029 | 0.463 | 0.00078 | 0.200 | 673 | 1,048 | 706 | 1,479 | 615 | 503 | 765 | 170 | 326 | 5 | 80 | 227 | 45 | 5 | 924 | 170 | | NAINITAL BANK LIMITED | 61 | 0.36 | NA | NA | 0.00300 | 0.039 | 11 | 12 | 9 | - | 5 | 3 | 8 | - | 6 | - | 2 | - | - | - | 5 | - | | RBL BANK LIMITED | 7,302 | 14.07 | 0.099 | 1.283 | 0.01080 | 0.161 | 130 | 294 | 433 | 4,726 | 323 | 297 | 234 | 94 | 114 | - | 9 | 228 | 22 | - | 337 | 61 | | SOUTH INDIAN BANK LIMITED | 500 | 0.52 | 0.024 | 0.051 | 0.00035 | 0.034 | 85 | 77 | 67 | 3 | 17 | 31 | 89 | 19 | 32 | - | 10 | 3 | - | - | 50 | 17 | | TAMILNAD MERCANTILE BANK LIMITED | 330 | 0.62 | 0.022 | 0.122 | 0.00052 | 0.032 | 45 | 51 | 69 | 4 | 11 | 28 | 43 | 6 | 30 | - | 4 | 1 | - | 5 | 23 | 10 | | YES BANK LIMITED | 2,819 | 2.49 | 0.046 | 0.419 | 0.00051 | 0.214 | 165 | 329 | 292 | 496 | 310 | 197 | 364 | 52 | 132 | - | 30 | 51 | 17 | 1 | 327 | 56 | | All Private Sector Banks | 94,275 | 2.43 | 0.039 | 0.424 | 0.00087 | 0.103 | 7,831 | 11,180 | 8,762 | 21,072 | 8,032 | 6,727 | 10,025 | 1,773 | 4,215 | 62 | 933 | 1,253 | 480 | 94 | 9,954 | 1,882 | | Payment Banks | | | | | | | | | | | | | | | | | | | | | | | | AIRTEL PAYMENTS BANK LIMITED | 3,062 | 109.36 | 0.042 | NA | 0.00081 | NA | 83 | 1,167 | 131 | 19 | 358 | 92 | 5 | 39 | 346 | 1 | 22 | 4 | 15 | - | 691 | 89 | | FINO PAYMENTS BANK LIMITED | 205 | 4.77 | 0.011 | NA | 0.00017 | NA | 49 | 34 | 15 | 1 | 19 | 3 | 3 | 4 | 15 | - | 7 | 2 | 1 | 1 | 40 | 11 | | INDIA POST PAYMENTS BANK LIMITED | 287 | 0.44 | 0.010 | NA | 0.00026 | NA | 50 | 84 | 15 | 3 | 27 | 7 | 2 | 6 | 32 | - | 10 | 1 | - | 1 | 43 | 6 | | JIO PAYMENTS BANK LIMITED | 14 | 1.27 | NA | NA | 0.00205 | NA | 1 | 9 | 1 | - | 1 | - | - | - | 1 | - | - | - | - | - | - | 1 | | NSDL PAYMENTS BANK LIMITED | 89 | 89.00 | 0.006 | NA | 0.00023 | NA | 2 | 10 | 8 | - | 13 | 7 | 2 | 2 | 17 | - | 2 | - | - | - | 21 | 5 | | PAYTM PAYMENTS BANK LIMITED | 2,480 | 413.33 | 0.005 | NA | 0.00022 | NA | 201 | 1,129 | 108 | 52 | 150 | 24 | 32 | 26 | 167 | - | 41 | 7 | 11 | - | 464 | 68 | | All Payment Banks | 6,137 | 8.30 | 0.008 | NA | 0.00033 | NA | 386 | 2,433 | 278 | 75 | 568 | 133 | 44 | 77 | 578 | 1 | 82 | 14 | 27 | 2 | 1,259 | 180 | | | | | | | | | | | | | | | | | | | | | | | | | | Small Finance Banks | | | | | | | | | | | | | | | | | | | | | | | | AU SMALL FINANCE BANK LIMITED | 729 | 1.03 | 0.021 | 0.124 | 0.00055 | 0.218 | 41 | 60 | 88 | 21 | 99 | 45 | 160 | 4 | 39 | - | 7 | 8 | 4 | - | 137 | 16 | | CAPITAL SMALL FINANCE BANK LIMITED | 41 | 0.25 | 0.011 | 0.000 | 0.00060 | 0.050 | 2 | 4 | - | - | 15 | 1 | 10 | 1 | 1 | - | 1 | 1 | - | - | 4 | 1 | | EQUITAS SMALL FINANCE BANK LIMITED | 340 | 0.39 | 0.007 | 0.000 | 0.00039 | 0.048 | 24 | 35 | 49 | - | 27 | 19 | 85 | 12 | 28 | - | 4 | - | 3 | 1 | 46 | 7 | | ESAF SMALL FINANCE BANK LIMITED | 68 | 0.12 | 0.003 | 0.000 | 0.00030 | 0.005 | 13 | 8 | 10 | - | 6 | 4 | 9 | 1 | 3 | - | 2 | - | - | - | 8 | 4 | | FINCARE SMALL FINANCE BANK LIMITED | 162 | 0.24 | 0.006 | 0.000 | 0.00109 | 0.018 | 21 | 20 | 17 | - | 12 | 10 | 22 | 7 | 26 | - | 2 | - | - | - | 23 | 2 | | JANA SMALL FINANCE BANK LIMITED | 213 | 0.38 | 0.012 | NA | 0.00169 | 0.029 | 29 | 5 | 36 | 2 | 26 | 12 | 42 | 7 | 16 | - | 2 | 3 | - | - | 26 | 7 | | NORTH EAST SMALL FINANCE BANK LIMITED | 5 | 0.02 | 0.007 | 0.000 | 0.00063 | 0.002 | 2 | - | 1 | - | - | - | 1 | - | 1 | - | - | - | - | - | - | - | | SURYODAY SMALL FINANCE BANK LIMITED | 33 | 0.06 | 0.002 | 0.000 | 0.00007 | 0.010 | 1 | - | 10 | - | 1 | 2 | 4 | - | 6 | - | - | 1 | - | - | 6 | 2 | | UJJIVAN SMALL FINANCE BANK LIMITED | 274 | 0.47 | 0.004 | NA | 0.00030 | 0.018 | 31 | 43 | 24 | 2 | 27 | 19 | 49 | 6 | 23 | 1 | 1 | 3 | 1 | - | 34 | 10 | | UTKARSH SMALL FINANCE BANK LIMITED | 74 | 0.11 | 0.005 | 0.000 | 0.00187 | 0.013 | 7 | 14 | 8 | - | 11 | 3 | 6 | 1 | 12 | - | 3 | 1 | - | - | 6 | 2 | | All Small Finance Banks | 1,939 | 0.35 | 0.007 | 0.148 | 0.00048 | 0.031 | 171 | 189 | 243 | 25 | 224 | 115 | 388 | 39 | 155 | 1 | 22 | 17 | 8 | 1 | 290 | 51 | | Foreign Banks | | | | | | | | | | | | | | | | | | | | | | | | AB BANK LIMITED | 3 | 3.00 | NA | NA | NA | 2.532 | 1 | - | - | 1 | - | - | - | - | - | - | - | 1 | - | - | - | - | | ABU DHABI COMMERCIAL BANK PJSC | 1 | 1.00 | NA | NA | NA | NA | - | - | - | - | - | - | 1 | - | - | - | - | - | - | - | - | - | | AMERICAN EXPRESS BANKING CORP. | 309 | 154.50 | NA | 0.168 | 0.00475 | 0.035 | 1 | 4 | 14 | 232 | 14 | 26 | 2 | 5 | 1 | - | - | 1 | - | - | 7 | 2 | | BARCLAYS BANK PLC | 19 | 4.75 | 0.000 | NA | 0.00672 | 0.568 | - | 1 | - | 6 | 2 | 1 | 1 | - | 2 | - | 2 | - | - | - | 3 | 1 | | BANK OF AMERICA NATIONAL ASSOCIATION | 8 | 2.00 | NA | 0.000 | 0.00017 | 0.374 | - | 2 | 2 | - | - | - | - | - | - | - | 4 | - | - | - | - | - | | BANK OF BAHRAIN & KUWAIT B.S.C. | 1 | 0.25 | NA | NA | 0.00000 | 0.052 | - | - | 1 | - | - | - | - | - | - | - | - | - | - | - | - | - | | BNP PARIBAS | 2 | 0.29 | NA | NA | 0.00000 | 0.610 | - | - | 1 | - | - | - | 1 | - | - | - | - | - | - | - | - | - | | CITIBANK N.A | 1,361 | 33.20 | 0.047 | 0.278 | 0.00145 | 0.084 | 68 | 136 | 98 | 709 | 58 | 41 | 34 | 22 | 33 | - | 16 | 9 | 6 | - | 112 | 19 | | DBS BANK INDIA LIMITED | 433 | 0.71 | 0.025 | 3.000 | 0.00049 | 0.067 | 53 | 105 | 48 | 3 | 28 | 20 | 27 | 12 | 54 | 2 | 11 | - | 1 | - | 59 | 10 | | DEUTSCHE BANK AG | 124 | 6.20 | 0.033 | NA | 0.00012 | 0.388 | 4 | 3 | 15 | - | 13 | 5 | 38 | 5 | 7 | - | 10 | - | - | - | 21 | 3 | | DOHA BANK QSC | 1 | 0.33 | NA | NA | 0.00000 | 0.047 | - | - | 1 | - | - | - | - | - | - | - | - | - | - | - | - | - | | EMIRATES NBD BANK (P.J.S.C.) | 1 | 1.00 | NA | NA | 0.00000 | 0.438 | - | - | - | - | - | - | - | - | 1 | - | - | - | - | - | - | - | | FIRSTRAND BANK LTD | 1 | 1.00 | NA | NA | 1.10742 | 0.000 | - | 1 | - | - | - | - | - | - | - | - | - | - | - | - | - | - | | HONGKONG AND SHANGHAI BANKING CORPN.LTD. | 379 | 13.07 | 0.023 | 0.258 | 0.00119 | 0.093 | 12 | 27 | 32 | 205 | 12 | 11 | 26 | 9 | 14 | - | 6 | 2 | - | - | 20 | 3 | | INDUSTRIAL AND COMMERCIAL BANK OF CHINA | 1 | 1.00 | NA | NA | 0.00000 | 0.543 | - | - | - | - | 1 | - | - | - | - | - | - | - | - | - | - | - | | JPMORGAN CHASE BANK NATIONAL ASSOCIATION | 1 | 0.25 | NA | NA | 0.00000 | 0.027 | - | - | - | - | - | - | - | - | - | - | 1 | - | - | - | - | - | | MIZUHO BANK LTD | 2 | 0.40 | NA | NA | 0.00000 | 0.766 | - | - | - | - | - | - | - | - | - | - | - | - | - | - | 2 | - | | MUFG BANK LTD. | 1 | 0.20 | NA | NA | 0.00000 | 0.241 | - | - | 1 | - | - | - | - | - | - | - | - | - | - | - | - | - | | NATWEST MARKETS PLC (ERSTWHILE THE ROYAL BANK OF SCOTLAND PLC) | 11 | 5.50 | NA | NA | NA | NA | - | - | 2 | 4 | 3 | - | - | 1 | - | - | - | - | - | - | - | 1 | | SBM BANK (MAURITIUS)LTD. | 115 | 10.45 | 0.115 | 0.107 | 0.00828 | 0.031 | 6 | 11 | 2 | 60 | 7 | 1 | 6 | 2 | 10 | - | 2 | 1 | - | - | 7 | - | | SHINHAN BANK | 3 | 0.50 | NA | NA | 0.00000 | 0.098 | - | - | - | - | 1 | - | 1 | - | - | - | - | - | - | - | - | 1 | | SONALI BANK | 1 | 0.50 | NA | NA | 0.00000 | 0.310 | - | - | - | - | - | - | - | - | - | 1 | - | - | - | - | - | - | | STANDARD CHARTERED BANK | 1,680 | 16.15 | 0.083 | 0.468 | 0.00285 | 0.314 | 92 | 168 | 138 | 628 | 100 | 98 | 177 | 29 | 41 | 3 | 24 | 16 | 2 | 1 | 131 | 32 | | UNITED OVERSEAS BANK LTD | 1 | 0.50 | NA | NA | 0.00000 | 41.667 | - | - | - | - | - | - | 1 | - | - | - | - | - | - | - | - | - | | WOORI BANK | 5 | 1.67 | NA | NA | 0.00000 | 0.675 | - | - | - | - | 2 | - | 3 | - | - | - | - | - | - | - | - | - | | All Foreign Banks | 4,464 | 5.10 | 0.044 | 0.278 | 0.00157 | 0.112 | 237 | 458 | 355 | 1,848 | 241 | 203 | 318 | 85 | 163 | 6 | 76 | 30 | 9 | 1 | 362 | 72 | | | | | | | | | | | | | | | | | | | | | | | | | | All Regional Rural Banks | 4,236 | | | | | | 1,021 | 401 | 588 | 66 | 287 | 86 | 577 | 115 | 322 | 30 | 43 | 6 | 24 | 4 | 553 | 113 | | All Co-operative Banks | 2,272 | | | | | | 222 | 221 | 335 | 36 | 86 | 49 | 517 | 36 | 304 | 7 | 31 | 15 | 27 | 6 | 301 | 79 | | SBI CARDS | 7,700 | | | | | | 107 | 274 | 440 | 5,399 | 510 | 365 | 22 | 105 | 16 | 1 | 2 | 104 | 8 | 1 | 288 | 58 | | | | | | | | | | | | | | | | | | | | | | | | | | OTHERS | 37 | | | | | | 1 | 6 | - | 3 | - | - | 7 | - | 3 | 1 | - | - | 12 | - | 4 | - | | | | | | | | | | | | | | | | | | | | | | | | | | TOTAL COMPLAINTS AGAINST BANKS | 2,68,085 | | | | | | 41,375 | 39,388 | 24,446 | 32,162 | 22,031 | 12,765 | 24,507 | 4,816 | 16,388 | 6,179 | 3,235 | 1,604 | 1,480 | 296 | 31,687 | 5,726 | | DC – Debit Card; CC- Credit Card; #Sum of deposit and credit accounts |
| Annex 2: Statement of complaints received against NBFCs by the ORBIOs during April 1, 2021 – March 31, 2022 | | NAME OF THE NBFC | NON-
ADHE RENCE TO FAIR PRAC TICES CODE / LOANS & ADVA NCES RELATED | NOT COVERED UNDER THE CLAUSE 8 OF THE SCHEME | NON-OBSER VANCE RBI DIREC TIONS TO NBFC | LEVY ING OF CHAR GES WITH OUT NOTICE | DELAY IN REPAY MENT OF DEPOSITS | NO TRANS PARENCY IN CONT RACT/LOAN | DELAY IN RELEASE OF SECU RITIES / DOCU MENTS | NO COMMU NICATION ABOUT LOAN SANC TIONED | NON-UNDERS TANDABLE OR NO ADEQ UATE NOTICE ON TERMS AND CONDI TIONS | NON-UNDERS TANDABLE OR SANCTION LETTER/ TERMS | DELAY IN PAYMENT OF INTE REST | OTHERS | TOTAL | | ADITYA BIRLA CAPITAL LIMITED | 133 | 2 | 8 | 8 | 0 | 2 | 0 | 0 | 0 | 0 | 0 | 8 | 161 | | ADITYA BIRLA FINANCE LIMITED | 550 | 74 | 63 | 59 | 10 | 11 | 19 | 11 | 2 | 1 | 3 | 46 | 849 | | AKARA CAPITAL ADVISORS PRIVATE LIMITED | 98 | 1 | 21 | 6 | 1 | 1 | 0 | 0 | 1 | 0 | 0 | 3 | 132 | | BAJAJ FINANCE LIMITED | 3266 | 403 | 294 | 343 | 37 | 92 | 15 | 56 | 21 | 10 | 16 | 237 | 4790 | | BAJAJ FINSERV LIMITED | 170 | 2 | 6 | 10 | 0 | 1 | 0 | 2 | 0 | 0 | 0 | 34 | 225 | | BAJAJ HOLDINGS AND INVESTMENT LIMITED | 144 | 6 | 14 | 45 | 1 | 10 | 0 | 3 | 2 | 2 | 2 | 9 | 238 | | BHANIX FINANCE & INVESTMENT LTD | 165 | 38 | 7 | 2 | 0 | 1 | 0 | 2 | 0 | 0 | 0 | 8 | 223 | | BOB FINANCIAL SOLUTIONS LIMITED (PREVIOUSLY KNOWN AS BOBCARDS LIMITED) | 80 | 3 | 5 | 25 | 2 | 4 | 0 | 4 | 0 | 0 | 1 | 152 | 276 | | CAPFLOAT FINANCIAL SERVICES PRIVATE LIMITED. | 91 | 6 | 15 | 13 | 2 | 5 | 0 | 2 | 0 | 1 | 1 | 11 | 147 | | CHOLAMANDALAM INVESTMENT AND FINANCE COMPANY LIMITED | 502 | 72 | 83 | 33 | 8 | 7 | 9 | 7 | 3 | 0 | 3 | 31 | 758 | | CLIX CAPITAL SERVICES PRIVATE LIMITED | 179 | 14 | 28 | 5 | 0 | 3 | 0 | 0 | 0 | 3 | 0 | 7 | 239 | | DMI FINANCE PVT LTD. | 462 | 2 | 61 | 50 | 29 | 20 | 2 | 13 | 4 | 1 | 8 | 59 | 711 | | FULLERTON INDIA CREDIT COMPANY LIMITED | 477 | 67 | 80 | 59 | 6 | 16 | 7 | 8 | 2 | 1 | 11 | 32 | 766 | | HDB FINANCIAL SERVICES LIMITED | 577 | 85 | 61 | 80 | 11 | 17 | 16 | 9 | 4 | 5 | 6 | 35 | 906 | | HERO FINCORP LIMITED (EARLIER NAME-HERO HONDA FINLEASE LIMITEDVIDE GM'S ORDER DTD.02/09/11) | 365 | 20 | 52 | 29 | 4 | 11 | 3 | 10 | 1 | 2 | 4 | 34 | 535 | | HINDUJA LEYLAND FINANCE LIMITED | 219 | 13 | 18 | 19 | 5 | 8 | 16 | 2 | 0 | 0 | 4 | 33 | 337 | | HOME CREDIT INDIA FINANCE PRIVATE LIMITED (FORMERLY KNOWN AS RAJSHREE AUTO FINANCE LIMITED) | 549 | 42 | 81 | 50 | 10 | 19 | 0 | 12 | 3 | 4 | 12 | 34 | 816 | | IIFL FINANCE LIMITED (FORMERLY KNOWN AS IIFL HOLDINGS LIMITED) | 95 | 0 | 0 | 0 | 0 | 0 | 0 | 0 | 0 | 0 | 0 | 9 | 104 | | INDIA INFOLINE FINANCE LIMITED (OLD NAME- INDIA INFOLINE INVESTMENT SERVICES LTD.) | 307 | 30 | 42 | 21 | 3 | 15 | 9 | 8 | 3 | 0 | 2 | 26 | 466 | | INDIABULLS COMMERCIAL CREDIT LTD.(EARLIER NAME INDIABULLS INFRASTRUCTURE CREDIT LIMITED ) | 72 | 3 | 22 | 32 | 3 | 12 | 3 | 4 | 2 | 1 | 4 | 28 | 186 | | INDIABULLS CONSUMER FINANCE LIMITED (EARLIER NAME-IVL FINANCE LIMITED) | 1891 | 19 | 179 | 316 | 52 | 71 | 21 | 29 | 13 | 3 | 15 | 420 | 3029 | | INDOSTAR CAPITAL FINANCE LTD | 75 | 16 | 6 | 6 | 0 | 1 | 0 | 0 | 0 | 0 | 0 | 4 | 108 | | KOTAK MAHINDRA PRIME LTD. | 169 | 14 | 19 | 24 | 1 | 8 | 3 | 2 | 0 | 0 | 0 | 19 | 259 | | L&T FINANCE LIMITED | 232 | 26 | 22 | 24 | 2 | 5 | 7 | 2 | 2 | 1 | 2 | 21 | 346 | | LENDINGKART FINANCE LIMITED (FORMERLY KNOWN AS AADRI INFIN LIMITED) | 111 | 12 | 8 | 12 | 4 | 4 | 0 | 1 | 1 | 1 | 0 | 2 | 156 | | MAGMA FINCORP LTD | 100 | 15 | 23 | 10 | 1 | 5 | 3 | 1 | 0 | 1 | 1 | 5 | 165 | | MAHINDRA & MAHINDRA FINANCIAL SERVICES LTD | 299 | 23 | 32 | 19 | 4 | 10 | 4 | 4 | 3 | 0 | 5 | 30 | 433 | | MANAPPURAM FINANCE LIMITED | 92 | 14 | 11 | 12 | 1 | 9 | 4 | 3 | 4 | 0 | 3 | 8 | 161 | | MUTHOOT FINANCE LIMITED | 197 | 30 | 23 | 19 | 1 | 10 | 7 | 3 | 0 | 0 | 4 | 36 | 330 | | SBFC FINANCE PRIVATE LIMITED (ERSTWHILE SMALL BUSINESS FINCREDIT INDIA PRIVATE LIMITED) | 96 | 13 | 13 | 6 | 4 | 2 | 2 | 2 | 0 | 0 | 0 | 0 | 138 | | SBI CARDS & PAYMENT SERVICES PVT. LTD. | 41 | 1 | 2 | 12 | 0 | 0 | 1 | 0 | 1 | 0 | 2 | 2360 | 2420 | | SHRIRAM CITY UNION FINANCE LIMITED | 298 | 28 | 31 | 33 | 9 | 11 | 15 | 3 | 2 | 2 | 2 | 28 | 462 | | SHRIRAM TRANSPORT FINANCE COMPANY LIMITED | 163 | 16 | 12 | 6 | 4 | 8 | 9 | 1 | 0 | 0 | 7 | 11 | 237 | | SI CREVA CAPITAL SERVICES PRIVATE LIMITED | 94 | 13 | 4 | 4 | 0 | 1 | 0 | 1 | 0 | 0 | 0 | 2 | 119 | | SIDVIK LEASING PRIVATE LIMITED | 130 | 5 | 2 | 2 | 1 | 0 | 0 | 2 | 0 | 0 | 0 | 0 | 142 | | TATA CAPITAL FINANCIAL SERVICES LIMITED | 465 | 58 | 80 | 41 | 7 | 16 | 10 | 9 | 1 | 2 | 1 | 51 | 741 | | TVS CREDIT SERVICES LTD | 134 | 11 | 12 | 23 | 1 | 3 | 3 | 1 | 0 | 0 | 5 | 13 | 206 | | | | | | | | | | | | | | | | | OTHERS | 5641 | 429 | 441 | 293 | 95 | 93 | 96 | 47 | 16 | 5 | 61 | 3780 | 10997 | | | | | | | | | | | | | | | | | TOTAL COMPLAINTS AGAINST NBFCs | 18729 | 1626 | 1881 | 1751 | 319 | 512 | 284 | 264 | 91 | 46 | 185 | 7626 | 33314 | | Note: Entity-wise complaints have been given only for those NBFCs wherein more than 100 complaints have been received under the Ombudsman Schemes during 2021-22 |
| Annex 3: Statement of complaints received against PSOs/PSPs by the ORBIOs during April 1, 2021 – March 31, 2022 | | Name of the Non- bank Payment System Participants | Mobile/Electronic Fund Transfers / Mobile Electronic Banking | Fund Transfers/UPI/ BBPS/Bharat QR Code | Non- reversal of Funds due to Wrong Beneficiary Transfer by System Participant. | Prepaid Payment Instruments (PPI) | Violation of RBI Directives in relation to Fees/Charges | Out of Subject | OTHERS | TOTAL | | Amazon Pay (India) Private Limited | 147 | 128 | 24 | 42 | 4 | 2 | 62 | 409 | | Appnit Technologies Private Limited | 2 | 2 | 0 | 5 | 0 | 0 | 2 | 11 | | Balancehero India Private Limited | 2 | 2 | 0 | 4 | 0 | 0 | 18 | 26 | | CSC e – Governance Services India Ltd | 27 | 11 | 3 | 1 | 0 | 0 | 9 | 51 | | Delhi Metro Rail Corporation Limited | 1 | 0 | 0 | 1 | 0 | 0 | 0 | 2 | | Euronet Services India Private Limited | 2 | 0 | 0 | 0 | 0 | 0 | 0 | 2 | | GI Technology Private Limited | 6 | 4 | 1 | 0 | 0 | 1 | 0 | 12 | | Hitachi Payment Services Private Limited | 1 | 0 | 0 | 0 | 0 | 0 | 2 | 3 | | India Transact Services Limited. | 1 | 1 | 2 | 1 | 1 | 0 | 0 | 6 | | IndiaIdeas.com Limited | 4 | 2 | 0 | 0 | 0 | 0 | 4 | 10 | | Itz Cash Card Limited | 2 | 1 | 1 | 1 | 0 | 0 | 0 | 5 | | National Payments Corporation of India | 54 | 0 | 0 | 0 | 0 | 0 | 1 | 55 | | One Mobikwik Systems Private Limited | 257 | 49 | 11 | 38 | 33 | 3 | 162 | 553 | | Pay Point India Network Private Limited | 1 | 0 | 0 | 1 | 1 | 0 | 0 | 3 | | PayU Payments Private Limited | 92 | 83 | 16 | 17 | 3 | 1 | 37 | 249 | | Phonepe Private Limited (formerly named as FX Mart Pvt. Ltd) | 512 | 622 | 110 | 51 | 7 | 2 | 102 | 1406 | | Pine Labs Private Limited | 14 | 13 | 5 | 10 | 3 | 1 | 12 | 58 | | QwikCilver Solutions Pvt. Ltd | 9 | 0 | 0 | 3 | 0 | 0 | 0 | 12 | | RapiPay Fintech Private Limited | 7 | 1 | 3 | 0 | 1 | 0 | 1 | 13 | | Smart Payment Solutions Pvt. Ltd. | 1 | 0 | 0 | 0 | 0 | 0 | 0 | 1 | | Sodexo SVC India Pvt. Ltd | 4 | 0 | 0 | 4 | 1 | 0 | 4 | 13 | | Spice Money Limited | 13 | 4 | 1 | 8 | 2 | 0 | 5 | 33 | | Transaction Analysts (India) Private Ltd | 0 | 2 | 0 | 1 | 0 | 0 | 0 | 3 | | Transcorp International Limited | 0 | 0 | 0 | 1 | 0 | 0 | 0 | 1 | | TranServ Private Limited | 15 | 5 | 1 | 14 | 2 | 1 | 17 | 55 | | UNIMONI FINANCIAL SERVICES LIMITED | 2 | 0 | 0 | 0 | 0 | 0 | 1 | 3 | | Vakrangee Limited | 0 | 0 | 0 | 0 | 0 | 0 | 3 | 3 | | ZipCash Card Services Pvt. Ltd | 15 | 0 | 0 | 10 | 2 | 0 | 15 | 42 | | OTHERS | 18 | 21 | 8 | 5 | 1 | 0 | 4 | 57 | | TOTAL COMPLAINTS AGAINST NBPSPs | 1209 | 951 | 186 | 218 | 61 | 11 | 461 | 3097 |
|