Press Release RBI Working Paper Series No. 13 Price Discrimination in Over-the-Counter Currency Derivatives ΨAbhishek Kumar and Vidya Kamate Abstract *This paper provides empirical evidence on the presence of considerable price discrimination in the Indian over-the-counter (OTC) currency derivatives market through an analysis of transaction level data. The average markup paid on USD/INR forward contracts declines with an increase in the level of sophistication of clients, measured in terms of their access to number of dealer counterparties. Clients transacting with a single dealer counterparty paid an average markup of 18 paise, which falls to 9 paise for clients transacting with two dealers, and close to zero for clients transacting with ten or more dealers. While retail clients (individuals, proprietorships and small firms) and unlisted firms paid an average markup of 19 paise and 11 paise, respectively, listed firms and foreign investors paid a much lower markup of 3 to 4 paise. Since a large majority of all clients (83 per cent) transacted with a single dealer, the findings of the study make a case for improving market access to enhance competition which may result in better pricing for clients. JEL Classification: G13, G14, G15 Keywords: Currency derivatives, foreign exchange, OTC markets, price discrimination, bargaining power Introduction Cross-border trade in goods, services and assets (or capital) necessitates exchange of one currency into another which is the primary reason for existence of currency markets1. Based on the asset class traded, currency markets can be classified into spot and derivative segments. Participants trade in spot (including cash and tom) market to meet their immediate requirement of an asset (currency), while the derivative contracts are used to hedge against possible adverse fluctuations in exchange rates (currency risk). Currency contracts can be traded at exchanges or over-the-counter (OTC). Exchanges offer superior risk management and anonymity; OTC segment provides choice of counterparty and customization of contract. The currency market is largely OTC2 with an average daily turnover of USD 6.6 trillion3 globally. Indian onshore currency markets have grown in size and importance as India has increasingly integrated with the global economy4, with current average daily turnover in OTC and exchange traded currency derivative (ETCD) segments at about USD 40 billion and 8 billion, respectively5. For regulatory purposes, currency markets are also categorized as interbank and client (or customer) segments. Banks, which have been granted Authorized Dealer Category I (“dealer”) license by the Reserve Bank of India (RBI), are market makers for currency markets and hence require a liquid interbank (or inter-dealer) market for providing quotes to clients and; covering their positions for risk management and compliance with regulatory requirements. The client segment witnesses participation from a diverse investor set; from sophisticated foreign portfolio investors (FPIs) and large corporates to individuals and small and medium enterprises (SMEs). Studies have revealed that OTC markets with diverse investor base are prone to discriminatory pricing based on sophistication or activity of investors. Duffie et al. (2005) show that smaller investors, typically those with fewer search options, receive less favourable prices in OTC markets. In the US OTC corporate bond markets, trading costs are lower for active institutions relative to inactive ones (Schultz, 2001 and O’Hara et al., 2018). There is, however, a dearth of similar literature for the OTC derivatives market, which could possibly be on account of lack of available data. Limited transparency in activities in OTC derivative markets has often been cited among the primary reasons for the 2008 financial crisis (Stulz, 2010, and Stanton and Wallace, 2011). The G20 and Financial Stability Board (FSB) have expressed commitments to reform the OTC derivatives market and one of their stated aims is to improve transparency in these markets. Since 2009, they have urged regulators to mandate reporting of OTC derivative contracts to Trade Repositories (TR)6. Following which many jurisdictions including Europe, United States and India have framed regulations to implement the same. In a first, Hau et al. (2019) analyzed European Union (EU) TR data to establish price discrimination against non-financial clients in the foreign exchange (forex or FX) derivatives market and found that dealers charge higher spreads from less sophisticated clients. This study follows a similar empirical approach and analyses a set of 2,55,352 USD/INR currency forward contracts - between 8,173 clients and 70 dealers, during a one-year period (September 1, 2018 to August 31, 2019). Regression results show that, in alignment with the findings of Hau et al. (2019), markup (also spread or transaction cost or rent or margin) in the Indian currency forward markets varies systematically with client sophistication – measured empirically using the number of dealer counterparties of a client. Clients transacting with a single dealer counterparty (unsophisticated clients) paid, on an average, a markup of around 18 paise while the same for clients transacting with two dealer counterparties was about 9 paise. Average markup incurred by highly sophisticated clients, with access to ten or more dealers, was close to zero. This alludes to the role of bargaining power in pricing, possibly, on account of dealer access. Results were further refined by categorizing the clients into retail (individuals, proprietorship firms and small firms), foreign investors, unlisted and listed firms; and analysing the pricing for each category. The analysis shows that retail clients and unlisted firms incurred an average transaction cost of 19 and 11 paise, respectively; while, the same for listed firms and foreign investors was 3 to 4 paise. A large majority (83 per cent) of all clients, almost all (96 per cent) retail clients and 78 per cent of unlisted firms, transacted with a single dealer during the observation period indicating difficulties related to dealer access; or increasing the search options. While more than half of listed companies had access to two or more dealer counterparties. Regression results indicate that, across client categories, increased search option is associated with better pricing with higher benefit accruing to retail clients and unlisted firms. Results of econometric modelling indicate that for 83 per cent of clients that deal with a single dealer counterparty, if they have access to one more dealer then that can lead to a saving in the markup cost of about ₹ 227 crore (on total transactions with gross notional of USD 80 billion undertaken during the observation period). The study has important policy implications. The unfair pricing prevalent in the Indian currency markets adversely affects the interest of clients and there is a case for improving market access. Electronic trading platforms, by enabling clients to access quotes from several dealer counterparties simultaneously, are likely to reduce search costs, improve transparency and enhance dealer competition for better pricing for clients. The rest of the paper is structured as follows: A brief summary of related literature is provided in section 2. Section 3 describes the transaction process in the currency forward market. Section 4 provides details of the hypothesis, data and variable construction used in the study. Section 5 presents the empirical methodology and results of the paper followed by robustness checks in section 6. Section 7 concludes the study. 2. Related Literature This study is closely related to the strand of theoretical and empirical literature that seeks to understand the impact on asset prices of search, liquidity, bargaining and informational frictions in decentralized over the counter markets. The role of search costs is theoretically analysed in Duffie et al. (2005) who find that bid-ask spreads are set in consideration of investors’ outside options which are reflective of accessibility to other market makers and investors’ ability to find counterparties. This results in spreads being tighter for more sophisticated investors who have better access to other investors or transact with market makers with limited bargaining power. Duffie et al. (2007) analyse the implication of search frictions for risky asset pricing. Golosov et al. (2014), Bolton et al. (2016), Babus and Hu (2017) and Babus and Kondor (2018) provide theoretical evidence on the role of information acquisition and diffusion in determination of asset prices in OTC markets. Existing empirical studies on price dispersion in over the counter markets have mainly focused on bond markets mainly because of availability of reliable granular data for corporate and, more recently, municipal bond markets. Schultz (2001) finds that corporate bond trading costs are a decreasing function of trade, investor and dealer size. Harris & Piwowar (2006) and Green, Hollifield & Schuroff (2007) find similar size effects in municipal bond trading market. More recent studies (Hendershott et al., 2020; O’Hara, Wang & Zhuo, 2018) have found evidence of price discrimination by analysing trading activity of insurance companies in corporate bond markets where larger and more active insurance companies pay lower spreads. Friewald & Nagler (2019) provide evidence that systematic OTC frictions like market-wide inventory, search, and bargaining frictions account for one-third of the total explained variation in the US corporate bond yields. The current study predominantly relates to this set of empirical studies that highlights the role of search and bargaining frictions on asset prices in OTC markets. There is also significant literature on the effect of information disclosure and market transparency on trading costs in OTC markets. Among the empirical studies in this area are Bessembinder, Maxwell & Venkataraman (2006), Goldstein, Hotchkiss & Sirri (2007) and Edwards, Harris & Piwowar (2007) which find that the Introduction of Trade Reporting and Compliance Engine (TRACE) in 2002 for US corporate bond markets, that facilitated mandatory reporting of OTC secondary market transactions, improved bond market liquidity and reduced trading costs. Similar effects of transparency on bond market trading costs for US municipal bonds were found by Schultz (2012). Credit Default Swap (CDS) markets also experience lower transaction costs and improved liquidity following enhanced public dissemination of trading information (Loon & Zhong, 2016 and Bhat, Callen & Segal, 2016). The current study contributes to the scant but growing literature on price dispersion in currency derivatives market. Using unique European data on interest rate swaps market, Cenedese et al. (2019) find substantial and persistent heterogeneity in derivative prices. They find that OTC premia are lower for contracts cleared via central counterparty, for clients posting initial margins and for clients which have high creditworthiness. Premia are absent for dealers suggesting that they have significant bargaining power in these markets. As mentioned earlier in the text, the current study closely relates to Hau et al. (2019) that provides evidence of significant price discrimination against unsophisticated investors in European currency derivatives market. To our knowledge, this is the first study that provides evidence of price discrimination in the Indian OTC market, in general, and currency derivatives market, in particular. This paper also contributes to the recent literature on intermediary asset pricing (e.g. He & Krishnamurthy, 2013, Adrian et al., 2014, He et al., 2017) that provides evidence of the crucial role that financial intermediaries play in the pricing of financial assets. In particular, the current study empirically highlights the role of OTC derivative dealers in creating heterogeneity in derivatives prices. A significant result in the paper highlights the difference in mark-ups charged from institutional vis-a-vis retail clients. This finding is related to a larger literature, predominantly tested empirically in equity markets, that highlights the difference in brokerage commissions charged from different categories of investors. Edmister and Subramanian (1982) provide some insights into the determinants of brokerage commission rates in the US equity market and Goldstein et al. (2009) demonstrate size effects with smaller institutions concentrating their trading (with a smaller set of brokers) more than larger institutions and paying higher per-share commissions. At a macro level, this study is also related to the literature on currency derivative markets in India. Research in the Indian derivative markets has focused on understanding the determinants of usage of currency derivatives (Raghavendra et al., 2014 and PJ, J. L., 2017) and impact of currency derivatives on exchange rate volatility (Kumar, 2015 and Singh et al., 2016). Understanding of the pricing of these contracts based on search, liquidity, and bargaining frictions remains limited in the context of Indian market. This study is expected to spur future research in this direction in India and other emerging markets. 3. Contract Booking in Currency Forward Market Prices for USD/INR forward contracts are quoted in the market in terms of Rupees per USD. A client can request for quote (one-way) for booking a currency forward contract by contacting a dealer directly, for instance, over the phone or by visiting a branch. Quotes can also be requested through certain proprietary electronic dealing platforms of individual banks and Multi-Bank Portals (MBPs); however, access to them is restricted to clients with a minimum order size. Generally, a dealer provides a quote by adding a certain markup over the prevailing interbank rate for a similar tenor contract. Interbank rate is taken as the reference rate since it is the rate at which the dealer covers the currency risk, which it takes over from the client. Markup is the spread or margin which is charged by the dealer to compensate for a number of considerations, which might include risks taken, costs incurred, and services rendered to a particular client.7 The calculation methodology for markup is not uniform and varies from dealer-to-dealer. Nevertheless, the markup is expected to take into account certain components like the cost for processing documents, counterparty risks, providing advisory services etc. The relative difficulty of hedging a forward transaction in the interbank market, depending on the liquidity of the contact's tenor, is also possibly passed on to the clients through markup. 4. Hypothesis, Data and Variable Construction 4.1 Hypothesis As mentioned earlier, the Indian currency derivatives market witnesses participation from a diverse investor base (from SMEs to large corporates) and thus, in line with the existing theoretical and empirical literature on OTC markets, is prone to discriminatory pricing based on sophistication or activity of investors. Accordingly, the hypothesis adopted for this study is as follows: Hypothesis: The markup, in the Indian currency forward market, depends on sophistication of clients, with less sophisticated clients incurring higher markup for booking currency contracts. 4.2 Data Clearing Corporation of India Limited (CCIL) operationalized TR services for reporting of OTC currency derivative transactions in 20128. As per the RBI guidelines, all dealers are required to report currency derivative transactions to CCIL TR. Transaction level data on OTC currency derivative transactions executed during a one-year period from September 1, 2018 to August 31, 2019, retrieved from CCIL TR, was used for this analysis. Transactions which were active during the month of September 2019 or had been settled till then were retrieved. Refintiv Eikon’s (Eikon) USD/INR spot and interdealer outright forward prices were obtained for calculation of markup. The choice of sample period was guided mainly by two reasons. A one-year period provided sufficient number of observations to draw meaningful conclusions for the Indian currency forward market. The dataset was contemporary and any results/conclusions drawn from it were likely to be representative of the current microstructure of the market. Additionally, the data series used in the paper from Eikon was only available for this particular time-period. Movements in daily closing prices of USD/INR spot and outright forwards for 1 month (1M), 3 months (3M) and 1 year (1Y) tenors during the sample period are depicted in Chart 1. Rupee traded with depreciating trend during the initial days (and H1 of 2018-19) on account of rising crude oil prices and tightening of global financial conditions due to increase in Federal funds rate, and touched a low of 74.4 per USD during October 2018. The Rupee, thereafter, recovered in Q4 of 2018-19 and remained range bound during Q1 of 2019-20. During July, 2019 Rupee remained in the range of 68-69 per USD but depreciated to 72 level in August, 2019, with geopolitical tensions and risk-off sentiments. The average daily closing 1 month, 3 months and 1 year forward premium during the period were 26.93, 76.64 and 296.10 paise per USD, respectively. 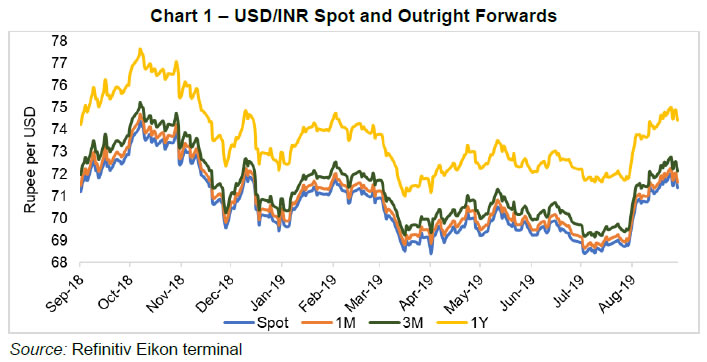 The transaction dataset comprised outright forward transactions. Each transaction level data point provided information related to - both counterparties (through name); trade date and time and; currency pair, exchange rate, settlement date and notional value of the contract. The analysis was restricted to USD/INR deals, which is the most liquid pair in the onshore market. While transactions for an individual person (including joint account or proprietary firm) are permitted beyond interbank market hours9, interbank rates for such time periods are not available for markup calculation. Hence, these transactions were filtered out. The onshore currency forward market is quite illiquid for tenors exceeding one year10, therefore, transactions with tenor exceeding 365 days were omitted from the analysis. For the remaining data, a truncation was done to remove trades with outlier spreads (falling in the top and bottom 0.1 percentile) and notional amount (top 0.1 percentile). Table 1 outlines step-by-step filtering applied on the data. Post filtering, a set of 2,55,352 trades, between 8,173 clients and 70 dealers, was finalised for the analysis. | Table 1: Filtering of Data | | Total USD-INR forward deals | 3,77,379 | | (-) Forward time option deals* | 76,538 | | (-) Trades with timestamp beyond interbank market time | 30,051 | | (-) Trades exceeding 1 year maturity | 14,668 | | (-) Trades with outlier spreads | 770 | | Number of total deals considered | 2,55,352 | Note: *Forward time option deals where the client has the option of settling forward transactions during a specific period instead of a specific date has been dropped in the first step to consider only plain vanilla forward transactions.
Source: CCIL TR data; authors’ calculations. | 4.3 Summary Statistics Table 2 reports summary statistics. The first panel shows information pertaining to the 8,173 clients who have transacted during the observation period. Average client markup is the average markup that a client pays on its transactions. Dealer counterparties indicate the total dealers with which a client has entered into forward transactions. Gross notional and number of transactions indicate the total notional value and number of contracts, respectively, booked by the client. The client at 90th percentile is charged about thirty five times the markup incurred by the client at 10th percentile, hinting at possible price discrimination. With regard to dealer counterparties, more than 75 per cent of the clients have transacted with a single dealer and even the 90th percentile client has entered into transactions with only two dealers, implying possible frictions in accessing market makers for majority of the clients. The clients in top 0.1 per cent bracket have access to 15 to 29 dealers. The gross notional amount traded for the client at 10th and 90th percentile is about 0.1 million and 26 million, respectively. The mean gross notional of 49.2 million is higher than that of 90 per cent of the clients indicating a highly skewed distribution. Further, the median client has booked a total of 6 contracts while client at 90th percentile has booked 63 contracts, out of the total 2,55,352 transactions analysed. | Table 2 – Descriptive statistics | | Variables | Observations | Mean | Standard deviation | p10 | p25 | p50 | p75 | p90 | | Client data | | Average client markup (paise) | 8,173 | 21.2 | 24.9 | 1.4 | 5.3 | 13.0 | 30.9 | 50.2 | | Dealer counterparties | 8,173 | 1.4 | 1.2 | 1 | 1 | 1 | 1 | 2 | | Gross notional (USD mn) | 8,173 | 49.2 | 973.7 | 0.1 | 0.2 | 0.9 | 5.3 | 26.0 | | Number of transactions | 8,173 | 31.2 | 149.0 | 1 | 2 | 6 | 22 | 63 | | Transaction data | | Markup (paise) | 2,55,352 | 9.5 | 19.5 | -5.9 | 0.2 | 5.3 | 14.8 | 31.9 | | #Dealers | 2,55,352 | 4.3 | 5.6 | 1 | 1 | 2 | 5 | 9 | | Tenor (days) | 2,55,352 | 88.1 | 91.0 | 6 | 24 | 56 | 120 | 227 | | Notional (USD mn) | 2,55,352 | 1.6 | 5.2 | 0.0 | 0.1 | 0.2 | 0.7 | 3.5 | | Customization (days) | 2,55,352 | 5.6 | 5.1 | 0 | 1 | 4 | 10 | 14 | | Volatility | 2,55,352 | 0.54 | 1.45 | 0.07 | 0.15 | 0.30 | 0.58 | 1.09 | Note: p10, p25, p50, p75 and p90 are 10th, 25th, 50th, 75th and 90th percentiles, respectively.
*: Existing empirical studies [Hau et al. (2019)] also find negative spreads in their data which they mention is plausible due to literature on price dependence of inventory positions of market makers.
Source: CCIL TR data; authors’ calculations. | The bottom panel (transaction data), in Table 2, describes data on 2,55,352 trades executed during the observation period. Markup is the markup for a transaction. #Dealers indicate the total number of dealers with which a client has transacted during the observation period. Tenor and notional imply the tenor and notional value, respectively, for a transaction. Customization is the difference of settlement date of the transaction from the nearest month end date. Rogers-Satchell volatility11 has been used to measure volatility in spot prices. The values of volatility derived as per the formula have been multiplied by 104 for consistency of regression coefficients. The average spread for all trades was 9.5 paise, lower than the average spread for clients of 21.2 paise. Further, more than half of the transactions during the sample period were undertaken by clients having 2 or more dealer counterparties, who account for less than a quarter of the total clients. The median transaction has a tenor of 56 days. A frequency distribution of tenor of the contracts (upto 1 year) is provided in Chart 2. The average notional value of a contract is USD 1.6 million with a standard deviation of 5.2 indicating a significantly high dispersion in hedging requirements. Additionally, the data also indicates that the client was long USD in majority (56 per cent) of the contracts. 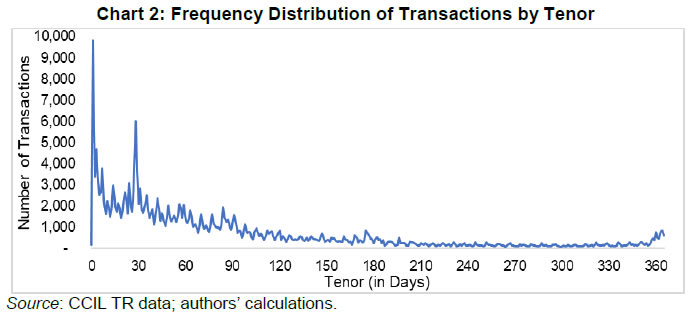 4.4 Variables 4.4.1. Markup In cases of non-standard tenors, interpolation from nearest standard tenors was used for arriving at Ht and Lt. 4.4.2. Client Sophistication During the one-year observation period, the number of dealer counterparties with which a client has traded in USD/INR forwards, #Dealers, has been considered as the measure of client sophistication. This is based on the inference by Duffie et al. (2005) that smaller investors, typically those with fewer search options, receive less favourable prices. #Dealers has been used to quantify the search options of a client, with a more sophisticated client having better access to market makers (thus, higher value of #Dealers) and, thereby, commanding more bargaining power relative to a less sophisticated client, who has fewer search alternatives (or lower value of #Dealers). Thus, client sophistication rises with an increase in dealer counterparties. 4.4.3. Client Classification/Categorisation Investors/clients in financial markets are generally classified as retail and institutional clients. While these are amorphous terms which are frequently used with varying meanings, in this study, an attempt has been made to categorize clients into retail and institutional, based on identities. Accordingly, the clients in the study were categorized into following functional categories: (1) retail clients; (2) unlisted companies12; (3) listed companies13; (4) foreign investors and; (5) related entities (offshore branches/offices or related entities of dealer banks). Retail clients category consists of individuals, sole proprietorships, partnerships and small companies which were not covered in CMIE Prowess database14. The classification of clients into listed and unlisted categories is based on Corporate Identification Number (CIN), obtained by matching the client name from CCIL data with that in CMIE. Foreign investors category mainly has FPIs, but also few clients with direct investments. The data for FPIs was taken from Central Depository Services Limited (CDSL). There were five clients who were part of Prowess database but had no reported CIN (classified as Others). | Table 3: Client Categorization | | Client Category | Notional (share in %) | #Clients | | Listed | 57 | 742 | | Unlisted | 27 | 3,773 | | Foreign Investor | 10 | 58 | | Retail | 3 | 3,586 | | Related Entity | 2 | 9 | | Others | 1 | 5 | | Grand Total | 100 | 8,173 | Note: Notional represents the relative value of gross notional traded. The total number of clients in each category is mentioned in #Clients.
Source: CCIL TR data; authors’ calculations. | 4.4.4. Contract Parameters A dealer has to follow certain standard operational procedures, like processing client documentation etc., while booking a forward contract. The fixed cost incurred by a dealer on account of such procedures is possibly passed on to the client through markup. Since this fixed cost doesn’t vary based on the notional value of the contract, the markup is likely to be inversely related to notional value of the contract. A dealer covers the currency risk, which it assumes from the client, through an opposite position in the interbank market. Therefore, transaction with notional value less than interbank lot size exposes the dealer to market risk, as it cannot be immediately covered in interbank market. Dealers generally collate several small transactions and cover the risk once the gross notional of such transactions become dealable in the interbank market. Hence, notional value of the contract is expected to inversely influence markups. Furthermore, contracts with settlement date coinciding with month-end, which are standard tenors and fairly liquid, are relatively easier to cover. Therefore, customization of contract, i.e. the difference in days of the settlement date, of the forward contract, from the nearest month end, could increase the markup. Liquidity in the forward market dries up as the tenor increases, hence, the markup may increase with the tenor of the contract. Volatility in exchange rate will also impact dealer’s ability to cover his position. Hence, Rogers-Satchell Volatility, based on extreme values (open-high-low-close of spot prices) during each half hour interval has been used.15 The volatility numbers thus obtained are multiplied by 104 while estimating the regression models in order to normalize the coefficients16. A long or short position in USD may not be equivalent for a dealer on account of factors like asset-liability management, capital charges etc. Hence, a sell dummy variable, with values 1 and 0 depending upon whether the client is short or long USD, respectively, has been used to capture the impact of buying or selling USD on spread. 4.4.5. Dealer Heterogeneity As has been mentioned, markup calculation methodology is not uniform across dealers. Despite accounting for client sophistication and contract characteristics, there are certain dealer-specific characteristics which influence markup. Hence, dealer fixed effect, to account for dealer heterogeneity, has been used in the model. 4.4.6. Date and Time Fixed Effects Date fixed effect has been used to capture the impact of date-specific effects. Research, for instance, Khademalomoom and Narayan (2019), exhibits that time-of-day, because of factors like overlap with other major markets, influence the behaviour of currency returns. In the model, this has been accounted for through minute of day fixed effect. 5. Empirical Methodology and Results 5.1. Client Sophistication Chart 3 plots average markup paid by clients trading with a specific number of dealer counterparties. It indicates that the markup declines with an increase in client sophistication. Clients transacting with a single dealer counterparty (unsophisticated clients) paid, on an average, a markup of around 18 paise while the same in case of clients transacting with two dealer counterparties was about 9 paise. Average markup incurred by highly sophisticated clients, with access to ten or more dealers, was close to zero. It is noteworthy to mention that more than 83 per cent of the clients have transacted with only one dealer counterparty during the study period, and are, therefore, relatively unsophisticated. 5.1.1 Model A linear model, similar to the one developed by Hau et al. (2019) albeit with certain modifications, was used for estimating markup. The specification is as provided below: 5.1.2 Results Results for regressions of the markup on measures of client sophistication and contract characteristics are presented in Table 4. The controls have been defined in Section 4.4. The regression results substantiate the hypothesis that dealers charge higher markup from less sophisticated clients while booking currency forward contracts. It can be observed from the results that the markup was negatively related to the degree of client sophistication, or the number of dealer counterparties of a particular client, and that this relation is statistically significant at 1 per cent level of significance. This effect was found consistently across all regression specifications. | Table 4: Regression Results: Markup on Client Sophistication | | Explanatory Variable | (1) | (2) | (3) | (4) | | Client specific characteristics | | Log#Dealers | -4.30***
(0.53) | -4.24***
(0.52) | -4.17***
(0.51) | -4.10***
(0.50) | | Contract specific characteristics | | LogTenor | 2.45***
(0.27) | 2.43***
(0.27) | 2.39***
(0.26) | 2.37***
(0.26) | | LogNotional | -0.84***
(0.16) | -0.84***
(0.15) | -0.86***
(0.15) | -0.86***
(0.15) | | LogCustomization | 1.67***
(0.24) | 1.66***
(0.23) | 1.64***
(0.23) | 1.64***
(0.23) | | Volatility | -3.73
(4.79) | -3.44
(4.77) | -1.34
(4.22) | -0.77
(4.21) | | Sell | 7.86***
(0.54) | 7.87***
(0.53) | 7.53***
(0.54) | 7.54***
(0.53) | | Fixed Effects (FEs) | | Dealer FE | Yes | Yes | Yes | Yes | | Date FE | No | No | Yes | Yes | | Minute-of-day FE | No | Yes | No | Yes | | Adjusted R-squared | 0.23 | 0.23 | 0.24 | 0.24 | | Observations | 255,352 | 255,352 | 255,352 | 255,352 | Note: *, **, *** denote statistical significance at the 10%, 5%, and 1% levels, respectively.
Standard errors clustered at the client level are reported in parentheses. | With regard to contract specifications, as expected, longer tenor and higher degree of customization increase the markup. It was also observed that higher markups were charged for transactions where the client was short USD indicating that dealers charge a premium when clients are selling dollars and buying rupees in the forward market. Results also indicate that markups decrease with increasing notional value of contract, in accordance with the practice of fixed cost charged per transaction. Volatility does not seem to have a significant impact on markup. It‘s magnitude goes down after inclusion of date and minute-of-day fixed effects. This could be because variation in daily volatility gets absorbed in these fixed effects. 5.2. Client Categorisation Category wise average markup charged vs the percentage of clients transacting with two or more dealer counterparties for each category is plotted in Chart 4. It can be observed that a wide dispersion exists in the transaction cost incurred by clients. While average spread for retail clients remained high at about 19 paise, the same for related entities, foreign investors and listed entities were in the range of 3 to 4 paise. The average markup for transactions involving unlisted firms was 11 paise. Further, as the proportion of clients with access to two or more dealers increases for a category, the average spread decreases, in alignment with the findings in the previous section (5.1). However, foreign investors and related entities appear to be an exception. Because of low number of clients in the others category, it was not included in the analysis in this section. 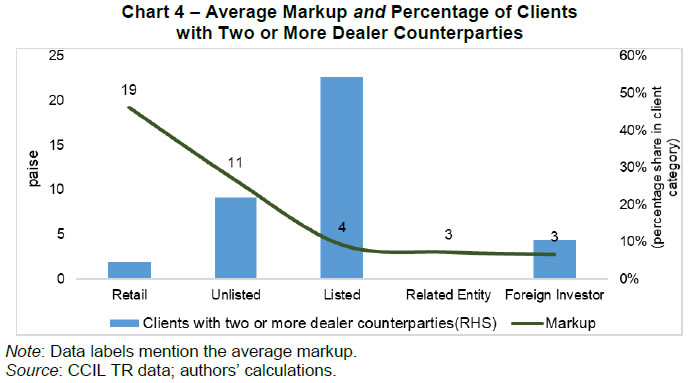 A more detailed analysis of the category of foreign investors and related entities was undertaken to understand if there were some other unobservable constraints that were guiding their use of limited dealer counterparties. It was found that on account of regulatory and business-related factors, an FPI invests, across multiple asset classes, in the Indian markets through arrangements with an onshore custodian bank. It was observed that all custodian banks are also dealers, and generally, FPIs booked USD/INR currency forwards with their respective custodian banks17. Therefore, while FPIs are fairly sophisticated investors, their arrangement with a single dealer is on account of factors not related to lower search and bargaining power. Within foreign investors category, clients transacting with multiple dealers were those with direct investments. The same is also true for related entities, wherein the offshore branches/ related entity of a dealer transacted with their dealer counterparts. 5.2.1 Model To control for various contract-specific, dealer-specific or date/time-specific factors, the following linear model was used: 5.2.2 Results Results from regressions based on client category dummies are reported in Table 5. Related entities is the omitted client category dummy for these regression specifications as they are expected to receive the market price for the currency pair, or a price very close to market price. The results were consistent with this hypothesis. The results suggest that retail clients, with a high share of about 96 per cent transacting with a single dealer counterparty, were observed to be charged the highest markup. The next highest markup was charged from unlisted firms followed by foreign investors. The listed entities did not incur a markup that is significantly different from that incurred by related entities indicating high sophistication. | Table 5: Regression Results: Markup on Client Categories | | Explanatory variable | (1) | (2) | (3) | (4) | | Client categories | | Foreign Investor | 2.74*
(1.66) | 2.69*
(1.61) | 3.05*
(1.62) | 2.96*
(1.57) | | Listed | -1.72
(1.65) | -1.19
(1.59) | -0.90
(1.57) | -0.36
(1.52) | | Unlisted | 3.06*
(1.56) | 3.47**
(1.51) | 3.69**
(1.51) | 4.12***
(1.45) | | Retail | 8.35***
(1.79) | 8.69***
(1.72) | 8.87***
(1.73) | 9.23***
(1.66) | | Contract specific characteristics | | LogTenor | 2.88***
(0.24) | 2.84***
(0.24) | 2.81***
(0.23) | 2.77***
(0.23) | | LogNotional | -1.38***
(0.17) | -1.36***
(0.16) | -1.37***
(0.16) | -1.35***
(0.16) | | LogCustomization | 1.65***
(0.23) | 1.64***
(0.22) | 1.62***
(0.22) | 1.62***
(0.22) | | Volatility | -5.23
(4.78) | -4.71
(4.75) | -3.01
(4.31) | -2.21
(4.28) | | Sell | 7.93***
(0.55) | 7.94***
(0.54) | 7.58***
(0.55) | 7.60***
(0.54) | | FEs | | Dealer FE | Yes | Yes | Yes | Yes | | Date FE | No | No | Yes | Yes | | Minute-of-day FE | No | Yes | No | Yes | | Adjusted R-squared | 0.22 | 0.23 | 0.24 | 0.24 | | Observations | 255,036 | 255,036 | 255,036 | 255,036 | Note: *, **, *** denote statistical significance at the 10%, 5%, and 1% levels, respectively.
Standard errors clustered at the client level are reported in parentheses. | Separate category wise regressions were estimated to understand the impact on markup caused by an increase in bargaining power through access to a larger number of dealers for each of these client categories18 (Table 6). Results were found to be consistent with the hypothesis. For each client category, an increase in the number of dealers reduced markup charged. As expected, retail clients gain the most by having access to a larger number of dealers. The improvement in markup due to better dealer access was stronger for unlisted entities vis-à-vis the listed ones. | Table 6 – Regression Results: Markup on Client Sophistication | | (Client Category Wise) | | Explanatory Variable | Retail | Unlisted | Listed | | Client specific characteristics | | Log#Dealers | -9.56***
(1.20) | -4.94***
(0.46) | -2.20***
(0.33) | | Contract specific characteristics | | LogTenor | 5.60***
(0.43) | 2.95***
(0.32) | 0.92***
(0.16) | | LogNotional | -2.08***
(0.32) | -1.05***
(0.16) | -0.26**
(0.11) | | LogCustomization | 1.97***
(0.33) | 1.92***
(0.34) | 0.62***
(0.18) | | Volatility | -8.87
(11.48) | -7.98
(5.59) | 10.37
(6.37) | | Sell | 8.79***
(0.97) | 7.39***
(0.75) | 3.27***
(0.52) | | FEs | | Dealer FE | Yes | Yes | Yes | | Date FE | Yes | Yes | Yes | | Minute-of-day FE | Yes | Yes | Yes | | Adjusted R-squared | 0.37 | 0.24 | 0.12 | | Observations | 35,431 | 125,743 | 90,865 | Note: *, **, *** denote statistical significance at the 10%, 5%, and 1% levels, respectively.
Standard errors clustered at the client level are reported in parentheses. | 5.3. Economic implications 83 per cent of all clients, who have transacted with a single dealer counterparty and contributed about one-fifth to the gross notional value, have incurred more than half of the total transaction costs (Table 7). Further, retail clients and unlisted firms contributed to less than one-third of gross notional value of transactions but their share in total markup was about two-third (Table 8). | Table 7 – Breakup of Notional Amount and Markup Paid | | (share in per cent) | | #Dealers | Clients | Notional | Markup | | 1 | 83 | 20 | 51 | | 2 and more | 17 | 80 | 49 | | Source: CCIL TR data; authors’ calculations. |
| Table 8 – Category Wise Share in Clients, Notional Amount and Markup Paid | | (share in per cent) | | Client Category | Clients | Notional | Markup | | Unlisted | 46 | 27 | 51 | | Retail | 44 | 3 | 14 | | Listed | 9.1 | 57 | 25 | | Foreign Investor | 0.7 | 10 | 7 | | Related Entity | 0.1 | 2 | 2 | | Source: CCIL TR data; authors’ calculations. | A majority (83 per cent) of clients have transacted with a single dealer counterparty. To understand the price improvement due to an increase in access to one more dealer for clients, transacting with a single dealer in each category, the following calculation was made: 6. Robustness Tests A series of robustness tests were conducted to check the consistency of the major findings of the paper and ensure that the results were not sensitive to small changes in the sample period, client category and variable definition. 6.1. High vs Low Volatility Periods The sample period was segregated into cycles of high and low volatility based on daily rolling three months realised volatility data (from Eikon) which measures the actual dispersion of returns of the currency pair over the last three months based on daily high and low prices. For the sample period considered in this study, the three months interval during October 10, 2018 to January 9, 2019 (Chart 5) was a period of high volatility and volatility was the least during the interval of May 2, 2019 to August 1, 2019. During the two volatility cycles, results were found to be consistent with what was obtained earlier (Appendix A1). 6.2. Financial Clients There were 87 financial clients (including FPIs and related entities) in the sample who engaged in a total of 4346 transactions during the sample period. They constitute a small percentage (1.06 per cent) of total clients and (1.7 per cent) of total transactions in the sample. Nevertheless, in order to test whether the impact of client sophistication on markup is being driven by trades of financial entities, regressions were estimated by excluding all financial clients from the sample. The results and analysis are reported in Appendix A2. It is observed that the results remain broadly, quantitatively and qualitatively, unaffected by this exclusion. 6.3. Additional Measures of Sophistication Additional measures of sophistication were used to test whether results were sensitive to the definition of client sophistication. In addition to the number of dealer counterparties (Log#Dealers), two more measures were used - total number of transactions entered into by a client (Log#Transactions) and total gross notional of all forward contracts traded by a client (LogGrossNotional) during the sample period. The larger the number of transactions, the more sophisticated a client is likely to be because of informational advantage on account of trading experience. Also, the higher is the trading volume of a client, the higher is the gain from negotiating with dealers to pay lower markups. A sophistication index based on the first principal component of variables: Log#Dealers, Log#Transactions and LogGrossNotional was also constructed. The results and analysis for these three additional measures of client sophistication are presented in Appendix A3. As can be observed, the results are qualitatively similar to the ones obtained using number of dealer counterparties as a measure of sophistication. Although the results in the paper were robust to alternative definitions of client sophistication, access to number of dealers has been used as a primary measure because, unlike the total number of transactions and gross notional that are governed by investors’ business requirements, access to dealers is an external factor that is a choice variable for the clients and can also serve as a target variable that can be influenced by policy makers. 6.4. Dealer Client Relationships The impact of dealer client relationships on markup was also analysed. It is possible that the set of clients in the current sample source multiple business activities to the dealer banks and hence, interact with the dealers in multiple financial markets in addition to currency markets. This can result in cross-subsidization and may affect the markup paid by clients in currency markets. Existing literature on relationship trading in OTC markets suggests that dealers provide a discount to clients with whom they have a non-exclusive relationship (Hendershott et al., 2020). In order to test for the impact of relationship trading, the dealer client interaction in bank credit market was analysed. The dealer client pair in the current sample were matched to Prowess firm level data which provides information on whether a client/firm had listed a dealer bank as their banker in external credit market. Relationship data was available on 948 clients involving 82,412 transactions. This data is biased in favour of sophisticated clients because Prowess database does not have information on small retail clients. In this matched sample, average number of dealers that each client trades with is 2.3 which is larger than the average (1.4) for the full sample. The spread was regressed on a relationship dummy which takes a value of one if the dealer was listed as a banker in Prowess data for a given client and zero, otherwise. Contract characteristics, dealer, date and minute of day fixed effects as regressors were also included. The regression results are reported in Appendix A4. The regression results in column 1 of table in Appendix A4 show that the coefficient of relationship dummy is negative but statistically insignificant. Introduction of Log#Dealers as a measure of client sophistication in regression specification results in relationship dummy being significant at 5 per cent level of significance (Column 2) hinting at discount associated with relationship trading. The discount could also be because this sample focuses mostly on sophisticated clients who have access to larger number of dealers and hence, are unlikely to pay a larger markup associated with being a captive client of a dealer. Introduction of an additional interaction term between relationship dummy and Log#dealers renders the relationship coefficients insignificant (Column 3). The coefficient of the measure of sophistication used in this study, though, remains negative and significant in the presence of relationship dummy hinting at benefits of better access to dealers even after accounting for price impact of relationship trading. 7. Conclusion The paper analysed the pricing behaviour in India’s foreign exchange market with a focus on OTC currency (USD/INR) derivatives market. The findings of the paper suggest that search frictions prevail in the Indian OTC currency derivatives market and the market is characterised by discriminatory pricing. More specifically, less sophisticated clients (i.e. clients with access to fewer dealer counterparties) were found to be paying higher markup while transacting in this market. Further, retail clients (individuals, proprietorship firms and small firms) and unlisted firms contributed to less than one-third of gross notional value of transactions but their share in total markup was about two-third. This could be on account of a higher proportion of unsophisticated clients (i.e. clients with a single dealer counterparty) within these client categories. The findings of the paper suggest that, for each client category, increased access to dealers will lead to improved negotiating power of clients and, therefore, lower transaction cost. Despite this, a large number of clients (83 per cent) transacted with a single dealer hinting at difficulties related to dealer access. Thus, there is a case for improving market access which can be achieved through increased usage of electronic trading platforms, as envisioned by G20 leaders in their statement at the Pittsburgh Summit. Electronic trading platforms, by enabling clients to access quotes from several dealer counterparties simultaneously, are likely to reduce search costs, improve transparency and enhance dealer competition for better pricing for clients.
References Adrian, T., Etula, E., & Muir, T. (2014). Financial intermediaries and the cross-section of asset returns. The Journal of Finance, 69(6), 2557-2596. Afonso, G., Kovner, A., & Schoar, A. (2013). Trading partners in the interbank lending market. Federal Reserve Bank of New York Staff Reports, no. 620. Babus, A., & Hu, T. W. (2017). Endogenous intermediation in over-the-counter markets. Journal of Financial Economics, 125(1), 200-215. Babus, A., & Kondor, P. (2018). Trading and information diffusion in over-the-counter markets. Econometrica, 86(5), 1727-1769. Bhat, G., Callen, J. L., & Segal, D. (2016). Testing the transparency implications of mandatory IFRS adoption: The spread/maturity relation of credit default swaps. Management Science, 62(12), 3472-3493. Bernhardt, D., Dvoracek, V., Hughson, E., &Werner, I. M. (2004). Why do larger orders receive discounts on the London Stock Exchange? Review of Financial Studies, 18 (4), 1343–1368. Bessembinder, H., Maxwell, W., & Venkataraman, K. (2006). Market transparency, liquidity externalities, and institutional trading costs in corporate bonds. Journal of Financial Economics, 82(2), 251-288. Bolton, P., Santos, T., & Scheinkman, J. A. (2016). Cream-skimming in financial markets. The Journal of Finance, 71(2), 709-736. Cenedese, G., Ranaldo, A., & Vasios, M. (2019). OTC premia. Journal of Financial Economics. Cocco, J. a. F., Gomes, F. J., & Martins, N. C. (2009). Lending relationships in the interbank market. Journal of Financial Intermediation, 18 (1), 24–48. Duffie, D., Gˆarleanu, N., & Pedersen, L. (2005). Over-the-counter markets. Econometrica. Duffie, D., Gârleanu, N., & Pedersen, L. H. (2007). Valuation in over-the-counter markets. The Review of Financial Studies, 20(6), 1865-1900. Dunne, P. G., Hau, H., & Moore, M. J. (2015). Dealer intermediation between markets. Journal of the European Economic Association, 13(5), 770-804. Edmister, R. O., & Subramanian, N. (1982). Determinants of brokerage commission rates for institutional investors: A note. The Journal of Finance, 37(4), 1087-1093. Edwards, A. K., Harris, L. E., & Piwowar, M. S. (2007). Corporate bond market transaction costs and transparency. The Journal of Finance, 62(3), 1421-1451. Friewald, N., & Nagler, F. (2019). Over-the-Counter Market Frictions and Yield Spread Changes. The Journal of Finance, 74(6), 3217-3257. Goldstein, M. A., Hotchkiss, E. S., & Sirri, E. R. (2007). Transparency and liquidity: A controlled experiment on corporate bonds. The Review of Financial Studies, 20(2), 235-273. Goldstein, M. A., Irvine, P., Kandel, E., & Wiener, Z. (2009). Brokerage commissions and institutional trading patterns. The Review of Financial Studies, 22(12), 5175-5212. Golosov, M., Lorenzoni, G., & Tsyvinski, A. (2014). Decentralized trading with private information. Econometrica, 82(3), 1055-1091. Green, R. C., Hollifield, B., & Schürhoff, N. (2007). Dealer intermediation and price behavior in the aftermarket for new bond issues. Journal of Financial Economics, 86(3), 643-682. Harris, L. E., & Piwowar, M. S. (2006). Secondary trading costs in the municipal bond market. The Journal of Finance, 61(3), 1361-1397 Hau, H., Hoffmann, P., Langfield, S., and Timme, Y. (2019). Discriminatory Pricing of Over-the-Counter Derivatives. IMF Working papers He, Z., & Krishnamurthy, A. (2013). Intermediary asset pricing. American Economic Review, 103(2), 732-70. He, Z., Kelly, B., & Manela, A. (2017). Intermediary asset pricing: New evidence from many asset classes. Journal of Financial Economics, 126(1), 1-35. Hendershott, T., Li, D., Livdan, D., & Schürhoff, N. (2020). Relationship Trading in Over‐the‐Counter Markets, The Journal of Finance, 75(2), 683-734. Kumar, A. (2015). Impact of Currency Futures on Volatility in Exchange Rate: A Study of Indian Currency Market. Paradigm, 19(1), 95-108. Khademalomoom, S., Narayan, P.K., 2018. Intraday effects of the currency market. Journal of International Financial Markets, Institutions and Money 58, 65–77. Loon, Y. C., & Zhong, Z. K. (2016). Does Dodd-Frank affect OTC transaction costs and liquidity? Evidence from real-time CDS trade reports. Journal of Financial Economics, 119(3), 645-672. PJ, J. L. (2017). The determinants of currency derivatives usage among Indian non-financial firms. Studies in Economics and Finance. Raghavendra, R. H., & Velmurugan, P. S. (2014). The Determinants of Currency Hedging in Indian IT Firms. Journal of Business and Financial Affairs, 3(125), 1-7. Singh, S., & Tripathi, L. K. (2016). A Critical Evaluation of Volatility in Indian Currency Market. Research Journal of Finance and Accounting, 7(9), 26-34. O’Hara, M., Wang, Y., & Zhou, X. (2018). The execution quality of corporate bonds. Journal of Financial Economics, 130 (2), 308–326. Schultz, P. (2001). Corporate bond trading costs: A peek behind the curtain. Journal of Finance, 56 (2), 677–698. Schultz, P. (2012). The market for new issues of municipal bonds: The roles of transparency and limited access to retail investors. Journal of Financial Economics, 106(3), 492-512. Stanton, R., & Wallace, N. (2011). The bear's lair: Index credit default swaps and the subprime mortgage crisis. The Review of Financial Studies, 24(10), 3250-3280. Stulz, R. M. (2010). Credit default swaps and the credit crisis. Journal of Economic Perspectives, 24(1), 73-92.
Appendix Appendix A1 - Regression Results: Markup on Client Sophistication
(During Periods of High and Low Volatility) | | Explanatory Variable | H | L | | Client specific characteristics | | Log#Dealers | -3.40***
(0.45) | -4.45***
(0.49) | | Contract specific characteristics | | LogTenor | 2.10***
(0.23) | 2.23***
(0.32) | | LogNotional | -0.75***
(0.14) | -0.79***
(0.14) | | LogCustomization | 1.38***
(0.19) | 1.52***
(0.26) | | Volatility | -0.12
(18.92) | -1.51
(39.12) | | Sell | 5.45***
(0.49) | 8.63***
(0.62) | | Fixed Effects (FEs) | | Dealer FE | Yes | Yes | | Date FE | Yes | Yes | | Minute-of-day FE | Yes | Yes | | Adjusted R-squared | 0.20 | 0.28 | | Observations | 61,450 | 62,902 | | Note: This table describes results for regressions of the markup on measures of client sophistication and contract characteristics for periods of high (H) and low (L) volatility. The segregation of observation period into two periods of high and low volatility was done based on the movement of daily rolling three months realised volatility. The controls have been defined in Section 4. *, **, *** denote statistical significance at the 10%, 5%, and 1% levels, respectively. Standard errors clustered at the client level are reported in parentheses. |
Appendix A2 - Regression Results: Markup on Client Sophistication
(for Non-Financial Clients) | | Explanatory Variable | (1) | (2) | (3) | (4) | | Client specific characteristics | | Log#Dealers | -4.51***
(0.52) | -4.44***
(0.51) | -4.38***
(0.50) | -4.31***
(0.49) | | Contract specific characteristics | | LogTenor | 2.47***
(0.27) | 2.46***
(0.27) | 2.41***
(0.26) | 2.39***
(0.26) | | LogNotional | -0.74***
(0.16) | -0.74***
(0.15) | -0.75***
(0.15) | -0.75***
(0.15) | | LogCustomization | 1.70***
(0.24) | 1.69***
(0.24) | 1.68***
(0.23) | 1.67***
(0.23) | | Volatility | -3.66
(4.81) | -3.42
(4.79) | -1.08
(4.23) | -0.55
(4.22) | | Sell | 7.68***
(0.55) | 7.70***
(0.53) | 7.30***
(0.54) | 7.31***
(0.53) | | Fixed Effects (FEs) | | Dealer FE | Yes | Yes | Yes | Yes | | Date FE | No | No | Yes | Yes | | Minute-of-day FE | No | Yes | No | Yes | | Adjusted R-squared | 0.23 | 0.23 | 0.24 | 0.25 | | Observations | 251,006 | 251,006 | 251,006 | 251,006 | | Note: This table describes results for regressions of the markup on measures of client sophistication and contract characteristics for non-financial clients. The controls have been defined in Section 4. *, **, *** denote statistical significance at the 10%, 5%, and 1% levels, respectively. Standard errors clustered at the client level are reported in parentheses. |
Appendix A3 - Regression Results: Markup on Client Sophistication
(using Alternative Measures of Client Sophistication) | | Explanatory Variable | (1) | (2) | (3) | | Client specific characteristics | | Log#Transactions | -2.31***
(0.19) | | | | LogGrossNotional | | -2.06***
(0.17) | | | Sophistication Index | | | -3.23***
(0.32) | | Contract specific characteristics | | LogTenor | 2.34***
(0.26) | 2.18***
(0.26) | 2.20***
(0.27) | | LogNotional | -1.41***
(0.18) | -0.15
(0.12) | -0.70***
(0.15) | | LogCustomization | 1.69***
(0.21) | 1.57***
(0.20) | 1.61***
(0.21) | | Volatility | -2.89
(4.27) | -3.23
(4.27) | -2.46
(4.27) | | Sell | 7.35***
(0.48) | 6.90***
(0.47) | 7.09***
(0.48) | | Fixed Effects (FEs) | | Dealer FE | Yes | Yes | Yes | | Date FE | Yes | Yes | Yes | | Minute-of-day FE | Yes | Yes | Yes | | Adjusted R-squared | 0.25 | 0.27 | 0.26 | | Observations | 255,352 | 255,352 | 255,352 | | Note: This table describes results for regressions of the markup on three alternative measures of client sophistication. The first one is Log#Transactions which is calculated as the log of the total number of transactions entered into by a client in the sample period. The second measure is LogGrossNotional which is calculated as log of gross notional of all forward contracts traded by a client in the sample period. The third is a Sophistication Index which is calculated as the first principal component of Log#Dealers, Log#Transactions and LogGrossNotional. The controls have been defined in Section 4. *, **, *** denote statistical significance at the 10%, 5%, and 1% levels, respectively. Standard errors clustered at the client level are reported in parentheses. |
| Appendix A4 - Regression Results: Markup on Relationship Trading | | Explanatory Variable | (1) | (2) | (3) | | Client specific characteristics | | Relationship | -0.62
(0.65) | -1.31**
(0.65) | -1.08
(1.83) | | Log#Dealers | | -2.80***
(0.56) | -2.69***
(0.81) | | Relationship * Log#Dealers | | | -0.13
(0.76) | | Contract specific characteristics | | LogTenor | 1.57***
(0.21) | 1.14***
(0.26) | 1.14***
(0.26) | | LogNotional | -0.73***
(0.14) | -0.28*
(0.15) | -0.29**
(0.14) | | LogCustomization | 0.96***
(0.23) | 0.85***
(0.21) | 0.85***
(0.21) | | Volatility | 3.91
(6.26) | 4.95
(6.23) | 4.96
(6.23) | | Sell | 4.24***
(0.72) | 3.73***
(0.71) | 3.73***
(0.71) | | Fixed Effects (FEs) | | Dealer FE | Yes | Yes | Yes | | Date FE | Yes | Yes | Yes | | Minute-of-day FE | Yes | Yes | Yes | | Adjusted R-squared | 0.15 | 0.17 | 0.17 | | Observations | 82,412 | 82,412 | 82,412 | | Note: This table describes results for regressions of the markup on relationship trading of client and dealer pairs. The controls have been defined in Section 4. *, **, *** denote statistical significance at the 10%, 5%, and 1% levels, respectively. Standard errors clustered at the client level are reported in parentheses. | |