Press Release RBI Working Paper Series No. 07 Impact of Leverage on Firms’ Investment: Decoding the Indian Experience @Avdhesh Kumar Shukla and Tara Shankar Shaw Abstract 1It has been observed in India that economic growth cycle coincides with the investment cycle. We find that firm-level leverage could provide early signals about the movements in the investment cycle. Furthermore, a firm’s leverage adversely affects its investment activity after a threshold. Regression results after controlling for firm’s price to book ratio and operational variables indicate that adverse impact of high leverage on low growth firms is predominant. We conclude that initiatives to clean up balance sheets of banks and deleveraging by non-financial corporates should help in revival of the investment cycle. Our results are consistent with the agency cost of debt and trade-off theory of capital structure, where firms set a target for leverage by balancing costs and benefits of debt. JEL Classification: D22, E3, G31 and G32 Keywords: Leverage, capital formation, investment cycle, corporate investment Introduction The recent deceleration in India’s economic growth has reinvigorated the debate about challenges of returning to a durable and sustained high growth trajectory which Indian economy had achieved before the global financial crisis (GFC) (RBI, 2019). The GDP growth during 2012-2020 was characterised by a significant slowdown in capital formation. The literature provides evidence that the slowdown in investment growth was driven by lower capital formation in the private sector (Pattanaik, et al., 2013; Anand and Tulin, 2014; GoI, 2017; and RBI, 2018). Decline in investment growth was particularly noticeable in manufacturing, electricity and other utilities, construction, transport and communication services. The private sector firms in these sectors recorded a significant increase in leverage after the global financial crisis (GFC). The literature has sought to explain investment slowdown in terms of macroeconomic factors viz., higher real interest rate, increased policy uncertainty after GFC, tepid domestic and global demand conditions and appreciated real exchange rate (Kose, Ohnsorge, Ye, and Islamaj, 2017; Chhibber and Kalloor, 2016; Pattanaik, et al., 2013). Though the macroeconomic factors are important determinants of investment behaviour, they do not fully explain the slowdown in investment activity. Therefore, this study attempts to explore whether the firms’ leverage, which increased sharply after the GFC, has affected investment behaviour in India. The literature suggests that capital structure and debt overhang in balance sheets of non-financial firms, after the GFC, have played an important role in capital formation slowdown in many economic jurisdictions (Gebauer, Setzer, and Westphal (2018). According to trade-off theory of capital structure, firms set a target for leverage ratio, considering the costs and benefits of debt. In a scenario of debt overhang, a firm may try to restore the leverage target and give up valuable investment opportunities when internal funds are not sufficient (Meyers, 1977; Myers and Majluf, 1984). This phenomenon becomes even more pronounced during times of financial duress when probability of bankruptcy increases. In view of the above, this paper tests the relationship between firms’ leverage and their investment in the Indian context. Following the theoretical underpinnings of trade-off theory of capital structure (Myers and Majluf, 1984) and agency cost theory of debt (Jensen and Meckling, 1976), we find that high firm-level leverage is a precursor to slowdown in investment. We also find that investment slowdown is more pronounced in firms with lesser growth opportunities. Based on our results, we argue that initiatives to clean the balance sheets of non-financial firms should help in sustained revival of investment activity, although in the near-term this may have an adverse impact on capital formation by the non-financial corporate sector, thereby slowing down economic growth in the short run temporally. The study provides new evidence on the relationship between firms’ leverage and their investment behaviour and extends the existing literature in several important ways, including the treatment of endogeneity between investment and leverage. Generally, the literature on leverage and investment has concentrated on the experience of the US and euro area economies. By analysing the experience of the Indian economy, our study fills an important gap in the context of emerging market economies. We empirically demonstrate that heightened corporate leverage, through adverse impact on investment activity, aggravated the economic slowdown in the Indian economy. The remainder of the paper is organised into five sections. Theoretical underpinnings relating to firms’ physical investment and capital structure are covered in Section II. Data sources and methodology are outlined in Section III. Section IV covers stylised facts about India’s economic growth, capital formation and other relevant macro and micro-economic variables. The results of econometric analysis and key findings are discussed in Section V. Section VI concludes the paper. II. Theoretical underpinnings The role of investment in economic growth has attracted prolific research attention with analysis covering both the macro and the micro level aspects. As per the standard macroeconomic theory, investment is affected in the short to medium-term by a host of micro and macroeconomic factors such as interest rate, policy uncertainty, domestic and global demand conditions, firm’s sales and profitability and its leverage (Kose, Ohnsorge, Ye, and Islamaj, 2017; Chhibber and Kalloor, 2016; Anand and Tulin, 2014; Pattanaik, et al., 2013). In case of microeconomic determinants, debates on firm level drivers of capital expenditure are guided by the Modigliani and Miller’s (MM) (1958) capital structure irrelevance hypothesis and the trade-off hypothesis of financing structure (Myers and Majluf, 1984). According to MM (1958) theory, under the assumptions of perfect market conditions, capital structure of a firm is irrelevant for its valuations. The capital formation of a firm is guided by its operating performance, viz., sales growth, profitability and cost of finance. However, in the presence of financial frictions, irrelevance of capital structure hypothesis of MM does not hold. Rather firms generally face a trade-off in capital structure (Myers and Majluf, 1984). They set a target for leverage ratio by balancing costs and benefits of debt. The key cost of debt overhang is the risk of bankruptcy, while benefits accrue in the form of tax savings and oversight by the lenders. In a scenario of debt overhang, a firm may try to restore the leverage target and give up valuable investment opportunities when internal funds are not sufficient (Meyers, 1977; Myers and Majluf, 1984). This phenomenon becomes even more pronounced for firms with weaker growth opportunities during the times of financial duress when probability of bankruptcy looms large on the horizon. During this period, leveraged firms with weaker growth opportunities may shelve or postpone their decisions on capital formation. In a study of a group of five peripheral euro area countries2 for the period 2005 to 2014, Gebauer, Setzer, and Westphal (2018) find a negative relationship between corporate leverage and their capital expenditure. In an analysis of the Brazilian economy, Krznar and Matheson (2018) show the role of high leverage in restricting new investments by firms. A similar study on the impact of leverage on investment at firm level for Canadian enterprises shows that a higher level of debt reduces investment in low growth firms, as benefits are expropriated by the bondholders rather than the shareholders and management (Aivazian, Ge, and Qiu, 2005). A survey of the literature reveals that in the aftermath of the global financial crisis of 2008-09, researchers have renewed their focus on firms’ capital structure and its relationship with economic activity. The Economist (2011) highlights the role of complex financial engineering used by large infrastructure firms for financing mega investment projects in India, which made them unsustainable. Pattanaik, et al. (2013) also identify strains in the balance sheet of private firms as a cause of investment slowdown. Nagaraj (2013) points to the fact that growth of the Indian economy during 2003-08 was driven by private corporate debt. This led to higher levels of leverage for firms as credit was easily available. After the crisis of 2008, external demand fell sharply, which in conjunction with higher debt repayment costs, led to a sharp decline in capital expenditure. The Economic Survey, 2016-17 analyses stressed balance sheets of commercial banks and non-financial corporate sector of India and finds adverse impact of debt overhang on capital expenditure in the Indian economy (GoI, 2017). This phenomenon of huge sour assets in the books of banks and debt overhang of corporates is commonly known as the twin balance sheet syndrome of the Indian economy. The focus of extant literature in India has been on probing the relationship between macroeconomic variables, viz., real interest rate, real effective exchange rate (REER), policy uncertainty, etc. and investment. However, as mentioned by Pattanaik, et al. (2013), real interest rate and other macroeconomic variables are not sufficient to fully explain the investment slowdown. Similarly, the policy uncertainty has also not provided an adequate explanation for the investment slowdown, as it has reverted to pre-crisis levels after peaking in 2013. Against this backdrop, the analysis of firm level data is likely to provide further insights into the slowdown in fixed capital formation in India. Besides the direction of causality between firms’ debt overhang and their physical investment, another important question relates to the assumption of a linear relationship between the two. The theory of agency cost of debt by Jensen and Meckling (1976) suggests that at a lower level, debt has a disciplining effect on firm managers, but at higher levels, it increases the probability of bankruptcy and misallocation of resources. Therefore, the literature suggests a non-linear relationship between the leverage and firm’s investment. In case of Spain, Hernando and Martı ́nez-Carrascal (2008) find non-linearity between leverage and firm’s investment. This was reiterated by Gebauer, Setzer and Westphal (2018) in their study of five peripheral euro area economies. They find that the negative impact of leverage on investment is higher when the debt-asset ratio is above 90 per cent. Following the literature, we test two key hypotheses as outlined below. -
Firm leverage affects physical investment negatively; and -
Relationship between physical investment and leverage is non-linear, i.e. at lower levels of leverage it has either positive or no impact, while at higher levels it negatively affects investment. III. Data and methodology The key variables used in the study are listed in Table 1. Firm level data are obtained from CMIE Prowess database. The data cover the period 2004-2017. Firms comprising both listed and non-listed non-financial entities (firms with NIC-2-digit codes 64, 65 and 66 are dropped) have been included. Firm level data show by extreme variations, therefore, rates and ratios are winsorised at one3 per cent. Furthermore, firms with missing observations for total assets, net sales, gross fixed assets and debt to equity ratio are removed from the dataset; and firms, with a minimum of six annual observations are included. Accordingly, we have data on 5,779 firms providing 54,354 firm-year observations. Macroeconomic data have been sourced from the Database on the Indian Economy of the Reserve Bank of India. Data relating to policy uncertainty was obtained from the web portal www.policyuncertainty.com. Though leverage is a well understood concept, there is no common yardstick to measure it. Hence, it is important to first define financial leverage of a firm. Following the literature, we use debt to equity ratio, interest coverage ratio and debt to asset ratio to measure financial leverage (Rajan and Zingales, 1995; Gebauer, Setzer, and Westphal, 2018). Investment is defined as the ratio of annual changes in gross fixed assets to fixed capital of the previous year (Table 1). | Table 1: Firm level and macroeconomic variables used in the study | | Firm level variables | | Investment rate | Annual change in net total fixed assets plus depreciation (in %) | | Leverage | Ratio of financial debt to equity, with financial debt including loans, securities and other current liabilities | | Debt to asset ratio | Ratio of financial debt to total assets (%) | | Growth of debt | Annual growth of borrowing (%) | | Interest rate burden/ interest coverage ratio | Ratio of earnings before interest, taxes, depreciation and amortisations (EBITDA) to interest payments (times) | | Profitability (RoA) | Ratio of earnings before interest, taxes, depreciation and amortizations (EBITDA) to total assets (%) | | Growth in profits | Annual growth in EBITDA (%) | | Size of firm | Log of total assets | | Price to book ratio | Ratio of equity prices to per share book value of firm. It represents growth opportunity of the firm | | Macroeconomic variables | | Effective policy rate | A weighted average of repo and reverse repo rates (weights are assigned on basis of liquidity conditions in the Liquidity Adjustment Facility Window) | | Policy uncertainty index | Baker, Bloom, and Davis uncertainty index http://www.policyuncertainty.com/about.html | Based on theoretical underpinnings and the literature, we test the following fixed effect base model: A priori, higher leverage is expected to be negatively associated with physical investment while sales growth, profitability, debt repaying capacity and growth in firm’s debt are expected to have a positive impact on its investment. To further test the robustness of our results, similar specifications were tested at the sectoral level for manufacturing sector, construction sector and metals. IV. Stylized facts relating to investment and firms’ capital structure A component-wise analysis of GDP suggests that the growth rate of real investment decelerated sharply after 2011-12 (RBI, 2019). In terms of contribution to GDP growth, the share of capital formation during the period 2011-19 was less than one-fourth in contrast to around two-third during high growth phases, viz., 2003-08 and 2009-11. Within gross capital formation (GCF), contribution of gross fixed capital formation (GFCF) during the period 2014-19, at around 25 per cent, in fact, was significantly lower than the level of 51.3 per cent seen during 2003-08. During the high growth phase, the firms in key infrastructure sectors witnessed an increase in leverage and consequent deterioration in their debt repayment capacity after 2011-12 (Chart 1 and Chart 2). The buildup of leverage in power and telecommunication is a relatively recent phenomenon, while in iron and steel and construction sector it is a cyclical phenomenon. Power generation and telecommunication were considered as promising sectors of the economy. However, these sectors grew at a rapid pace during the high growth phase, while also building up firm level leverage. The buildup of leverage is reflected in the deterioration of interest coverage ratio (ICR) of these sectors. Amongst these, worsening of ICR of the telecommunication sector was very prominent (Chart 2). The mean rate of capital formation (ratio of annual change in gross fixed assets to gross fixed assets at the end of the previous year) by non-financial firms peaked in 2008-09. Since then it has recorded a secular decline across sectors (Table 2). The average rate of capital formation, however, reversed its trend in 2017-18. | Table 2: Investment rate of non-financial firms | | Year | All firms | Manufacturing | Construction | Metals | | N | Mean | p50 | N | Mean | p50 | N | Mean | p50 | N | Mean | p50 | | 2004-05 | 2980 | 7.7 | 4.0 | 1940 | 7.7 | 4.3 | 156 | 9.6 | 6.6 | 584 | 8.9 | 5.0 | | 2005-06 | 3166 | 9.5 | 5.2 | 2040 | 9.6 | 5.5 | 160 | 10.0 | 4.9 | 625 | 11.6 | 7.3 | | 2006-07 | 3468 | 12.6 | 7.1 | 2167 | 12.5 | 7.4 | 185 | 17.8 | 13.3 | 673 | 14.3 | 9.4 | | 2007-08 | 3820 | 14.6 | 8.6 | 2343 | 14.1 | 8.8 | 227 | 22.2 | 17.3 | 730 | 15.1 | 9.3 | | 2008-09 | 4088 | 14.8 | 8.8 | 2481 | 14.4 | 9.0 | 261 | 20.9 | 16.5 | 799 | 15.7 | 10.1 | | 2009-10 | 4271 | 13.3 | 7.6 | 2565 | 12.7 | 7.9 | 284 | 19.5 | 16.4 | 846 | 14.4 | 9.0 | | 2010-11 | 4379 | 11.2 | 5.8 | 2607 | 11.3 | 6.2 | 301 | 13.1 | 7.0 | 852 | 12.5 | 7.2 | | 2011-12 | 4350 | 10.9 | 6.5 | 2575 | 10.8 | 6.9 | 295 | 12.7 | 8.7 | 851 | 12.1 | 8.0 | | 2012-13 | 4430 | 11.0 | 6.0 | 2585 | 10.9 | 6.5 | 310 | 12.7 | 6.7 | 860 | 12.3 | 7.8 | | 2013-14 | 4380 | 9.7 | 4.9 | 2570 | 9.9 | 5.6 | 311 | 10.5 | 5.3 | 845 | 10.4 | 6.1 | | 2014-15 | 4307 | 8.5 | 4.1 | 2547 | 8.7 | 4.8 | 302 | 7.2 | 2.3 | 843 | 9.2 | 4.8 | | 2015-16 | 3988 | 6.5 | 3.1 | 2333 | 6.9 | 3.7 | 297 | 4.8 | 1.1 | 770 | 7.2 | 3.9 | | 2016-17 | 3702 | 0.6 | 2.4 | 2191 | 2.2 | 3.1 | 279 | -3.9 | 0.0 | 726 | 2.3 | 2.8 | | 2017-18 | 3025 | 6.9 | 3.8 | 1822 | 7.2 | 4.5 | 237 | 4.9 | 1.1 | 599 | 7.6 | 4.7 | Note: N represents the number of firms and P50 represents the median.
Source: Authors calculation on basis of CMIE Prowess data. | Firm valuations, as measured by price-to-book (PB) ratio of listed firms, peaked in 2007-08. It declined sharply in 2008-09 in the aftermath of the GFC and recovered in 2009-10 (Chart 3). However, since then PB ratio of listed firms have moved around their long-period average. PB ratio generally reflects the future expectations of firms’ performance. This is used as a proxy of growth opportunities in the absence of Tobin’s q. This ratio also indicates the return recorded by a firm against its book value (i.e., historical investment). A low PB ratio indicates that the market return of Indian firms post-GFC was significantly lower than the pre-GFC return.  Debt-equity ratio, a key proxy for firms’ leverage, increased considerably after 2008, though it showed some signs of easing in 2017 (Table 3). Average debt-equity ratio of firms is significantly higher than median values indicating right skewness in the data. Average debt to equity ratio during the period 2011-17 was 1.5 as against 1.3 during the period 2004-11. | Table 3: Debt-Equity ratio | | Year | All firms | Manufacturing | Construction | Metals | | N | Mean | p50 | N | Mean | p50 | N | Mean | p50 | N | Mean | p50 | | 2004-05 | 2980 | 1.30 | 0.77 | 1940 | 1.41 | 0.91 | 156 | 1.14 | 0.72 | 584 | 1.34 | 0.89 | | 2005-06 | 3166 | 1.30 | 0.81 | 2040 | 1.39 | 0.92 | 160 | 1.24 | 0.81 | 625 | 1.35 | 0.95 | | 2006-07 | 3468 | 1.25 | 0.83 | 2167 | 1.32 | 0.95 | 185 | 1.22 | 0.84 | 673 | 1.37 | 1.02 | | 2007-08 | 3820 | 1.33 | 0.89 | 2343 | 1.40 | 1.01 | 227 | 1.41 | 0.85 | 730 | 1.40 | 1.02 | | 2008-09 | 4088 | 1.34 | 0.87 | 2481 | 1.42 | 0.99 | 261 | 1.35 | 0.80 | 799 | 1.33 | 0.97 | | 2009-10 | 4271 | 1.43 | 0.92 | 2565 | 1.50 | 1.03 | 284 | 1.35 | 0.87 | 846 | 1.38 | 1.01 | | 2010-11 | 4379 | 1.37 | 0.86 | 2607 | 1.44 | 0.96 | 301 | 1.25 | 0.86 | 852 | 1.29 | 0.91 | | 2011-12 | 4350 | 1.38 | 0.85 | 2575 | 1.46 | 0.97 | 295 | 1.18 | 0.79 | 851 | 1.37 | 0.95 | | 2012-13 | 4430 | 1.43 | 0.89 | 2585 | 1.48 | 0.98 | 310 | 1.33 | 0.91 | 860 | 1.43 | 1.02 | | 2013-14 | 4380 | 1.52 | 0.87 | 2570 | 1.53 | 0.96 | 311 | 1.57 | 0.97 | 845 | 1.39 | 0.94 | | 2014-15 | 4307 | 1.51 | 0.87 | 2547 | 1.55 | 0.94 | 302 | 1.50 | 0.91 | 843 | 1.55 | 0.93 | | 2015-16 | 3988 | 1.50 | 0.81 | 2333 | 1.47 | 0.87 | 297 | 1.77 | 0.95 | 770 | 1.47 | 0.90 | | 2016-17 | 3702 | 1.46 | 0.75 | 2191 | 1.43 | 0.81 | 279 | 1.89 | 0.90 | 726 | 1.44 | 0.75 | | 2017-18 | 3025 | 1.32 | 0.67 | 1822 | 1.30 | 0.71 | 237 | 1.74 | 0.78 | 599 | 1.29 | 0.68 | Note: N represents the number of firms and P50 represents the median.
Source: CMIE Prowess data. | In line with the rise in debt-equity ratio, firms witnessed a general deterioration in their debt repayment ability as measured by interest coverage ratio (Table 4). Unlike debt-equity ratio, deterioration in the interest coverage ratio was more pronounced for construction sector firms. In 2017-18, interest coverage ratio of manufacturing and metals sectors witnessed an improvement, while firms in the construction sector did not show signs of improvement. | Table 4: Interest coverage ratio | | Year | All firms | Manufacturing | Construction | Metals | | N | p50 | N | p50 | N | p50 | N | p50 | | 2004-05 | 2853 | 4.54 | 1895 | 4.40 | 144 | 5.18 | 569 | 4.52 | | 2005-06 | 3009 | 5.28 | 1983 | 5.17 | 149 | 5.02 | 604 | 5.28 | | 2006-07 | 3317 | 5.54 | 2120 | 5.37 | 173 | 6.16 | 658 | 5.05 | | 2007-08 | 3649 | 5.33 | 2294 | 5.01 | 216 | 6.00 | 722 | 4.75 | | 2008-09 | 3918 | 4.60 | 2430 | 4.37 | 244 | 5.21 | 786 | 4.60 | | 2009-10 | 4082 | 3.78 | 2507 | 3.74 | 269 | 3.67 | 826 | 3.84 | | 2010-11 | 4188 | 4.30 | 2546 | 4.31 | 284 | 3.94 | 840 | 4.45 | | 2011-12 | 4146 | 4.19 | 2501 | 4.16 | 287 | 4.03 | 830 | 4.02 | | 2012-13 | 4240 | 3.46 | 2519 | 3.46 | 297 | 2.80 | 844 | 3.43 | | 2013-14 | 4187 | 3.31 | 2507 | 3.38 | 299 | 2.48 | 834 | 3.20 | | 2014-15 | 4132 | 3.32 | 2495 | 3.44 | 287 | 2.44 | 833 | 3.13 | | 2015-16 | 3831 | 3.21 | 2287 | 3.38 | 282 | 2.23 | 758 | 3.09 | | 2016-17 | 3558 | 3.57 | 2145 | 3.86 | 262 | 2.01 | 712 | 3.74 | | 2017-18 | 2911 | 4.10 | 1784 | 4.38 | 227 | 2.21 | 583 | 4.30 | Note: N represents the number of firms and P50 represents the median.
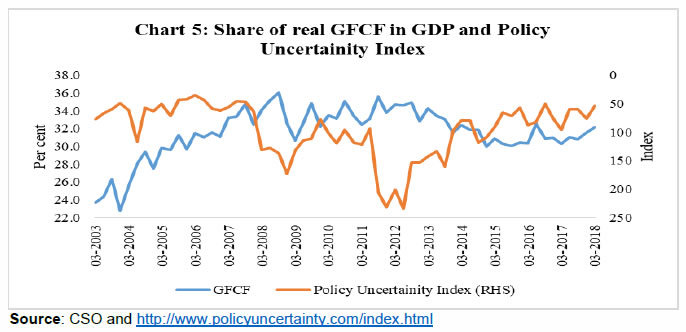
Source: CMIE Prowess data. | In addition to conventional explanations of investment slowdown, the recent literature has pointed to the possible role of heightened economic policy uncertainty in dragging down capital formation in emerging market economies (Bhagat, Ghosh, and Ranjan, 2016; Anand and Tulin, 2014; Krznar and Matheson, 2018). Bhagat, Ghosh, and Ranjan (2016) argue that an increase in policy uncertainty is likely to increase the cost of capital for firms and reduce their expected net cash flows. In order to quantitatively measure economic policy uncertainty in an economy, Baker, Bloom, and Davis4 have developed an index, combining two sets of information relating to economic activity: a) media coverage of key topical issues; and b) degree of disagreement among economic forecasters (Anand and Tulin, 2014). Economic policy uncertainty in India increased sharply after the global financial crisis and again during the mid-2011 till the third quarter of 2013 (Chart 4). Higher policy uncertainty index during the latter period reflected worsening of macroeconomic fundamentals amidst global economic uncertainty. The policy uncertainty index for India subsided in the first quarter of 2014 and remained moderate thereafter. Despite the ebbing of policy uncertainty, growth of capital formation has not revived (Chart 5). Thus, policy uncertainty seems to have only limited explanation for lower investment growth. 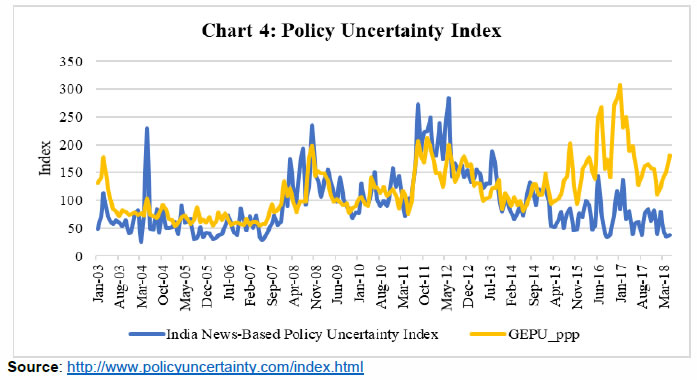
 V. Empirical Results Baseline results: The focus of our study is to analyse the relationship between firms’ leverage and their investment. In order to account for several unobserved factors that may influence investment decision of firms, we estimate fixed effect models, which can control for such omitted variables and provide efficient and unbiased estimates. The Hausman test criterion also indicates that, for the given dataset, fixed effect model is preferable over random effect and pooled cross section models. Accordingly, all regressions in this paper are estimated in a fixed effect panel framework. In Table 5, we report the results of panel regression of investment ratio on leverage in different specifications. In specification (1), (2) and (3), investment ratio is regressed on alternative measures of financial leverage. The results indicate that financial leverage affects firms’ investment negatively. Debt-equity ratio and debt to asset ratio have negative and statistically significant coefficients, while interest coverage ratio has a positive and statistically significant impact on firm’s capital expenditure. In specifications (4), (5) and (6), we introduce firm specific and macroeconomic control variables. We find that the coefficients of leverage (both, debt to equity and debt to asset ratio) continue to show negative sign and coefficient of interest coverage ratio remain positive. The coefficients of firm specific variables were as per expectations, i.e. positive signs for operating sales and profitability. We find that sales growth, profitability, debt growth and price to book ratio have a positive impact on investment ratio. In all specifications, leverage continues to be statistically significant with expected signs. A positive and statistically significant coefficient of price to book ratio suggests that low valuation firms are more adversely affected by financial leverage. Before moving to the testing of robustness of these estimates, we address issues of multicollinearity and heteroscedasticity. Regarding the multicollinearity, the analysis5 suggests that the correlation among variables is generally less than 0.30 and statistically insignificant. Therefore, multicollinearity is not a serious problem in the model. The problem of heteroscedasticity is resolved by using ratios and growth rates instead of level values. Besides that, we have corrected the problem of heteroscedasticity by use of cluster robust standard errors. With a view to examine the relationship between leverage and investment for firms with varying growth opportunities, we use a dummy variable for growth opportunities (equal to 1 if PB is greater than the mean value of PB of all observations in the sample, and 0 otherwise). Regressions using specifications similar to that in Table 5 with the interaction of leverage and dummy of growth opportunity yields a positive and statistically significant coefficient6. This indicates that leverage hurts firms with weaker growth possibilities more than those with stronger growth possibilities. | Table 5: Regression analysis of firm level investment equation | | Dependent Variable: Investment Ratio | | Variable | (1) | (2) | (3) | (4) | (5) | (6) | | Debt equity ratio[-1] | -0.236*** | | | -0.215*** | -0.231*** | -0.442*** | | | (0.049) | | | (0.055) | (0.054) | (0.069) | | ICR[-1] | | 0.011*** | | 0.009*** | 0.010*** | 0.009*** | | | | (0.002) | | (0.002) | (0.002) | (0.002) | | Debt asset ratio[-1] | | | -0.071*** | -0.050*** | -0.050*** | -0.077*** | | | | | (0.011) | (0.013) | (0.013) | (0.016) | | Profit growth | | | | 0.009*** | 0.006*** | 0.006*** | | | | | | (0.001) | (0.001) | (0.001) | | ROA[-1] | | | | 0.007*** | | | | | | | | (0.001) | | | | Growth of debt[-1] | | | | 0.007*** | 0.007*** | 0.008*** | | | | | | (0.001) | (0.001) | (0.001) | | Sales growth[-1] | | | | | 0.030*** | 0.030*** | | | | | | | (0.003) | (0.005) | | Price to book ratio | | | | | | 0.466*** | | | | | | | | (0.083) | | Effective policy rate | | | | -0.821*** | -0.848*** | -0.902*** | | | | | | (0.074) | (0.073) | (0.098) | | India News Policy Uncertainty | | | | 0.032*** | 0.032*** | 0.033*** | | | | | | (0.002) | (0.002) | (0.003) | | Constant | 9.230*** | 9.066*** | 11.084*** | 11.059*** | 10.857*** | 10.864*** | | | (0.323) | (0.313) | (0.476) | (0.604) | (0.598) | (0.775) | | Observations | 48,850 | 46,994 | 48,850 | 46,957 | 46,977 | 25,682 | | R-squared | 0.059 | 0.062 | 0.060 | 0.021 | 0.030 | 0.037 | | Number of firms | 5,762 | 5,662 | 5,762 | 5,659 | 5,661 | 2,850 | | Firm FE | YES | YES | YES | YES | YES | YES | | Year FE | YES | YES | YES | No | No | No | *** p<0.01, ** p<0.05, * p<0.1.
Note: figures in parentheses are cluster robust standard errors. | After establishing the negative relationship between a firm’s leverage and investment for the overall sample, we perform the same test at the sectoral level (Table 6). Investment behaviour of firms may display sectoral heterogeneity due to sector specific technical necessities, hence, it is crucial to control for sectoral variations. Accordingly, we perform separate regressions for firms in manufacturing, construction and metals sectors. These sectors have a high share in overall corporate investment. This also offers an opportunity to remove the effects of low leveraged sectors, viz., IT and pharma, from the sample. The results by and large remain unchanged. Regression results of all firms and sector specific firms show a negative relationship between firms’ leverage and their investment. If these results are juxtaposed with the increase in leverage amongst non-financial firms in India during the sample period, then it may be inferred that a rise in leverage might have adversely affected the capital formation by corporates. Sector specific results are noteworthy from perspective of leverage concentration in certain key sectors. These results also show that even if low leverage firms are dropped from the sample, our results hold. | Table 6: Sector-wise regression of basic investment equation | | Dependent variable: Investment ratio | | Variable | Manufacturing | Construction | Metals | | Debt equity ratio[-1] | -0.385*** | -0.924*** | -0.508*** | | | (0.073) | (0.329) | (0.124) | | ICR[-1] | 0.010*** | 0.000 | 0.007 | | | (0.003) | (0.010) | (0.007) | | Debt asset ratio[-1] | -0.064*** | -0.194** | -0.041 | | | (0.017) | (0.095) | (0.027) | | Profit growth[-1] | 0.001 | 0.011** | 0.004* | | | (0.001) | (0.005) | (0.002) | | Sales growth[-1] | 0.039*** | 0.018*** | 0.061*** | | | (0.011) | (0.004) | (0.011) | | Debt growth[-1] | 0.009*** | 0.010*** | 0.010*** | | | (0.001) | (0.003) | (0.002) | | Price book ratio[-1] | 0.180** | 1.851*** | 0.095 | | | (0.087) | (0.399) | (0.142) | | Effective policy rate | -0.733*** | -1.754*** | -0.868*** | | | (0.104) | (0.591) | (0.176) | | India News Policy Uncertainty | 0.024*** | 0.103*** | 0.022*** | | | (0.003) | (0.018) | (0.006) | | Constant | 11.846*** | 7.755* | 13.421*** | | | (0.822) | (4.401) | (1.400) | | Observations | 17,060 | 1,735 | 5,687 | | R-squared | 0.035 | 0.077 | 0.048 | | Number of firm | 1,768 | 192 | 587 | | Firm FE | YES | YES | YES | | Year FE | No | NO | NO | *** p<0.01, ** p<0.05, * p<0.1.
Note: Figures in parentheses are cluster robust standard errors. | Robustness test Although we have used one-year lagged values of explanatory variables to avoid the problem of endogeneity, there is still a possibility that a rise in investment may lead to leverage. Therefore, as a robustness check, we run the same regression in a dynamic Arellano-Bond panel regression framework (Bond, 1991) that addresses the problem of potential endogeneity in the model. The results confirm the dominant negative influence of leverage in determining fixed investment, while sales growth, operating profit and market price to book value positively affect investment (Table 7). | Table 7: Regression results – Impact of leverage over firms’ capital expenditure | | Dependent variable: Investment ratio | | Variable | All firms | Manufacturing | Construction | Metals | | Investment ratio[-1] | 0.153*** | 0.133*** | 0.176*** | 0.111*** | | | (0.010) | (0.011) | (0.037) | (0.017) | | Debt equity ratio[-1] | -0.247*** | -0.327*** | -0.047 | -0.422* | | | (0.084) | (0.104) | (0.335) | (0.235) | | ICR[-1] | 0.009*** | 0.013*** | 0.006 | 0.011 | | | (0.003) | (0.004) | (0.020) | (0.009) | | Debt asset ratio[-1] | -0.149*** | -0.090*** | -0.321*** | -0.105** | | | (0.026) | (0.028) | (0.112) | (0.047) | | Growth of profit[-1] | 0.005*** | 0.005*** | 0.015*** | 0.010*** | | | (0.001) | (0.001) | (0.004) | (0.002) | | RoA[-1] | 0.001* | 0.001 | 0.006 | 0.003** | | | (0.001) | (0.001) | (0.004) | (0.002) | | Growth of debt outstanding | 0.001 | 0.002 | 0.005* | 0.003 | | | (0.001) | (0.001) | (0.003) | (0.002) | | Effective Policy Rate | -0.105 | -0.107 | -0.466 | -0.194 | | | (0.090) | (0.098) | (0.490) | (0.172) | | India News Policy Uncertainty | 0.012*** | 0.012*** | 0.040*** | 0.010* | | | (0.003) | (0.003) | (0.015) | (0.006) | | Constant | 10.884*** | 10.015*** | 12.879*** | 12.492*** | | | (0.977) | (1.109) | (4.510) | (1.844) | | Observations | 37,346 | 23,412 | 2,481 | 7,631 | | Number of firms | 5,370 | 3,162 | 365 | 1,032 | | Wald chi2 (9) | 396.7 | 278 | 108.1 | 114.1 | | Prob > chi2 | 0 | 0 | 0 | 0 | *** p<0.01, ** p<0.05, * p<0.1.
Note: Figures in parentheses are cluster robust standard errors. | Non-linearity In this section, we explore the possibility of a non-linear relationship between investment and leverage. The method for establishing a non-linear relationship in Hernando and Martı ́nez-Carrascal (2008) is somewhat arbitrary, where cut off points are decided exogenously. Therefore, Gebauer, Setzer, and Westphal, 2018 use a panel threshold model for estimating cut offs of debt non-linearity. Panel threshold models are data intensive and highly restrictive, as they can be tested only for balanced panel data. Therefore, we preferred to analyse quadratic or cubic functions for testing of non-linearity. Based on results of quadratic and cubic regressions, we define a threshold of leverage at a lower level and higher level. The following quadratic and cubic functions were estimated. 
 The estimation of quadratic function did not yield meaningful results for any of the three measures of leverage, therefore, suggesting that the relationship between leverage and capital expenditure may not of the quadratic form (Table 8). The results of cubic regression were, however, on the expected lines for debt to equity ratio and interest coverage ratio, suggesting a non-linear relationship between leverage and capital expenditure. Specifically, it suggests that leverage at lower levels does not affect investment adversely. | Table 8: Regression results in quadratic and cubic functional forms | | Dependent Variable: Investment Ratio | | Variable | (1) | (2) | (3) | (4) | (5) | (6) | | Debt equity ratio [-1] | -0.518*** | -1.236*** | | | | | | | (0.117) | (0.176) | | | | | | DE^2 | 0.008** | 0.072*** | | | | | | | (0.004) | (0.011) | | | | | | DE^3 | | -0.001*** | | | | | | | | (0.000) | | | | | | ICR [-1] | | | 0.042*** | 0.114*** | | | | | | | (0.005) | (0.009) | | | | ICR square | | | -0.000*** | -0.000*** | | | | | | | (0.000) | (0.000) | | | | ICR cube | | | | 0.000*** | | | | | | | | (0.000) | | | | Debt asset ratio [-1] | | | | | -0.053* | 0.067 | | | | | | | (0.031) | (0.061) | | DA^2 | | | | | -0.000 | -0.004** | | | | | | | (0.000) | (0.002) | | DA^3 | | | | | | 0.000** | | | | | | | | (0.000) | | Constant | 8.690*** | 9.366*** | 7.506*** | 6.896*** | 9.623*** | 8.921*** | | | (0.149) | (0.198) | (0.076) | (0.095) | (0.505) | (0.597) | | Observations | 48,850 | 48,850 | 46,994 | 46,994 | 48,850 | 48,850 | | R-squared | 0.001 | 0.002 | 0.003 | 0.006 | 0.001 | 0.001 | | Number of firms | 5,762 | 5,762 | 5,662 | 5,662 | 5,762 | 5,762 | | Firm FE | YES | YES | YES | YES | YES | YES | | Year FE | No | No | No | No | No | No | *** p<0.01, ** p<0.05, * p<0.1.
Note: Figures in parentheses are cluster robust standard errors. | Having established a non-linear cubic relationship between financial leverage and firm’s investment, we further attempt to determine the shape of the function. For this, we created year-wise dummies of deciles of debt-equity ratios. Further, these dummy variables were interacted with debt-equity ratio variables [DE Ratio Deciles (1, 2, ..11)]. Thus, we got ten interaction variables. We regressed investment ratio on these interaction variables along with relevant controls. The results confirm the presence of a non-linear cubic relationship between financial leverage and firm’s investment (Table 9). We find that at lower levels, rise in leverage has a positive impact on physical investment by firms (firm below fifth decile of leverage). Its impact is negligible around median levels and highly negative at upper levels (i.e., firms in eighth decile and above). | Table 9: Alternative test of non-linearity of relationship between leverage and investment | | Dependent Variable: Investment Ratio | | Variable | (1) | (2) | (3) | (4) | | DE Ratio Decile 2 | 3.119* | 10.705*** | 4.782** | 4.909** | | | (1.839) | (1.947) | (1.919) | (1.917) | | DE Ratio Decile 3 | 1.298 | 7.472*** | 2.801** | 2.872** | | | (1.070) | (1.134) | (1.133) | (1.132) | | DE Ratio Decile 4 | 0.170 | 4.774*** | 1.169 | 1.221 | | | (0.695) | (0.742) | (0.755) | (0.754) | | DE Ratio Decile 5 | 0.591 | 4.179*** | 1.204** | 1.233** | | | (0.519) | (0.558) | (0.591) | (0.590) | | DE Ratio Decile 6 | -0.305 | 2.347*** | -0.033 | -0.020 | | | (0.387) | (0.418) | (0.460) | (0.459) | | DE Ratio Decile 7 | -0.569* | 1.461*** | -0.434 | -0.428 | | | (0.303) | (0.328) | (0.381) | (0.380) | | DE Ratio Decile 8 | -0.706*** | 0.800*** | -0.697** | -0.696** | | | (0.234) | (0.252) | (0.309) | (0.308) | | DE Ratio Decile 9 | -0.818*** | 0.176 | -0.882*** | -0.884*** | | | (0.167) | (0.180) | (0.232) | (0.231) | | DE Ratio Decile 10 | -0.756*** | -0.268*** | -0.827*** | -0.829*** | | | (0.092) | (0.099) | (0.131) | (0.130) | | ICR[-1] | | 0.108*** | 0.093*** | 0.094*** | | | | (0.006) | (0.006) | (0.006) | | Debt asset ratio [-1] | | | -0.006 | -0.005 | | | | | (0.012) | (0.012) | | Growth of profit [-1] | | | 0.025*** | 0.025*** | | | | | (0.001) | (0.001) | | Growth of debt [-1] | | | 0.034*** | 0.033*** | | | | | (0.001) | (0.001) | | Effective policy rate | | | | -0.321*** | | | | | | (0.047) | | Constant | 9.862*** | 6.531*** | 7.630*** | 9.648*** | | | (0.269) | (0.335) | (0.383) | (0.487) | | Observations | 48,850 | 46,994 | 46,977 | 46,977 | | R-squared | 0.004 | 0.017 | 0.063 | 0.064 | | Number of firms | 5,762 | 5,662 | 5,661 | 5,661 | | Firm FE | YES | YES | YES | YES | | Year FE | Yes | Yes | Yes | Yes | *** p<0.01, ** p<0.05, * p<0.1.
Note: Figures in parentheses are robust standard errors. | VI. Conclusion and Way Forward This paper examined the impact of firm’s leverage on corporate investment in India. The findings of the paper suggested that the high leverage of firms has an adverse impact on their capital expenditure. Also, the relationship between leverage and firm’s investment was found to be non-linear. Leverage at higher level affects investment decisions much more adversely, particularly for firms with lower investment opportunities. Leverage may affect a firm’s investment behaviour in multiple ways. It constrains firm’s capacity to mobilize external resources for financing new projects. It may discourage shareholders from supporting higher capital expenditure through increased borrowings, as in a scenario of high leverage, major gains from investment may accrue to debtholders (Krznar and Matheson, 2018). We also find that firms increase their leverage during high economic growth phase, banking on the durability of such high growth. The findings of the paper suggest that the initiatives to clean up balance sheets of banks and deleveraging by non-financial corporates should help in the revival of investment cycle.
References Aivazian, V., Ge, Y., and Qiu, J. (2005). The impact of leverage on firm investment: Canadian evidence. Journal of Corporate Finance, 11, 277–291. Anand, R., and Tulin, V. (2014). Disentangling India's investment slowdown. IMF Working Paper, WP/14/17, 1-17. Bhagat, S., Ghosh, P., and Ranjan, S. (2016). Economic policy uncertainty and growth in India. Economic and Political Weekly, LI(35), 72-81. Bond, M. A. (1991). Some Tests of Specification for Panel Data: Monte Carlo Evidence and an Application to Employment Equations. Review of Economic Studies, 277-297. Chhibber, A., and Kalloor, A. (2016). Reviving Private Investment in India: Determinants and Policy Levers. NIPFP Working paper series, Working Paper No. 181. Retrieved from http://www.nipfp.org.in/publications/working-papers/1770/ Gebauer, S., Setzer, R., and Westphal, A. (2018). Corporate debt and investment: A firm-level analysis for stressed euro area countries. Journal of International Money and Finance, 86, 112 -130. GoI. (2017). The festering twin balance sheet problem. Economic Survey, 2016-17: 82-104, Government of India. Hernando, I., and Martı ́nez-Carrascal, C. (2008). The impact of financial variables on firms’ real decisions: Evidence from Spanish firm-level data. Journal of Macroeconomics, 30, 543-561. Jensen, M. C., and Meckling, W. H. (1976). Theory of the Firm: Managerial Behavior, Agency Costs and Ownership Structure. Journal of Financial Economics, 3(4), 305-360. Kose, M. A., Ohnsorge, F., Ye, L. S., and Islamaj, E. (2017). Weakness in Investment Growth: Causes, Implications and Policy Responses. World Bank Policy Research Working Paper, 7990. Krznar, I., and Matheson, T. (2018). Investment in Brazil: From Crisis to Recovery. IMF Working Paper, WP/18/6, 1-16. Meyers, S. C. (1977). Determinants of Corporate Borrowing. Journal of Financial Economics. Modigliani, F., and Miller, M. (1958). The Cost of Capital, Corporation Finance and the Theory of Investment. The American Economic Review, 48(3), 261 - 297. Myers, S., and Majluf, N. (1984). Corporate financing and investment decisions when firms have information that investors do not have. Journal of Financial Economics, 13(2), 187-221. Nagaraj, R. (2013, May 18). India's Dream Run, 2003-08: Understanding the Boom and its Aftermath. Economic and Political Weekly, XLVIII(20), 39-51. Pattanaik, S., Behera, H., Kavediya, R., Das, A., Joshi, H., and Shrivastava, A. K. (2013). Real Interest Rate impact on Investment and Growth – What the Empirical Evidence for India Suggests? Retrieved on July 11, 2018, from rbi.org.in: https://rbidocs.rbi.org.in/rdocs/Publications/PDFs/IDGSR08082013.pdf Rajan, R. G., and Zingales, L. (1995). What do we know about capital structure? Some evidence from international data. The Journal of Finance, L(5), 1421 - 1460. RBI. (2018). Monetary Policy Report, October 2018, Reserve Bank of India. RBI. (2019). Annual Report 2018-19. Reserve Bank of India. The Economist. (2011, December 31). Infrastructure in India: Infrastruggles. The Economist. Retrieved on July 11, 2018, from https://www.economist.com/business/2011/12/31/infrastruggles. |