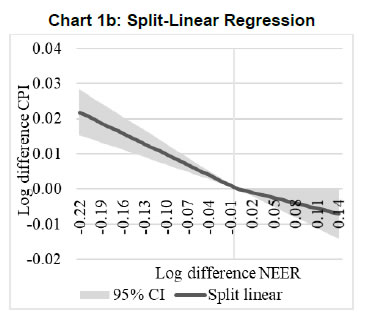
Press Release RBI Working Paper Series No. 01 Exchange Rate Pass-through in Emerging Economies @Michael Debabrata Patra, Jeevan Kumar Khundrakpam and Joice John Abstract 1This paper provides updated estimates of exchange rate pass through (ERPT) for 17 emerging market economies (EMEs) that constitute around 75 per cent of total EME output. These estimates are robust with respect to methodological biases encountered in the literature. Average ERPT to consumer inflation has declined in the years following the global financial crisis. Moreover, ERPT is asymmetric – larger for deprecation than for appreciation; and non-linear – size does matter. We find evidence of cross-country and temporal heterogeneity in ERPT. JEL classification: C32, E42, F31, F33 Key words: Exchange rate pass-through Introduction By the turn of the century, two influential forces – the Taylor hypothesis (Taylor, 2000), and new open economy macroeconomic (NOEM) models (Obstfeld and Rogoff, 2000) - were lifting the concept of exchange rate pass-through (ERPT) to domestic prices out of its microeconomic origins and mainstreaming it into the formulation of monetary policy2. The NOEM models incorporated wage and price stickiness into fully specified general equilibrium frameworks to investigate the expenditure switching role of the exchange rate under different price setting assumptions. The Taylor hypothesis, derived from using sticky pricing in a new Keynesian model, emphasised the role of expectations. Both investigated the empirical puzzle of delayed and incomplete ERPT. The narrative around the former points to firms’ strategic responses to import prices, local non-traded costs in the destination market (Burnstein, et al., 2007) and high degree of trade integration brought about by multinational firms (Obstfeld and Rogoff, 2000) as underlying factors. The Taylor hypothesis, on the other hand, suggests that credibility in monetary policy frameworks has stabilised expectations and sustained low inflation which, in turn, has reduced exchange rate pass-through - ERPT is endogenous to the conduct of monetary policy. Almost in parallel, the empirical literature began broadening its focus to include and even tilt towards examining ERPT in an emerging market economy (EME) context. High volatility in exchange rates and persisting trade imbalances facing EMEs catalysed this shift in interest (Aron, et al., 2014a). The empirical literature has spawned a wide range of ERPT estimates and a variety of methodologies. By and large, it has coalesced to the view that ERPT is low in advanced economies since the global financial crisis (GFC) of 2008, and higher but declining in EMEs. This is attributed to pricing strategies3, variations in mark-ups and/or marginal costs4, price and other rigidities as cited earlier, the stage of the business cycle, exchange rate volatility, and monetary policy reactions and feedbacks5, all of which generate deviations from the law of one price. As this strand in the literature has gained depth and sophistication, it has also turned to addressing non-linearities in ERPT arising out of asymmetric responses of prices to exchange rate movements, both to size – a large exchange rate change could produce a stronger or weaker pass-through to domestic prices than a smaller one – and to direction – depreciation may cause higher or lower ERPT than appreciations (Bussiere, 2013; Pollard and Coughlin, 2003; Patra et al., 2018, Rincón and Rodríguez-Niño, 2018; Caselli and Roitman, 2019). It has also investigated time-varying properties of ERPT – could ERPT be in secular decline? – as a special type of non-linearity (Gagnon and Ihrig, 2004; Marazzi and Sheets, 2007; Patra et al., 2018). In this paper, we explore the evolution of ERPT with a focus on select EMEs that may be showcasing (a la Taylor, 2000) the triumph of inflation targeting over the ‘fear of floating’ (Calvo and Reinhart, 2000; 2002). The estimation of ERPT is carried out for the period Q1:2005 to Q2:2016. We have chosen 17 systemic EMEs6, including India, to be as representative of the EME world as feasible, given the constraint of data availability. They together account for close to 75 per cent of EME gross domestic product (GDP), nearly a quarter of world output and 30 per cent of world exports. By and large, the countries in our sample are inflation targeters/ anchors, the exception being China which has, however, successfully maintained low and stable inflation. The contribution of this paper to the burgeoning ERPT literature, albeit modest, is three-fold. First, it provides updated ERPT estimates for ‘systemic’ EMEs that accord primacy to inflation as the goal of monetary policy while maintaining reasonably flexible exchange rate regimes. Second, it seeks to correct for ‘blind spots’ misspecifications in most cross-country studies – that arise from (1) neglect of long-run dynamics (Delatte and Lopez-Villavicencio, 2012; Aron, et al., 2014c); (2) potential endogeneity of explanatory variables, notably the exchange rate; and (3) assumption of linear ERPT (Jasova et al., 2016; Bussiere, 2013; Cheikh and Rault, 2015) in spite of the presence of sticky prices and menu costs. Third, given that multi-country studies largely ignore the country heterogeneity (except in country fixed effects) (an exception is Barhoumi, 2006), we introduce different levels of heterogeneity – pre-GFC and post-GFC experiences; commodity exporters versus commodity importers – under a unified framework. The mission of the paper is to produce reliable assessments of ERPT for monetary policy authorities who wield this parameter and for whom precision is key. Briefly summarising our results, we find that the average ERPT has declined in the post-GFC period to a range of 9-15 per cent. This is at variance with the wide diversity reported in the literature – from 9 to 50 per cent for EMEs (Aron, et al., 2014c). ERPT is found to be asymmetric - significantly larger for depreciations than for appreciations. Pre-GFC period is characterised by higher ERPTs, while ERPT turns out to be lower in the post-GFC period. Net exporting EMEs seem to passthrough large depreciations faster and fuller than net importers. The remainder of the paper is organised into four sections. Section II draws lessons from a brief tour of the literature on the pros and cons of a multi-country panel estimation framework for measuring ERPT and the methodological and specification refinements errors that are required to free ERPT estimates of biases. Section III sets out the methodological framework, data, country sample and period of study. Section IV presents the results and the main implications therefrom for the conduct of monetary policy. Section V concludes the paper. II. Lessons from the Literature A recent comprehensive survey of the now proliferating empirical research on the subject categorises and compares the diverse methodologies used to extract ERPT, highlighting the frequent misspecifications in empirical applications (Aron et al., 2014c)7. Of the 13 studies of 2000s vintage surveyed therein, more than half (seven) employed multi-country panel frameworks. All of them either focused exclusively on emerging and developing economies or included them in their samples, often outnumbering the advanced economies in them. We would add to this list another recent work for its large country sample and for confirming low and stable ERPT in advanced economies and recently declining ERPT in EMEs (Jasova et al., 2016). A key motivation for adopting panel estimation frameworks appears to have been the limitations of data availability for EMEs. Pooling information across countries allows degrees of freedom for investigating long-run relationships and asymmetries, but with due safeguards against structural breaks that can bias ERPT estimates. Yet another driver of the choice of panel methodologies is to take advantage of cross-country variations while simultaneously reducing the bias introduced by exchange rate regime changes that are replete in the EME history (Frankel and Rose, 1996). Several methodological issues are encountered in multi-country panels which need to be addressed to obtain unbiased estimates of ERPT. First, a common source of bias in some multi-country panels is tight bivariate specifications such as between exchange rates and prices when in fact, a multivariate relationship could exist that inter alia includes demand conditions at home and abroad, domestic costs and foreign prices. In the literature, a partial equilibrium micro-founded mark-up equation (Campa and Goldberg, 2005) has evolved as the preferred framework for estimating ERPT. More recent efforts have sought to generalise and extend the standard model by introducing domestic costs into mark-ups and international commodity prices into exporters’ marginal costs (Aron et al., 2014b). Second, long-run relationships among domestic prices, domestic demand, external costs and commodity prices need to be tested for and if present error correction term needs to be explicitly included in the short-run dynamics while estimating ERPT. Otherwise, this will lead to misspecification of the model and will bias the reported pass-through measures (Aron et al., 2014b). Third, – and this is critical from our point of view in guiding the choice of estimation technique – is the need to take account of the potential endogeneity of the exchange rate. This is particularly relevant when, for instance, monetary policy is fighting inflation. An exchange rate shock can be offset by an interest rate adjustment that eventually reduces the inflationary impact of the initial shock (Aron et al., 2014a). The Arellano Bond8 dynamic panel generalised method of moments (GMM) is particularly appealing in such situations – the endogenous variable is treated similarly to the lagged independent variable i.e., lagged values of the endogenous variable are used as instruments for their respective differenced values. Under purchasing power parity illustratively, relative price levels determine the exchange rate. There could thus be two-way causality between exchange rate changes and inflation. An important issue in the application of GMM estimators is that it will suffer from large finite-sample bias if the instruments are weak. Consequently, it is prudent to acknowledge this potential drawback and seek robustness checks through other estimation techniques such as pool-mean group (PMG) estimators and mean group (MG) estimators (Barhoumi, 2006). Fourth, asymmetry and non-linearity can be critical when estimating ERPT. On one hand, menu cost theory suggests that larger exchange rate movements have a larger effect on consumer prices than small ones (Goldberg and Hellerstein, 2008). On the other hand, if local currency pricing (LCP) is dominant and the large exchange rate changes, especially depreciation, are expected to be short lived, these changes are less likely to be passed on to consumers for fear of losing market share. In the literature, asymmetry is tested by introducing slope dummies and estimating split linear regressions (Pollard and Coughlin, 2004; Khundrakpam, 2007). Non-linearity is also examined by introducing quadratic and cubic terms of changes in exchange rates into short run dynamics (Jasova et al., 2016). Fifth, panel studies force ERPT to be homogenous across the sample, but this is rejected by the data (Barhoumi, 2006). Consequently, policy conclusions for individual countries are unreliable (Jasova, et al., 2016; Patra, et al., 2018). There is considerable heterogeneity in the EME country experience arising from different levels of development, openness (including trade regimes and trade patterns – net commodity exporters versus net commodity importers, to cite one), monetary policy frameworks and stances and inflation histories. Further, heterogeneity can also occur across time with structural breaks like GFC causing ERPT to behave differently from a priori expectations. III. Methodology Our methodological framework derives from the partial equilibrium micro-founded mark-up over marginal cost equation (Campa and Goldberg, 2005), which has been generalised and extended (Aron, et al., 2014a) to become the gold standard in the ERPT literature. Accordingly, ERPT is first specified with respect to import prices (Pm) in the importing country defined as the transformation of prices (Pf) of the exporting country by applying the exchange rate (E) (foreign currency per unit of domestic currency): The marginal cost of the exporter increases with labour cost (cf) in the exporting country and demand in the importing country (yd), with t representing time. Also, p = logarithm of consumer prices; e = logarithm of exchange rate; c = logarithm of cost variable; y = logarithm of income (demand) and superscripts d and f are domestic and foreign country, respectively. III.1. ERPT: Linear In the tradition referred to earlier, equation (7) is estimated in first differences, with the addition of lagged terms of the explanatory variables to allow for the possibility of gradual adjustment of prices to exchange rates and other domestic and foreign factors. 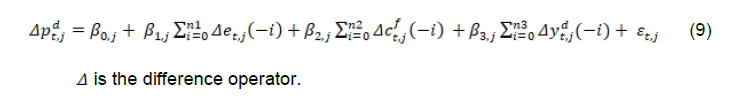 The lag lengths of all control variables are selected by the general-to-specific method - Hendry’s methodology (Gilbert, 1989). Only the statistically significant lags are considered, and insignificant ones are progressively removed from a maximum lag length of 4 (since we are dealing with quarterly data). An exogenous element of costs facing the exporter and arising explicitly from commodity prices is modelled by introducing crude oil prices in equation (9) a la Aron et al. (2014a). Also, we introduce the lagged dependent variable in equation (9) to capture intrinsic persistence in inflation. In order to avoid any dynamic interaction of the exchange rate with the lagged dependent term, the lag of the dependent variable is equal to one lag more than those for the exchange rate terms that are included. i.e. where pc = commodity prices (crude oil) - the logarithm of the seasonally adjusted price of West Texas Intermediate (WTI) crude. Equation (10), however, suffers from some common mis-specification issues that are found while estimating ERPT. In order to obtain robust estimates of ERPT, the potential causes of misspecifications should be addressed while formulating the underlying model. A common misspecification in single equation models is the omission of possible long-run relationships. If co-integration between long-run level variables exists, not accounting for the error correction mechanism in the short-run relationship is a misspecification which will bias the ERPT estimate. Therefore, it is desirable to account for the short-run dynamic adjustment to deviations from equilibrium by introducing an error correction (ec) term. The presence or otherwise of a co-integrating relationship in equation (8) is investigated by using Pedroni's panel co-integration tests9. The short-run equation incorporating ec is estimated using pool-mean group (PMG) estimators (Pesaran et al., 1999) in equation (11) and mean group (MG) estimator (Pesaran and Smith, 1995) in equation (12). PMG estimator: As in the case of the lagged dependent variable, the error correction term is introduced with a lag equal to one lag more than those for the exchange rate terms. The PMG estimator assumes ERPT to be heterogeneous in the short run. Therefore, βs may differ for different countries, but in the long run, they are homogenous i.e., αs are identical across countries. The MG estimator is less restrictive and allows the coefficients to vary from country to country even in the long-run. The Hausman test is employed to evaluate whether or not the long-run slope homogeneity condition holds i.e., whether it is the PMG or the MG estimator that fits the data better. As highlighted in Section II, another common misspecification while estimating ERPT is ignoring the potential endogeneity of the exchange rate. In order to deal with situations in which both endogeneity and omission of ec have to be accounted for, we employ Dynamic Ordinary Least Squares - Arellano Bond regressions (DOLS-AB hereafter) to estimate ERPT – DOLS10 for the long-run, and Arellano-Bond (AB) method of GMM for the short-run (Arellano and Bond, 1991). In the short run equation, we treat both domestic variables i.e., domestic demand and the exchange rate to be endogenous because in an anti-inflationary monetary policy stance, it is likely that the impact of an exchange rate shock on inflation will be partly offset by an interest rate adjustment working through the demand channel. Equation (13) and (14) together form the system of equations which correct for both endogeneity and omission of error correction mechanism. The DOLS estimator (Kao and Chiang, 2000) can be represented as: The Arellano-Bond regression takes the following functional form: III.2. ERPT: Asymmetry and Non-linearity There can be significant differences in ERPT between appreciations and depreciations, depending upon the type of constraints that exporting firms face. According to the binding quantity constraints hypothesis, ERPT can be higher for depreciations than appreciations (Pollard and Coughlin, 2004). When exporting firms face capacity constraints, they cannot increase sales in importing countries by lowering prices. Thus, when an importing country’s currency appreciates, foreign exporting firms keep import prices constant while raising mark-ups and the profit margin. In the case of depreciation by contrast, the same capacity constraint is not binding, and foreign firms can increase import prices, despite absorbing part of the impact through reduction in mark-ups (Pollard and Coughlin, 2004). On the other hand, the market share objective and production switching hypotheses postulate that the ERPT would be higher for appreciation than depreciation. When the objective of foreign exporting firms is that of increasing market share in importing countries, appreciation of the importing country’s currency enables them to reduce import prices while maintaining mark-ups. In the event of a depreciation, however, foreign firms offset the increase in prices through reduction in mark-ups and do not allow the import price to increase for fear of losing market share (Knetter, 1994). Similarly, when foreign firms can switch between imported and domestically produced inputs, depreciation in the importing country’s currency leads to the use of domestic inputs and there is no ERPT. In the case of appreciation, however, foreign firms will likely use only domestically produced inputs, and ERPT is determined by the adjustment in the mark-up (Webber, 2000). Following the guideposts in the literature (Pollard and Coughlin, 2004; Khundrakpam, 2007), we define two dummies for appreciation and depreciation as, The Arellano-Bond regression can be modified to incorporate asymmetries as in equation (15) Furthermore, following Jasova et al., (2016) a non-linear functional form including quadratic and cubic functions of changes in exchange rates are used in the short-run dynamics as in equation (16) III.3. ERPT: Heterogeneity Heterogeneity in the ERPT estimates can either emanate from temporal variations and/or from cross-sectional differences or country specific characteristics. In our sample one possible temporal variation in ERPT could have originated from the occurrence of GFC. The literature observes a secular fall in ERPT in EMEs in the post-GFC period. This has been ascribed to an ultra-low inflation environment. (Lopz-Villavicencio and Mignon, 2016 and Jasova et al., 2016). In order to capture any significant change in inflation dynamics in the post-GFC period, equation (15) is estimated separately for the periods Q1:2005 to Q4:2008 (pre-GFC) and Q1:2009 to Q2:2016 (post-GFC). Non-linearities in the pre- and post-GFC periods are also evaluated by estimating equation (16) separately for each sub-period. On the other hand, country specific heterogeneity may arise from the nature of trading country - commodity exporters versus commodity importers (Barhoumi, 2006). Equations (15) and (16) are estimated separately for each of these groups for the period Q1:2005 to Q2:2016. IV. Results At the outset, the existence of cointegration is tested by using Pedroni's panel co-integration tests (Table 1). It is seen that the null of no co-integration is rejected by majority of the tests. By contrast, the null cannot be comprehensively rejected if the domestic demand variable is excluded in equation (8). Thus, domestic prices, external costs and commodity prices are co-integrated. Hence, the error correction term obtained from this set of variables is included in the short-term equation (Table 2). 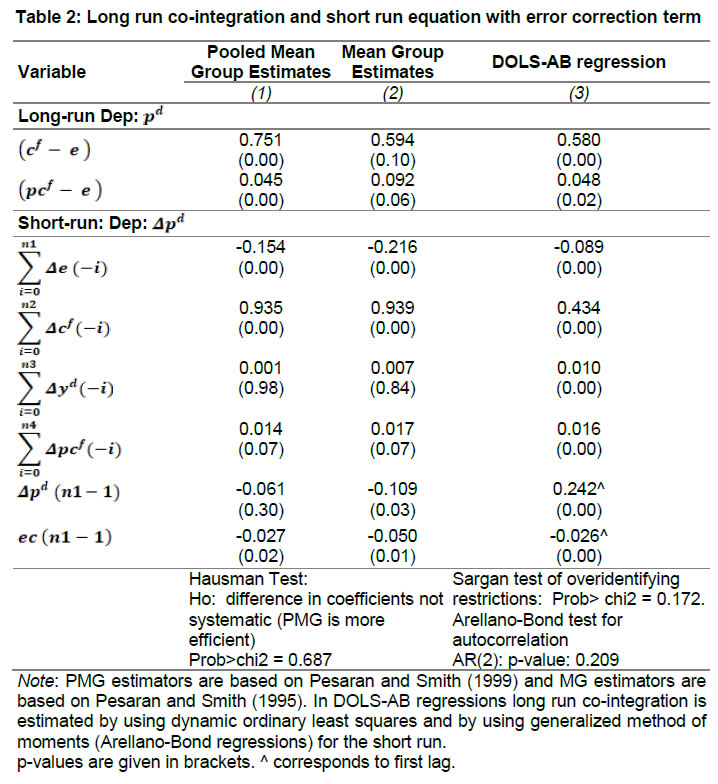 The Hausman test suggests that PMG estimator should be preferred over MG estimator, i.e., even though there could be short-run heterogeneity among EMEs, the slope homogeneity condition holds in the long-run. The PMG estimate (which controls for bias due to the omission of long-run convergence) shows that short-term ERPT is 15.4 per cent (we ignore ERPT of 21 per cent estimated by MG). The estimate of ERPT by the DOLS-AB method, which controls for both endogeneity and error correction, is lower at about 9 per cent. While external cost and commodity prices are significant in all models, domestic demand is significant only after controlling for endogeneity and inclusion of the error correction term, underscoring the importance of the appropriate estimation method. IV.2 Asymmetric ERPT Now, we turn to the estimation of asymmetricity in ERPT with two alternative approaches. In the first approach, a polynomial function (non-linear) which allows the gradient to change at different levels of exchange rate changes is considered. Specifically, we use a quartic function of exchange rate changes to capture asymmetry. The second approach is the standard one in which the ERPTs from appreciation and depreciation are assumed different and estimated through a split linear regression (Table 3). Both approaches use DOLS-AB regression. 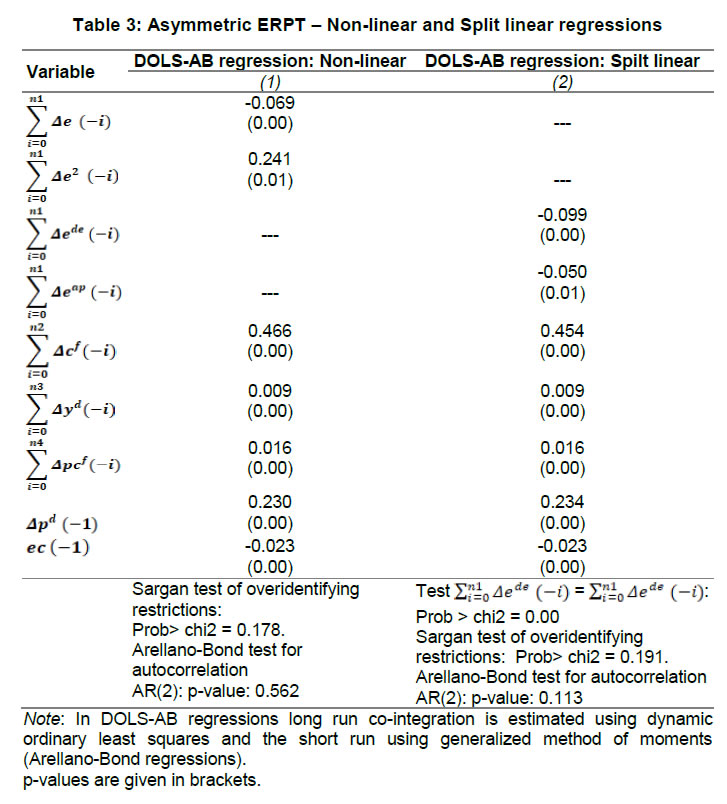 The quadratic term in the non-linear regression is positive and significant, implying an asymmetric response of inflation to exchange rate changes. The quadratic curve estimated using non-linear regression suggests a steepening of the slope when a currency depreciates, indicating that ERPT is higher for depreciation than appreciation (Chart 1a). A polynomial curve is not suitable for providing an average estimate for ERPT separately under appreciation and depreciation. Therefore, we re-estimated the equation by replacing the polynomial terms with separate exchange rate terms for appreciation and depreciation. The estimated results suggest that ERPT for deprecation is about 10 per cent and for appreciation it is around 5 per cent (Chart 1b). Our finding of higher ERPT for depreciation relative to appreciation contrasts with earlier work (Jasova, et al., 2016) which obtained no evidence of these asymmetries; however, the latter uses a longer sample period with more weight on the past and without correcting for omission of error correction term, as we do. 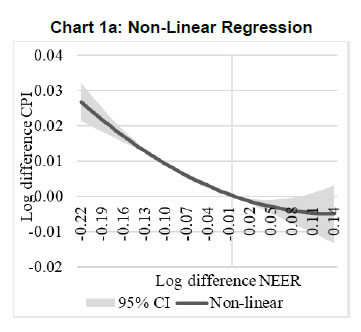
 IV.3 Temporal Heterogeneity in ERPT The GFC imparted a structural shock to the global economy, either altering its underlying characteristics or accentuating fundamental shifts that were already underway. In this regard, attention has been drawn to historically large movements in the relative prices of major currencies caused by the GFC (Leigh et al., 2016). In turn, empirical interest has been revived in the re-assessment of ERPT under variations in transmission channels and structural breaks which are improbable to be accounted for by coefficients relevant for the full period (Jasova, et al., 2016; Cheikh and Rault, 2015; Patra et al., 2018). This is particularly relevant in the context of the highly turbulent financial markets in response to policy actions like quantitative easing as well as geo-political developments. Moreover, several EMEs became captive to enormous movements in risk-driven capital flows, and exchange rate volatility increased on a scale not seen in the pre-GFC years. Accordingly, the sample period is divided into two sub-periods: the pre-crisis period – from Q1:2005 to Q4:2008 coinciding with the years preceding the GFC and up to its outbreak; and the post-GFC period – from Q1:2009 to Q2:2016. ERPT is estimated for each of these sub-sample periods by applying both linear and non-linear approaches in the AB-DOLS framework set out in equations 14 and 16, respectively (Table 4). The results offer interesting variations between the two sub-periods. In terms of linear estimates, ERPT has declined to 8.7 per cent in the post-GFC period from 11.8 per cent in the years preceding the GFC, confirming recent evidence in the literature (Jasova, et al., 2016). The linear estimates, however, mask some interesting insights. In the pre-GFC period, estimates of non-linear ERPT suggest that the cubic term is positive though insignificant, indicating that ERPT is lower for large changes in the exchange rate than for small changes - the flattening of the curve at the ends is clearly visible in Chart 2a. Apparently, local currency pricing might be at work: while small exchange rate changes are easy to pass through, passing on large changes run the danger of losing market share and consequently, foreign exporters prefer to absorb them into margins. In the post crisis period, however, the cubic term is found to be negative and significant, indicating that the ERPT is higher when deprecations were large, compared to small changes (Chart 2b). Thus, in the post-GFC period the foreign exporters are reluctant to hold the prices in response to large exchange rate changes.
IV.3 Cross-sectional Heterogeneity in ERPT The 17 EMEs considered in this paper were divided into two separate groups on the basis of their foreign trade profiles – net commodity importers11 and net commodity exporters12. The results indicate that linear ERPT estimates turned out to be more or less similar for commodity exporters (8.5 per cent) and importers (7.9 per cent) (Table 5). 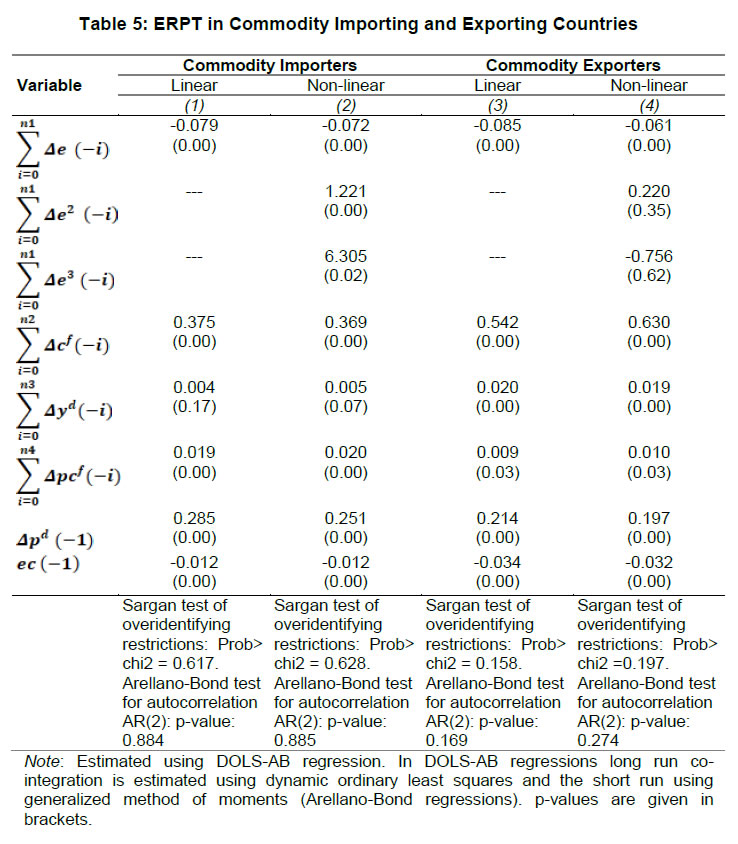 The non-linear estimates suggest that for commodity importers, both quartic and cubic terms are found to be positive and significant. This indicates that commodity importers do not pass through large changes to inflation. This is also represented in the flattening of the curve at the ends (Chart 3a). Since instances of large deprecations are fewer and not prolonged, staggered pass through is preferred in order to maintain market share. In case of commodity exporters, the quadratic term is positive with the cubic term turning negative. This indicates that the exporters tend to pass on large depreciations in exchange rate. This is also evident in the steepening of the curve when exchange rate depreciates sharply (Chart 3b). ERPT tends to be higher for exporting countries in comparison to importers when the exchange rate depreciations are large as they attempt to shore up profit margins through higher returns from exports, even at the cost of loss of domestic market share. Conclusion Has inflation targeting triumphed over the fear of floating? To answer the question, dependable estimates of ERPT are critical and especially so for EMEs, since they are situated in the crosshairs of the question – many of them have adopted inflation targeting framework for conducting monetary policy alongside flexible exchange rate regimes. For central banks that have to run through check lists regularly while setting the monetary policy stance, accuracy is the key. Easier said than done, it involves reckoning with nonlinearities, potential endogeneity of explanatory variables, and incorporation of error correction dynamics and heterogeneity in country characteristics. To the best of our knowledge, efforts to estimate ERPT accurately, while dealing comprehensively with these misspecifications in a cross-country framework, have been limited. This paper attempts to address this imbalance by providing estimates of ERPT that are painstakingly purged of these misspecifications across a representative sample of EMEs. The results are important from the point of view of the information content for monetary policy. As it is turned out, each misspecification correction yielded valuable insights that speak to the setting of policy. First, estimates show that short-term ERPT ranges between 8.9 to 15.4 per cent; 15.4 per cent when controlled for error correction and not for endogeneity, 8.9 per cent when controlled for both endogeneity and error correction. Second, accounting for non-linearities and asymmetries revealed that ERPT is higher for depreciation at 10 per cent than appreciation (5 per cent). Third, average ERPT has declined between the pre-GFC period and the post-GFC period from 11.8 per cent to 8.7 per cent. This decline is coincident with a moderation in average inflation among EMEs from 5.4 per cent to 4.1 per cent. These results bear out the Taylor hypothesis - the credibility of the inflation targeting framework has resulted in low and stable inflation and well anchored expectations across EMEs. This has worked towards reducing ERPT and endogenizing it into monetary policy. Fourth, size does matter. In the pre-GFC period, ERPT is found to be smaller for large changes in the exchange rate than for small changes. Evidently, the results validate the NOEM models pointing to strategic pricing by exporting firms by considering local market conditions in order to protect market shares in a world of supply chains. On the other hand, in the post-GFC period, large exchange rate changes induce higher ERPT compared to smaller changes. In pricing to market, firms may prefer to absorb small changes in the exchange rate rather than lose market share but are unlikely to prevent pass-through of large exchange rate movements. Fifth, heterogeneity on account of the nature of trade relationship with the rest of the world – net exporter or importers - do matter. Commodity importers do not pass through large changes in exchange rate to inflation - staggered pass through is preferred in order to maintain market share. On the other hand, commodity exporters prefer to pass on large changes in exchange rate to inflation as they attempt to shore up profit margins. These findings should condition the monetary policy response to exogenous price shocks that are transmitted to domestic inflation through imported inputs. To that extent, managing the impossible trinity gets a lot easier.
References: Arellano, M., & Bond, S. (1991). Some tests of specification for panel data: Monte Carlo evidence and an application to employment equations. The review of economic studies, 58(2), 277-297. Aron, J., Creamer, K., Muellbauer, J., Rankin, N. (2014a). Exchange rate pass-through to consumer prices in South Africa: Evidence from micro-data. Journal of Development Studies, 50(1), 165-185. Aron, J., Farrell, G., Muellbauer, J., Sinclair, P. (2014b). Exchange rate pass-through to import prices, and monetary policy in South Africa. Journal of Development Studies, 50(1), 144-164. Aron, J., Macdonald, R., Muellbauer, J. (2014c). Exchange rate pass-through in developing and emerging markets: A survey of conceptual, methodological and policy issues, and selected empirical findings. Journal of Development Studies, 50(1), 101-143. Barhoumi, K. (2006). Differences in long run exchange rate pass-through into import prices in developing countries: An empirical investigation. Economic Modelling, 23(6), 926-951. Burstein, A., Eichenbaum, M., & Rebelo, S. (2007). Modeling exchange rate passthrough after large devaluations. Journal of Monetary Economics, 54(2), 346-368. Bussiere, M. (2013). Exchange Rate Pass‐through to Trade Prices: The Role of Nonlinearities and Asymmetries. Oxford Bulletin of Economics and Statistics, 75(5), 731-758. Calvo, G. A., & Reinhart, C. M. (2000). Fixing for Your Life. Brookings Trade Forum, 39-54. Calvo, G. A., & Reinhart, C. M. (2002). Fear of floating. The Quarterly Journal of Economics, 117(2), 379-408. Campa, J. M., & Goldberg, L. S. (2005). Exchange rate pass-through into import prices. Review of Economics and Statistics, 87(4), 679-690. Caselli, F. G., & Roitman, A. (2016). Nonlinear exchange‐rate pass‐through in emerging markets. International Finance, Volume 22, Issue 3, Winter Cheikh, B. N., Rault, C. (2016). The Pass‐through of Exchange Rate in the Context of the European Sovereign Debt Crisis. International Journal of Finance & Economics, 21(2), 154-166. Delatte, A. L., López-Villavicencio, A. (2012). Asymmetric exchange rate pass-through: Evidence from major countries. Journal of Macroeconomics, 34(3), 833-844. Frankel, J. A., & Rose, A. K. (1996). Currency crashes in emerging markets: An empirical treatment. Journal of international Economics, 41(3-4), 351-366. Gagnon, J. E., Ihrig, J. (2004). Monetary policy and exchange rate pass‐through. International Journal of Finance & Economics, 9(4), 315-338. Gilbert, C. L. (1989). LSE and the British approach to time series econometrics. Oxford Economic Papers, 41(1), 108-128. Goldberg, P. K., Hellerstein, R. (2008). A structural approach to explaining incomplete exchange-rate pass-through and pricing-to-market. The American Economic Review, 98(2), 423-429. Jašová, M., Moessner, R., Takáts, E. (2016). Exchange rate pass-through: What has changed since the crisis? (No. 583). Bank for International Settlements. Kao, C., & Chiang, M. H. (2001). On the estimation and inference of a cointegrated regression in panel data. In Nonstationary panels, panel cointegration, and dynamic panels (pp. 179-222). Emerald Group Publishing Limited. Khundrakpam, J. (2007). Economic reforms and exchange rate pass-through to domestic prices in India. BIS Working Paper (No. 225). Bank for International Settlements. Knetter, M. M. (1994). Is export price adjustment asymmetric?: evaluating the market share and marketing bottlenecks hypotheses. Journal of International Money and Finance, 13(1), 55-70. Lopez-Villavicencio, A., Mignon, V. (2016). Exchange rate pass-through in emerging countries: Do the inflation environment, monetary policy regime and institutional quality matter? (No. 2016-18). University of Paris West-Nanterre la Défense, EconomiX. Marazzi, M., & Sheets, N. (2007). Declining exchange rate pass-through to US import prices: The potential role of global factors. Journal of international Money and Finance, 26(6), 924-947. Menon, J. (1995). Exchange rate pass‐through. Journal of Economic Surveys, 9(2), 197-231. Neal, T. (2014). XTPEDRONI: Stata module to perform Pedroni's panel cointegration tests and Panel Dynamic OLS estimation. https://econpapers.repec.org/software/bocbocode/S457925.htm Obstfeld, M., Rogoff, K. (2000). The six major puzzles in international macroeconomics: is there a common cause? NBER macroeconomics annual, 15, 339-390. Patra, M. D., Khundrakpam, J. K., & John, J. (2018). Non-Linear, Asymmetric and Time-Varying Exchange Rate Pass-Through: Recent Evidence from India. RBI Working Paper Series No. 02. Pesaran, M. H., & Smith, R. (1995). Estimating long-run relationships from dynamic heterogeneous panels. Journal of econometrics, 68(1), 79-113. Pesaran, M. H., Shin, Y., & Smith, R. P. (1999). Pooled mean group estimation of dynamic heterogeneous panels. Journal of the American Statistical Association, 94(446), 621-634. Pollard, P. S., Coughlin, C. C. (2003). Size Matters: Asymmetric Exchange Rate Pass-Through at the Industry Level. Federal Reserve Bank of St. Louis Working Paper Series, (2003-029). Rincon, H., & Rodríguez-Niño, N. (2018). Nonlinear state and shock dependence of exchange rate pass through on prices. BIS Working Paper (No. 690). Bank for International Settlements. Taylor, B. J. (2000). Low inflation, pass-through and the pricing power of firms, European Economic Review, 44(7), 1389–1408. |