Today, the Reserve Bank released the June 2017 round of the Inflation Expectations Survey of Households (IESH)1 conducted in 18 cities. The results are based on responses from 4,737 urban households covering various occupational categories (Table 1). Highlights: -
The proportion of respondents expecting general prices to increase in the next three months was slightly higher than in the previous two rounds and this was reflected across product groups, barring food products (Table 2). -
Around half of the respondents who expected the general price level to increase in the next three months also felt that prices would rise by more than the current rate; this proportion has also increased marginally over the May 2017 round of the survey. -
The rise in inflation expectations was reflected across all product groups, except housing. -
While a higher proportion of respondents expected the general prices to increase over the year ahead, the proportion of respondents who expected the general prices to rise at more than current rate (i.e., implying higher inflation) was lower than in the May 2017 round. -
Three months ahead and one year ahead median inflation expectations are stable since the March 2017 round (Chart 1); however, as compared with the June 2016 round, they declined by 170 and 100 basis points, respectively, in the June 2017 round, 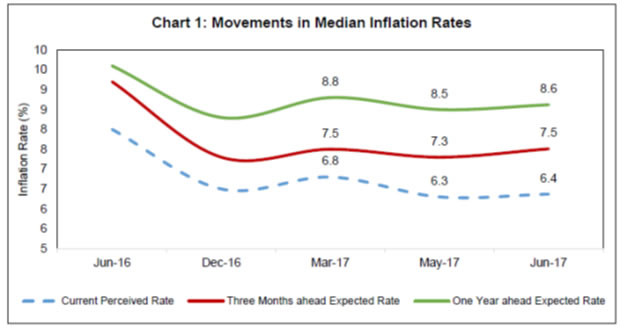
| Table 1: Respondents’ Profile (Category): Share in Total Sample - June 2017 | | Category of Respondents | Share in Total (%) | Target Share (%) | | Financial Sector Employees | 10.7 | 10.0 | | Other Employees | 14.4 | 15.0 | | Self-employed | 19.4 | 20.0 | | Housewives | 29.5 | 30.0 | | Retired Persons | 9.9 | 10.0 | | Daily Workers | 10.3 | 10.0 | | Others | 5.7 | 5.0 |
| Table 2: Product-wise Expectations of Prices for Three Months ahead and One Year ahead | | (Percentage of respondents) | | Round | Jun-16 | Dec-16 | Mar-17 | May-17 | Jun-17 | Jun-16 | Dec-16 | Mar-17 | May-17 | Jun-17 | | Options: General | Three Months Ahead | One Year Ahead | | Prices will increase | 85.2 | 59.9 | 73.8 | 70.2 | 77.2 | 90.4 | 68.1 | 81.0 | 80.9 | 82.4 | | Price increase more than current rate | 37.7 | 28.9 | 37.9 | 35.9 | 39.9 | 44.8 | 35.2 | 44.5 | 46.3 | 44.1 | | Price increase similar to current rate | 28.7 | 23.0 | 27.3 | 25.0 | 26.6 | 27.6 | 24.9 | 28.5 | 26.4 | 28.3 | | Price increase less than current rate | 18.8 | 8.0 | 8.6 | 9.3 | 10.7 | 18.0 | 8.0 | 8.0 | 8.2 | 10.1 | | No change in prices | 11.4 | 26.9 | 21.5 | 25.2 | 16.8 | 6.3 | 19.8 | 13.6 | 14.3 | 11.2 | | Decline in prices | 3.4 | 13.3 | 4.7 | 4.6 | 6.0 | 3.4 | 12.2 | 5.4 | 4.8 | 6.4 | | Options: Food Product | Three Months Ahead | One Year Ahead | | Prices will increase | 86.5 | 61.2 | 74.2 | 73.7 | 71.6 | 90.1 | 66.4 | 78.0 | 79.8 | 75.8 | | Price increase more than current rate | 38.3 | 30.3 | 39.5 | 38.6 | 39.1 | 44.7 | 32.2 | 39.7 | 42.1 | 38.0 | | Price increase similar to current rate | 29.3 | 19.6 | 24.7 | 23.6 | 21.8 | 28.4 | 24.1 | 29.0 | 27.2 | 26.8 | | Price increase less than current rate | 18.9 | 11.3 | 9.9 | 11.5 | 10.7 | 17.1 | 10.1 | 9.3 | 10.6 | 11.0 | | No change in prices | 9.1 | 17.1 | 16.5 | 18.2 | 14.2 | 5.5 | 16.6 | 12.8 | 11.9 | 12.4 | | Decline in prices | 4.4 | 21.7 | 9.3 | 8.1 | 14.3 | 4.3 | 17.1 | 9.2 | 8.2 | 11.8 | | Options: Non-Food Product | Three Months Ahead | One Year Ahead | | Prices will increase | 72.7 | 57.8 | 69.6 | 66.3 | 72.1 | 82.5 | 62.2 | 72.3 | 73.9 | 74.8 | | Price increase more than current rate | 27.7 | 27.4 | 34.1 | 32.4 | 36.9 | 33.6 | 29.2 | 35.1 | 37.1 | 36.3 | | Price increase similar to current rate | 26.3 | 20.6 | 25.1 | 23.4 | 23.6 | 29.2 | 23.3 | 27.5 | 25.7 | 27.3 | | Price increase less than current rate | 18.6 | 9.7 | 10.4 | 10.6 | 11.6 | 19.7 | 9.7 | 9.7 | 11.1 | 11.2 | | No change in prices | 23.0 | 26.2 | 23.6 | 26.9 | 18.1 | 13.8 | 23.5 | 20.3 | 19.1 | 16.3 | | Decline in prices | 4.4 | 16.0 | 6.8 | 6.8 | 9.8 | 3.7 | 14.4 | 7.4 | 7.0 | 9.0 | | Options: Household Durables | Three Months Ahead | One Year Ahead | | Prices will increase | 66.6 | 44.6 | 54.2 | 51.1 | 65.4 | 79.9 | 52.7 | 60.8 | 62.1 | 70.3 | | Price increase more than current rate | 26.3 | 20.9 | 27.2 | 25.1 | 34.7 | 34.1 | 24.8 | 29.7 | 31.9 | 35.7 | | Price increase similar to current rate | 23.4 | 16.4 | 19.3 | 17.1 | 20.6 | 27.3 | 18.9 | 22.8 | 21.5 | 24.3 | | Price increase less than current rate | 16.9 | 7.3 | 7.6 | 8.9 | 10.1 | 18.6 | 9.0 | 8.3 | 8.8 | 10.3 | | No change in prices | 25.7 | 32.5 | 30.8 | 33.6 | 20.6 | 14.2 | 27.0 | 25.3 | 24.9 | 17.5 | | Decline in prices | 7.8 | 22.9 | 15.1 | 15.3 | 14.0 | 5.9 | 20.3 | 13.9 | 13.0 | 12.2 | | Options: Housing Prices | Three Months Ahead | One Year Ahead | | Prices will increase | 77.3 | 44.6 | 56.7 | 57.3 | 64.3 | 86.6 | 54.0 | 68.7 | 69.7 | 73.4 | | Price increase more than current rate | 43.8 | 24.8 | 32.4 | 33.2 | 37.1 | 52.2 | 29.6 | 39.3 | 39.7 | 42.2 | | Price increase similar to current rate | 20.6 | 13.1 | 16.9 | 17.0 | 18.6 | 21.8 | 16.7 | 21.5 | 22.7 | 22.4 | | Price increase less than current rate | 12.9 | 6.6 | 7.4 | 7.1 | 8.7 | 12.5 | 7.7 | 8.0 | 7.3 | 8.8 | | No change in prices | 16.2 | 21.5 | 24.9 | 26.4 | 22.0 | 8.5 | 18.0 | 16.9 | 17.4 | 15.1 | | Decline in prices | 6.6 | 33.9 | 18.4 | 16.2 | 13.6 | 4.9 | 28.0 | 14.3 | 12.9 | 11.5 | | Options: Cost of Services | Three Months Ahead | One Year Ahead | | Prices will increase | 78.4 | 57.6 | 67.0 | 61.3 | 68.9 | 88.8 | 66.8 | 77.4 | 75.5 | 78.6 | | Price increase more than current rate | 33.7 | 27.1 | 33.6 | 29.4 | 35.1 | 42.8 | 32.6 | 38.5 | 37.3 | 38.8 | | Price increase similar to current rate | 26.9 | 21.0 | 23.8 | 21.7 | 23.7 | 28.5 | 23.7 | 28.5 | 26.8 | 27.8 | | Price increase less than current rate | 17.9 | 9.5 | 9.7 | 10.2 | 10.2 | 17.5 | 10.5 | 10.4 | 11.4 | 12.0 | | No change in prices | 19.0 | 29.8 | 27.5 | 33.0 | 25.3 | 8.5 | 22.3 | 17.4 | 19.1 | 15.6 | | Decline in prices | 2.6 | 12.6 | 5.6 | 5.7 | 5.8 | 2.8 | 10.9 | 5.2 | 5.5 | 5.9 |
| Table 3: Households Expecting General Price Movements in Coherence with Movements in Price Expectations of Various Product Groups: Three Months Ahead and One Year Ahead | | (Percentage of respondents) | | Round No. | Survey period ended | Food | Non-Food | Households durables | Housing | Cost of services | | Three Months Ahead | | 44 | Jun-16 | 69.8 | 60.0 | 54.5 | 55.7 | 59.2 | | 46 | Dec-16 | 55.4 | 55.8 | 48.5 | 47.0 | 57.7 | | 47 | Mar-17 | 57.1 | 56.7 | 48.1 | 48.3 | 57.7 | | 47B | May-17 | 59.8 | 59.7 | 51.0 | 52.5 | 60.3 | | 48 | Jun-17 | 62.0 | 64.3 | 57.2 | 57.6 | 63.4 | | One Year Ahead | | 44 | Jun-16 | 74.7 | 64.5 | 60.6 | 61.5 | 65.9 | | 46 | Dec-16 | 62.2 | 59.7 | 52.8 | 51.7 | 62.3 | | 47 | Mar-17 | 62.3 | 60.4 | 51.5 | 54.6 | 64.1 | | 47B | May-17 | 66.8 | 64.4 | 56.4 | 58.7 | 67.3 | | 48 | Jun-17 | 68.2 | 67.7 | 62.0 | 63.2 | 70.0 |
| Table 4: Household Inflation Expectations – Current, Three Months and One Year Ahead | | Survey Round | Survey Period Ended | Inflation rate in Per cent | | Current | Three Months Ahead | One Year Ahead | | Mean | Median | Std. Dev. | Mean | Median | Std. Dev. | Mean | Median | Std. Dev. | | 44 | Jun-16 | 8.8 | 8 | 4.4 | 9.7 | 9.2 | 4.4 | 10 | 9.6 | 4.7 | | 46 | Dec-16 | 7.4 | 6.5 | 3.9 | 7.9 | 7.3 | 4.1 | 8.7 | 8.3 | 4.3 | | 47 | Mar-17 | 7.8 | 6.8 | 4 | 8.2 | 7.5 | 4.1 | 9.3 | 8.8 | 4.2 | | 47B | May-17 | 7.5 | 6.3 | 4 | 8.1 | 7.3 | 4.2 | 9.2 | 8.5 | 4.3 | | 48 | Jun-17 | 7.3 | 6.4 | 3.8 | 8.1 | 7.5 | 3.9 | 9.1 | 8.6 | 4.1 |
| Table 5: Factors that Explain the Total Variability | | Round No. | Survey Period Ended | Current | Three Months Ahead | One Year Ahead | | 44 | Jun-16 | City, Age-Group, Category | City, Category | City, Category | | 46 | Dec-16 | City, Gender, Age-Group | City, Category, Age-Group | City, Category | | 47 | Mar-17 | City, Age-Group | City, Category | City, Category | | 47B | May-17 | City, Gender, Category | City, Category | City, Category | | 48 | Jun-17 | City, Age-Group, Category | City, Age-Group, Category | City, Age-Group, Category |
| Table 6 : Various Group-wise Inflation Expectations: June 2017 | | | Current | Three Months Ahead | One Year Ahead | | Mean | Median | Std. Dev. | Mean | Median | Std. Dev. | Mean | Median | Std. Dev. | | Overall | 7.3 | 6.4 | 3.8 | 8.1 | 7.5 | 3.9 | 9.1 | 8.6 | 4.1 | | Gender-wise | | Male | 7.4 | 6.5 | 3.8 | 8.2 | 7.5 | 4.0 | 9.1 | 8.6 | 4.2 | | Female | 7.3 | 6.2 | 3.8 | 8.0 | 7.5 | 3.9 | 9.1 | 8.7 | 4.0 | | Category-wise | | Financial Sector Employees | 7.0 | 6.0 | 3.6 | 7.7 | 7.2 | 3.8 | 8.6 | 8.2 | 4.0 | | Other Employees | 7.6 | 6.7 | 3.9 | 8.4 | 7.8 | 3.9 | 9.4 | 8.9 | 4.1 | | Self Employed | 7.5 | 6.5 | 3.8 | 8.1 | 7.5 | 4.0 | 9.0 | 8.5 | 4.1 | | Housewives | 7.3 | 6.2 | 3.8 | 8.1 | 7.5 | 3.8 | 9.1 | 8.7 | 4.1 | | Retired Persons | 7.5 | 6.5 | 3.9 | 8.2 | 7.6 | 4.2 | 9.2 | 8.9 | 4.2 | | Daily Workers | 7.5 | 6.7 | 3.8 | 8.2 | 7.7 | 4.0 | 9.1 | 8.9 | 4.2 | | Other category | 6.8 | 5.9 | 3.8 | 7.6 | 7.1 | 3.8 | 8.5 | 8.2 | 4.2 | | Age Group-wise | | Up to 25 years | 7.0 | 6.2 | 3.5 | 7.6 | 7.2 | 3.5 | 8.7 | 8.4 | 3.8 | | 25 to 30 years | 7.0 | 6.2 | 3.6 | 7.8 | 7.4 | 3.7 | 8.7 | 8.4 | 4.0 | | 30 to 35 years | 7.4 | 6.2 | 4.0 | 8.1 | 7.5 | 4.0 | 9.0 | 8.5 | 4.1 | | 35 to 40 years | 7.4 | 6.5 | 3.8 | 8.0 | 7.6 | 4.0 | 9.0 | 8.7 | 4.2 | | 40 to 45 years | 7.5 | 6.3 | 4.0 | 8.2 | 7.5 | 4.1 | 9.2 | 8.6 | 4.2 | | 45 to 50 years | 7.4 | 6.3 | 4.0 | 8.3 | 7.7 | 4.2 | 9.1 | 8.8 | 4.3 | | 50 to 55 years | 7.9 | 7.0 | 3.9 | 8.7 | 7.8 | 4.1 | 9.5 | 9.0 | 4.1 | | 55 to 60 years | 7.9 | 6.9 | 3.9 | 8.8 | 8.2 | 4.0 | 10.1 | 10.0 | 4.0 | | 60 years and above | 7.7 | 6.8 | 4.0 | 8.5 | 7.7 | 4.3 | 9.4 | 9.1 | 4.4 | | City-wise | | Ahmedabad | 7.9 | 7.6 | 2.7 | 8.9 | 8.3 | 2.7 | 9.2 | 8.7 | 2.8 | | Bengaluru | 4.9 | 4.8 | 2.0 | 6.0 | 5.4 | 3.0 | 7.1 | 5.8 | 3.9 | | Bhopal | 5.9 | 5.5 | 2.3 | 7.7 | 7.9 | 2.8 | 9.4 | 9.7 | 3.7 | | Bhubaneswar | 7.8 | 6.0 | 3.7 | 9.5 | 8.7 | 4.1 | 10.9 | 10.6 | 4.5 | | Chennai | 7.5 | 5.9 | 3.8 | 8.0 | 7.5 | 4.0 | 10.4 | 10.6 | 3.9 | | Delhi | 6.3 | 5.7 | 2.9 | 7.0 | 6.6 | 2.9 | 7.4 | 7.1 | 3.0 | | Guwahati | 9.9 | 10.6 | 5.9 | 9.1 | 10.1 | 6.1 | 9.4 | 10.1 | 5.9 | | Hyderabad | 6.3 | 6.3 | 0.9 | 6.9 | 6.9 | 1.1 | 7.6 | 7.8 | 1.4 | | Jaipur | 8.2 | 7.9 | 3.1 | 9.3 | 9.0 | 3.5 | 10.7 | 10.7 | 3.9 | | Kolkata | 9.4 | 8.3 | 4.3 | 10.5 | 9.6 | 4.1 | 11.6 | 10.9 | 4.1 | | Lucknow | 6.4 | 5.8 | 2.7 | 7.4 | 7.2 | 3.1 | 8.1 | 7.8 | 3.5 | | Mumbai | 8.4 | 8.5 | 3.4 | 8.3 | 8.6 | 3.8 | 8.9 | 9.5 | 4.0 | | Nagpur | 5.6 | 5.0 | 4.0 | 6.4 | 5.7 | 4.0 | 7.6 | 6.7 | 4.1 | | Patna | 6.3 | 6.2 | 1.1 | 7.0 | 7.0 | 1.4 | 8.2 | 8.2 | 1.7 | | Thiruvananthapuram | 9.4 | 8.3 | 4.5 | 10.5 | 9.8 | 4.3 | 11.9 | 12.3 | 4.3 | | Chandigarh | 8.0 | 7.2 | 3.9 | 8.4 | 7.9 | 3.8 | 8.8 | 8.1 | 3.9 | | Ranchi | 3.8 | 3.4 | 2.0 | 4.4 | 4.0 | 2.1 | 5.6 | 5.5 | 2.5 | | Raipur | 6.2 | 5.7 | 3.3 | 7.5 | 7.1 | 3.9 | 7.7 | 7.8 | 4.1 |
| Table 7: Cross-tabulation of Current and Three Months Ahead Inflation Expectations: June 2017 | | (Number of respondents) | | Three Months Ahead Inflation Rate (per cent) | | Current Inflation Rate (per cent) | | <1 | 1-<2 | 2-<3 | 3-<4 | 4-<5 | 5-<6 | 6-<7 | 7-<8 | 8-<9 | 9-<10 | 10-<11 | 11-<12 | 12-<13 | 13-<14 | 14-<15 | 15-<16 | >=16 | No idea | Total | | <1 | 28 | 19 | 10 | 5 | 1 | 6 | 0 | 0 | 1 | 0 | 6 | 0 | 0 | 0 | 1 | 0 | 2 | 2 | 81 | | 1-<2 | 4 | 37 | 32 | 10 | 1 | 3 | 1 | 2 | 0 | 0 | 0 | 0 | 0 | 0 | 0 | 1 | 0 | 4 | 95 | | 2-<3 | 2 | 12 | 89 | 86 | 25 | 21 | 2 | 0 | 2 | 0 | 0 | 0 | 2 | 0 | 0 | 1 | 0 | 4 | 246 | | 3-<4 | 0 | 8 | 33 | 114 | 73 | 84 | 15 | 8 | 4 | 1 | 3 | 0 | 0 | 0 | 0 | 1 | 0 | 4 | 348 | | 4-<5 | 0 | 3 | 10 | 14 | 106 | 123 | 67 | 38 | 13 | 3 | 4 | 0 | 0 | 0 | 0 | 0 | 0 | 7 | 388 | | 5-<6 | 7 | 4 | 34 | 21 | 33 | 247 | 255 | 237 | 98 | 11 | 54 | 1 | 1 | 0 | 0 | 3 | 2 | 8 | 1016 | | 6-<7 | 2 | 1 | 1 | 6 | 6 | 18 | 135 | 226 | 83 | 19 | 12 | 0 | 5 | 0 | 0 | 1 | 0 | 9 | 524 | | 7-<8 | 2 | 1 | 0 | 1 | 2 | 13 | 25 | 108 | 129 | 76 | 43 | 1 | 6 | 0 | 0 | 1 | 0 | 0 | 408 | | 8-<9 | 1 | 1 | 7 | 2 | 6 | 4 | 3 | 9 | 113 | 95 | 72 | 9 | 7 | 2 | 1 | 3 | 1 | 3 | 339 | | 9-<10 | 0 | 0 | 0 | 0 | 0 | 4 | 1 | 2 | 5 | 43 | 44 | 26 | 15 | 1 | 1 | 2 | 2 | 7 | 153 | | 10-<11 | 4 | 3 | 4 | 10 | 4 | 28 | 3 | 8 | 12 | 6 | 151 | 57 | 125 | 23 | 11 | 73 | 24 | 11 | 557 | | 11-<12 | 7 | 0 | 0 | 1 | 1 | 1 | 0 | 0 | 0 | 2 | 2 | 22 | 12 | 11 | 3 | 9 | 3 | 4 | 78 | | 12-<13 | 0 | 0 | 0 | 0 | 0 | 1 | 0 | 0 | 1 | 1 | 1 | 0 | 16 | 10 | 8 | 12 | 5 | 0 | 55 | | 13-<14 | 1 | 0 | 0 | 0 | 2 | 0 | 0 | 0 | 0 | 0 | 0 | 0 | 0 | 3 | 1 | 8 | 3 | 1 | 19 | | 14-<15 | 1 | 0 | 0 | 0 | 0 | 0 | 0 | 0 | 1 | 0 | 0 | 0 | 0 | 0 | 3 | 3 | 6 | 1 | 15 | | 15-<16 | 1 | 0 | 0 | 0 | 1 | 13 | 3 | 0 | 0 | 1 | 7 | 0 | 3 | 1 | 0 | 41 | 48 | 2 | 121 | | >=16 | 9 | 0 | 0 | 4 | 0 | 9 | 0 | 0 | 0 | 0 | 14 | 0 | 4 | 1 | 0 | 10 | 217 | 26 | 294 | | Total | 69 | 89 | 220 | 274 | 261 | 575 | 510 | 638 | 462 | 258 | 413 | 116 | 196 | 52 | 29 | 169 | 313 | 93 | 4737 |
| Table 8: Cross-tabulation of Current and One Year Ahead Inflation Expectations: June 2017 | | (Number of respondents) | | One Year Ahead Inflation Rate (per cent) | | Current Inflation Rate (per cent) | | <1 | 1-<2 | 2-<3 | 3-<4 | 4-<5 | 5-<6 | 6-<7 | 7-<8 | 8-<9 | 9-<10 | 10-<11 | 11-<12 | 12-<13 | 13-<14 | 14-<15 | 15-<16 | >=16 | No idea | Total | | <1 | 23 | 4 | 14 | 4 | 7 | 11 | 1 | 0 | 2 | 3 | 7 | 0 | 0 | 0 | 0 | 2 | 2 | 1 | 81 | | 1-<2 | 1 | 26 | 20 | 16 | 9 | 12 | 3 | 0 | 1 | 0 | 0 | 0 | 1 | 0 | 0 | 2 | 1 | 3 | 95 | | 2-<3 | 5 | 6 | 70 | 38 | 47 | 38 | 19 | 4 | 3 | 2 | 5 | 0 | 1 | 0 | 0 | 2 | 2 | 4 | 246 | | 3-<4 | 1 | 13 | 22 | 88 | 44 | 56 | 37 | 23 | 27 | 7 | 12 | 2 | 4 | 0 | 0 | 2 | 0 | 10 | 348 | | 4-<5 | 0 | 2 | 10 | 14 | 74 | 63 | 66 | 47 | 37 | 20 | 20 | 8 | 7 | 0 | 0 | 3 | 0 | 17 | 388 | | 5-<6 | 2 | 2 | 12 | 23 | 32 | 161 | 131 | 208 | 112 | 55 | 160 | 33 | 22 | 5 | 5 | 24 | 12 | 17 | 1016 | | 6-<7 | 0 | 2 | 2 | 4 | 7 | 28 | 73 | 123 | 142 | 41 | 51 | 11 | 17 | 4 | 1 | 8 | 1 | 9 | 524 | | 7-<8 | 2 | 1 | 1 | 2 | 4 | 14 | 12 | 73 | 81 | 90 | 66 | 12 | 16 | 6 | 8 | 12 | 1 | 7 | 408 | | 8-<9 | 2 | 0 | 4 | 4 | 5 | 6 | 8 | 8 | 55 | 66 | 100 | 21 | 27 | 6 | 6 | 11 | 7 | 3 | 339 | | 9-<10 | 0 | 0 | 0 | 0 | 1 | 3 | 1 | 2 | 5 | 23 | 35 | 27 | 23 | 7 | 7 | 12 | 3 | 4 | 153 | | 10-<11 | 8 | 1 | 1 | 3 | 2 | 28 | 3 | 4 | 15 | 6 | 123 | 32 | 64 | 28 | 30 | 100 | 88 | 21 | 557 | | 11-<12 | 4 | 0 | 1 | 0 | 1 | 2 | 0 | 0 | 0 | 1 | 2 | 16 | 10 | 11 | 2 | 9 | 10 | 9 | 78 | | 12-<13 | 0 | 0 | 0 | 0 | 0 | 0 | 0 | 0 | 0 | 1 | 2 | 0 | 10 | 6 | 1 | 20 | 14 | 1 | 55 | | 13-<14 | 0 | 0 | 0 | 2 | 0 | 1 | 0 | 0 | 0 | 0 | 0 | 0 | 0 | 1 | 1 | 2 | 11 | 1 | 19 | | 14-<15 | 1 | 0 | 0 | 0 | 0 | 0 | 0 | 0 | 0 | 0 | 0 | 0 | 0 | 0 | 0 | 2 | 9 | 3 | 15 | | 15-<16 | 1 | 1 | 1 | 0 | 0 | 6 | 1 | 1 | 1 | 0 | 7 | 0 | 4 | 1 | 1 | 29 | 58 | 9 | 121 | | >=16 | 9 | 0 | 0 | 4 | 1 | 9 | 0 | 0 | 1 | 1 | 14 | 0 | 2 | 2 | 1 | 11 | 215 | 24 | 294 | | Total | 59 | 58 | 158 | 202 | 234 | 438 | 355 | 493 | 482 | 316 | 604 | 162 | 208 | 77 | 63 | 251 | 434 | 143 | 4737 |
|