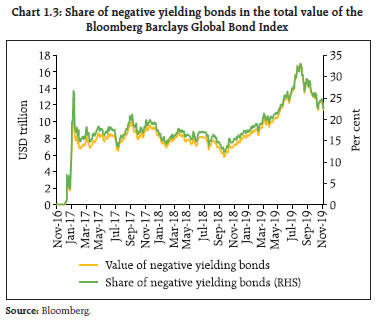
The global economy confronted a number of uncertainties – a delay in the Brexit deal, trade tensions, whiff of an impending recession, oil-market disruptions and geopolitical risks – leading to significant deceleration in growth. These uncertainties weighed on consumer confidence and business sentiment, dampened investment intentions and are likely to remain a key drag on global growth. Predictably, lower interest rates and easy monetary policies are boosting leverage globally, with the indebtedness of emerging market(EM) governments and households showing a distinct increase, besides supporting asset prices and capital flows to EMs. On the domestic front, aggregate demand slackened in Q2:2019-20, further extending the growth deceleration. While the outlook for capital inflows remains positive, India’s exports could face headwinds in the event of sustained global slowdown, but current account deficit is likely to be under control reflecting muted energy price outlook. Various policy announcements by the Government coupled with the Reserve Bank’s accommodative stance are expected to provide an enabling environment to bolster economic performance in the medium-term, though short-term pressures remain. Reviving the twin engines of consumption and investment while being vigilant about spillovers from global financial markets remains a critical challenge going forward. Global backdrop 1.1 The global economy has decelerated, buffeted by a series of shocks in 2018 and 2019. In its October 2019 outlook, the International Monetary Fund (IMF)1 revised global growth for 2019 to 3 per cent, a full 60 basis points (bps) below its October 2018 projections. The downgrade in growth projection is symmetric, both for Advanced Economies (AEs) and Emerging Market and Developing Economies (EMDEs). The World Economic Outlook (WEO) estimates growth in the EMDEs to bottom out at 3.9 per cent in 2019 emanating from softness in the growth in emerging and developing Asia (Chart 1.1). 1.2 The subdued economic outlook is also reflected in the Economic Surprise Index with negative surprises in economic data generally outstripping positive surprises globally (Chart 1.2). US Economic Surprise Index, while off the early 2018 post-tax cut highs, is still marginally positive, reflecting the resilience of consumption and labour markets notwithstanding significant policy and political uncertainty. In the meanwhile, fears of recession in the US have clearly faded with the correction in inverted US yield curve. Swings in the surprise index might largely be owing to policy uncertainty now reigning globally as also due to optimism bias. 1.3 The underlying global macro-financial conditions, coupled with geopolitical uncertainties continue to pose significant spillover risks to EMDEs. The spillovers can be seen through the following dimensions: i. Central banks’ actions and stakeholders’ behaviour; ii. Global uncertainties and related spillovers; iii. Commodity market behaviour; and iv. Capital flows. i. Central banks’ actions and stakeholders’ behaviour 1.4 The extraordinary monetary expansion in the wake of persistent economic weakness has distorted global yields. In the Bloomberg Barclays Global Aggregate Bond Index - a premier index used extensively for benchmarking bond investments by institutional investors - about a quarter of its value is invested in negative yielding bonds. More importantly, the proportion of such investments has almost symmetrically moved up in the recent period with their value in the index (Chart 1.3). On the other hand, chasing of yields is also evident from the spurt in the modified duration of the index (Chart 1.4). In other words, while chasing yields, investors are also betting on negative yielding bonds for capital gains for which yields need to go down further - reason why what is good news for the real economies is also increasingly turning out to be bad news for the markets and any indication of an end, not to talk of reversal, in easy monetary policies rattles the markets. It may be possible that factors which constrain multilateral trade could ultimately push inflation up across the globe, something which many leading central banks are grappling with. Recently, the uneasy equilibrium in debt markets has been highlighted by the yearend pre-Christmas sell-off in US Treasuries. This has consequently led to a sharp decline in the proportion of negative yielding bonds. 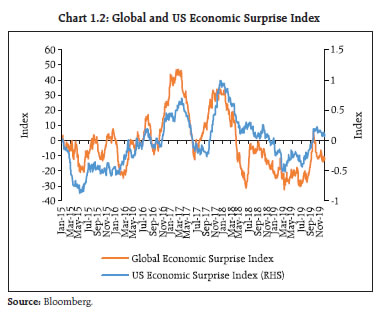
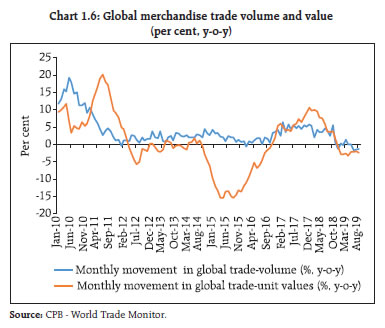
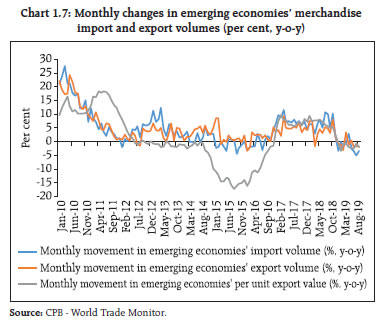
 ii. Global uncertainties and related spillovers 1.5 Over the last year or so, uncertainties have accumulated: a delay in the Brexit deal, trade tensions, a whiff of an impending recession, oil-market disruptions and geopolitical risks to cite the major ones. The markets assumed the best-case outcome of domestic resilience through consumption-led growth as the bulwark countering slowing trade growth both in the US and China. However, pervasive and accumulating global uncertainties (Chart 1.5) weighed on consumer confidence and business sentiments and dampened investment intentions - a key drag on global growth. The WEO projects that the 2019 world trade growth of goods and services will be just at 1.1 per cent, a sharp 230 basis points reduction from its previous forecast in April 2019. Similarly, the forecast for world trade growth for 2020 has been downgraded by 70 basis points to 3.2 per cent from the April 2019 forecast. Monthly changes in global trade volume and value also showed a decline in both volume and value in recent months (Chart 1.6). More relevant from the emerging markets’ (EMs) perspective, both their imports and exports declined in recent months (Chart 1.7) concurrently with a low per unit export value. However, the recent efforts to normalise US- China trade relations may have salutary effect on global trade going forward. 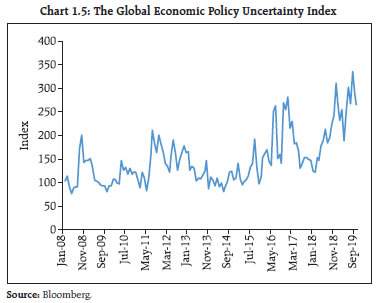
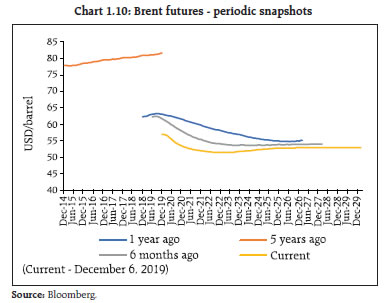
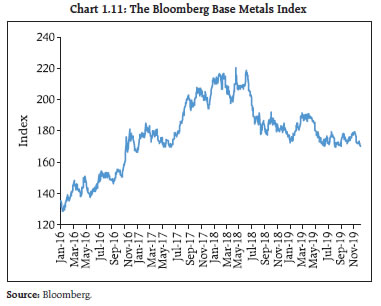
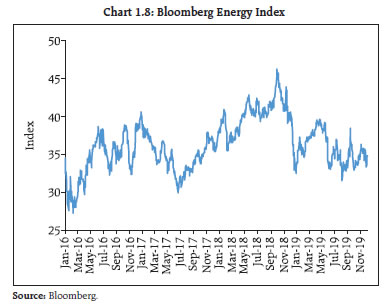 iii. Commodity market behaviour 1.6 As global demand conditions soften, commodity price projections entail a difficult balancing act of estimating price support due to possible supply constraints vis-á-vis demand shortages capping price appreciation. Since supply constraints induced by geopolitical risks are inherently unpredictable, commodity prices often tend to deviate significantly from equilibrium levels due to event induced disruptions. The US Energy Information Administration (EIA) expects slowing global economic growth to put downward pressure on oil prices which will likely outweigh concerns about supply stability recently highlighted by the attack on a Saudi oil facility (Chart 1.8). The International Energy Agency (IEA), mostly concurs with EIA’s outlook. The near-term traded Brent options showed no specific trading bias (Chart 1.9). In addition, the backwardation in long term futures prices illustrates the long-term bearishness in the oil price outlook (Chart 1.10). The base metals space continues to suffer the effects of worsening economic environment, specifically the worsening manufacturing environment, as also lingering uncertainties with respect to Chinese demand (Chart 1.11). The recent efforts to normalise US- China trade relations may have a significant impact on the commodity price outlook. 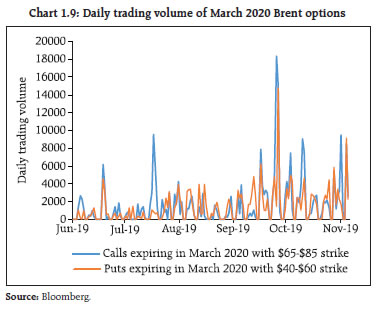
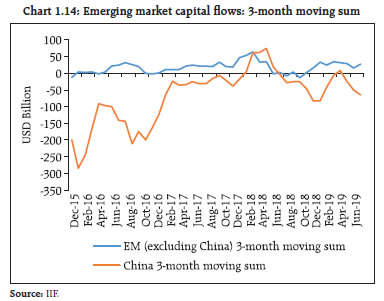
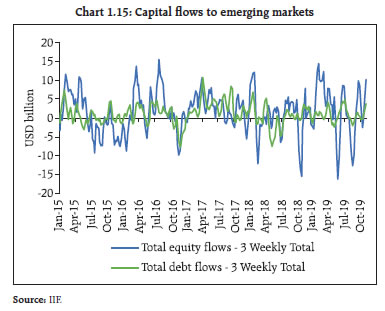
 iv. Capital flows 1.7 Predictably, lower interest rates and easy monetary policies are boosting leverage globally (Chart 1.12), with the indebtedness of emerging market governments and households showing a distinct increase (Chart 1.13), besides supporting asset prices irrespective of the fundamentals. Capital flows to Emerging Markets (EMs) are gathering pace (Chart 1.14) - currently one of the positive spillovers for EMs - but without any significant sustained boost to their GDP. Moreover, the increase in household indebtedness in emerging markets in a global environment, beset with trade frictions and increasingly reliant on consumption for growth, is an issue that requires policy attention. 1.8 Accommodative monetary policy has whetted the risk appetite and flows to EMs. Facing persistently low yields in traditional asset classes, global investors have reverted to EM assets (Chart 1.15). The differentiation in flows across emerging markets has been led by differences in benchmark weights (for equity) and individual EMs’ interest rate outlook (for debt). 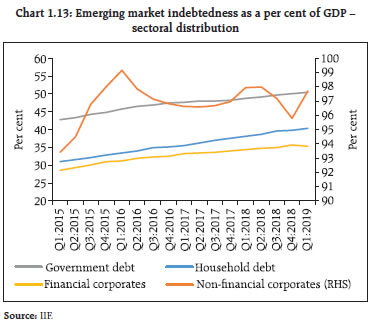
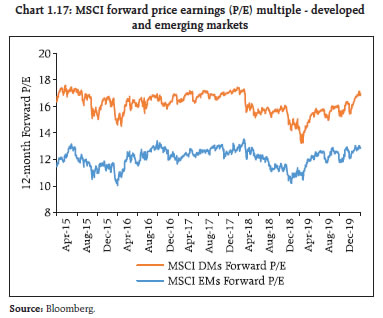
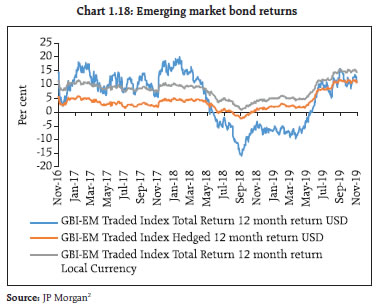
 1.9 The MSCI Index in Chart 1.16 gives an indication of sustainability of equity flows, forward earnings per share (EPS) and the relative valuation profile of the corporate sector. While there is an EPS wedge between developed markets (DMs) and EMs, EMs' equity is clearly attractive in valuation terms relative to DMs' equities (Chart 1.17). With regard to sustainability of local currency debt flows, Chart 1.18 plots the local currency, hedged and unhedged 12-month trailing returns of the JP Morgan Global Bond Index for Emerging Markets (GBI-EM). The superior local currency returns as compared to USD returns may be on account of significant softening in policy rates in EMs while the volatility in hedged and unhedged USD returns reflect the volatility in exchange rates. As US monetary easing takes a breather, the exchange rate outlook for EM currencies will be a large determinant of EM local currency bond flows notwithstanding a generally favourable local currency interest rate environment. 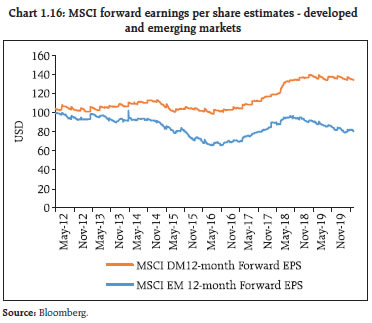
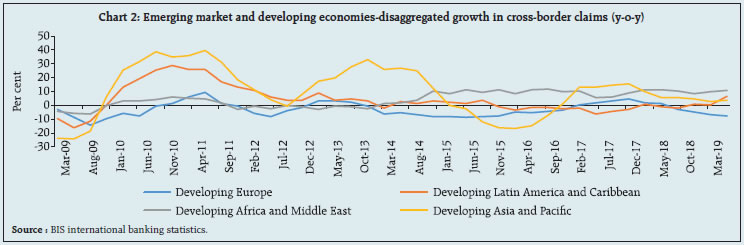
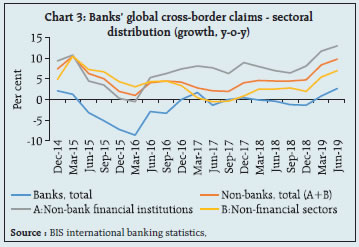
 1.10 The recently released Bank for International Settlements' (BIS) statistics showed a sharp growth in banks’ cross-border claims, their sharpest since the global financial crisis. Some of the salient issues of the statistical release as also emerging vulnerabilities thereof are highlighted in Box 1.1. Box 1.1: Global banking sector’s claims on non-banking financial institutions: Out of the shadows The health of Non-Banking Financial Institutions3 (NBFis) has implications for systemic stability. According to the BIS international banking statistics (June 2019), global cross-border banks’ claims expanded at their highest annual growthrate since the financial crisis (Chart 1). In the context of EMDEs, while growth in banking cross-border claims is off its lows, there is significant heterogeneity in the growth across regions with growth in Africa being robust while growth in developing Europe sharply decelerating (Chart 2). Global cross-border claims on NBFis, continue to outpace other sectors by a significant margin(Chart 3). Banks’ claims as also their liabilities to NBFis have been on the rise in recent years. Tracking locational banking statistics, Luna and Hardy (“Non-bank counterparties in international banking”, BIS Quarterly Review, September 2019), showed that banks’ cross-border claims on NBFis increased from 30 per cent of their total claims in March 2016 to 35 per cent in March 2019; in absolute amounts, they rose from USD 4.8 trillion to USD 6.6 trillion. Banks’ foreign currency consolidated exposure to NBFis rose from 18 per cent of the total claims to 35 per cent. 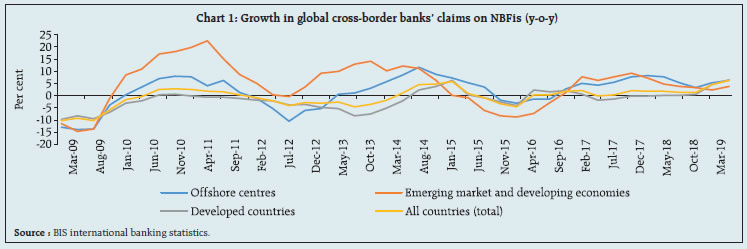
 NBFis’ aggregate claims on banks increased from USD 3.77 trillion in March 2016 to USD 4.95 trillion in June 2019. At a time when the banking sector’s regulations are being tightened, there is a possibility that riskier activities will shift to the relatively less regulated NBFi sector albeit with funding from banks. One pertinent question is how the riskiness of banks’ exposures to NBFis is to be viewed when such exposures in effect could be to the real sector. | Domestic macro-financial developments A. Economy 1.11 Aggregate demand slackened in Q2:2019-20 to 4.5 per cent, further extending the sequential quarterly deceleration. This deceleration in the economy was led by a sharp slowdown in gross fixed capital formation (GFCF) and sluggishness in private final consumption expenditure (PFCE). The slowdown might have turned out to be more pronounced except for government consumption, which provided a cushion to slackening demand conditions. In the ‘Fifth Bi-monthly Monetary Policy Statement, 2019-20’ in December 2019, the Reserve Bank revised real gross domestic product (GDP) growth projections for 2019-20 from 6.1 per cent in the October 2019 policy to 5.0 per cent - 4.9- 5.5 per cent in H2:2019-20 and 5.9-6.3 per cent for H1:2020-21. 1.12 While the government’s fiscal deficit numbers have improved over the years, revenue shortfall amidst weaker private consumption and investment could challenge fiscal parameter. 1.13 India’s exports have been facing headwinds (Chart 1.19). Merchandise exports declined by 2.0 per cent (y-o-y) during April-November 2019 as against an expansion of 10.9 per cent in the corresponding period in the previous year. With global growth and trade projected to slow down further, India’s exports could face challenging demand conditions going forward. 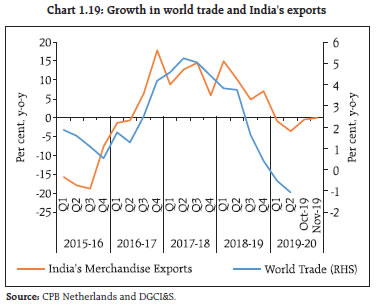 1.14 In Q1:2019-20, trade deficit rose and current account deficit (CAD) widened to 2.0 per cent of GDP from 0.7 per cent in the preceding quarter. Net capital flows were higher in Q1:2019-20. Foreign direct investment (FDI) recorded net inflows of USD 13.9 billion in Q1:2019-20 as compared to USD 9.6 billion in the corresponding quarter of the previous year. Among other components of capital flows, net external commercial borrowings (ECBs) and short-term credit were buoyant in Q1:2019-20. Overall, net capital flows exceeded CAD’s financing requirements and led to an accretion of foreign exchange reserves (Chart 1.20). As on December 13, 2019 the foreign exchange reserves stood at USD 454.49 billion. 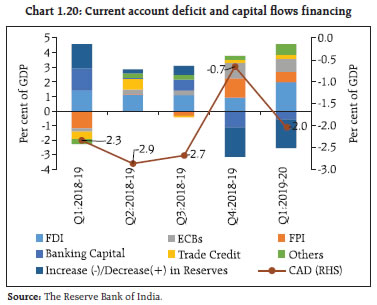 1.15 Unlike the trend observed in 2018-19, foreign portfolio investors (FPIs) invested to the tune of USD 7.8 billion in the Indian securities market during April-October 2019. The first two quarters of FY 2019-20, recorded an inflow by FPIs in the debt and hybrid segments; however, there was an outflow of USD 3.2 billion by FPIs in equities during Q2:2019-20. Further, FPI investments in hybrid instruments saw a sharp increase during the current year with total inflows of USD 744 million upto end-October 2019 (Chart 1.21). 1.16 Amongst BRICS nations (ex-China), only India observed FPI inflows in both the equity and debt segments during January-September 2019 (Chart 1.22) while Russia saw the highest liquidation by FPIs in the debt segment during the same period. 1.17 The valuation of Indian equities vis-à-vis its emerging market peers seems to be somewhat expensive (Chart 1.23). The high valuations of the benchmark indices will be sustainable only if there is a steady rise in corporate earnings. The quarterly earnings per share (Q-EPS) growth of the S&P BSE 500 Index went up in the quarter ended September 2019 on a y-o-y basis, although the same for the Nifty 50 scrips declined (Chart 1.24a). Further, future earnings expectations also witnessed a decreasing trend over the 6-month period (Chart 1.24b).
B. Credit growth 1.18 Given the weakening economic growth, the underlying credit buoyancy and its nuances are of relevance. The aggregate growth (y-o-y) in banking sector’s gross loans and advances noticeably slowed from 13.2 per cent in March 2019 to 8.7 per cent in September 2019. Table 1.1 lists the commercial sector's (that is, non-financial credit) outstanding balance across financial intermediaries; it is evident that there has been an across-the-board dip between March and June 2019. 1.19 Given the intimate relationship between credit offtake and GDP growth, the slowdown in the flow of credit to the commercial sector needs reversal. Box 1.2 delves into a detailed examination of the recent wholesale credit growth experience in the banking sector. | Table 1.1: Commercial sector4 outstanding balance across all intermediaries (in ₹ crore) | | | <₹0.1cr | ₹0.1cr- ₹1cr | ₹1cr- ₹25cr | ₹25cr- ₹100cr | >₹100cr | Total | | Mar-18 | 82,958 | 3,21,268 | 9,62,976 | 5,52,730 | 37,82,604 | 57,02,536 | | Jun-18 | 83,682 | 3,39,358 | 10,04,152 | 5,54,602 | 38,31,444 | 58,13,238 | | Sep-18 | 85,168 | 3,44,105 | 10,02,593 | 5,53,506 | 39,88,006 | 59,73,378 | | Dec-18 | 90,975 | 3,63,080 | 10,44,833 | 5,80,537 | 41,59,140 | 62,38,566 | | Mar-19 | 93,834 | 3,84,179 | 11,39,628 | 5,91,282 | 43,42,793 | 65,51,716 | | Jun-19 | 90,530 | 3,71,952 | 11,03,840 | 5,71,993 | 42,41,545 | 63,79,861 | | Source: Transunion CIBIL. |
Box 1.2: Wholesale credit growth in the banking sector- the recent experience Credit growth in wholesale accounts (aggregate exposure of ₹ 5 crore and above) in the past two years was dominated by very large accounts (aggregate exposure above ₹ 5000 crore) (Chart 1). Furthermore, a broad split between financial and non-financial firms (Chart 2) shows that credit growth in 2018-19 was dominated by financial firms (non-banking financial companies and housing finance companies). The share of “very large” credit moved up from 33 per cent in March 2018 to 39per cent in March 2019 (Table 1). Charts 3 and 4 display credit growth for very large public sector undertakings (PSUs) and private financial and nonfinancial firms, respectively. | Table 1: Relative share of sub-categories of credit in the wholesale SCB portfolio | | (per cent) | | | Mar-17 | Mar-18 | Mar-19 | | Very Large (>= ₹5000 crore) | 30.7 | 33.3 | 38.7 | | Large (₹100 crore - ₹5000 crore) | 48.8 | 46.2 | 42.0 | | Medium (₹25 crore - ₹100 crore) | 9.8 | 9.7 | 8.9 | | Small (₹5 crore - ₹25 crore) | 10.7 | 10.9 | 10.4 | | Source: CRILC. |
A more disaggregated analysis of very large credit exposures in terms of the obligors (Chart 5) shows that significant credit growth was driven by a relatively narrow set of firms. Comparing March 2018 and March 2019, out of the 148 and 161 firms, respectively that formed the very large credit offtake, 126 firms were common. A further examination for assessing whether lack of access to credit was responsible for such subdued credit growth in the ₹100 crore- ₹5,000 crore category, the characteristics of the balance sheets of two categories of corporates - very large (aggregate debt above ₹5,000 crore) and large (aggregate debt between ₹100 crore and ₹5,000 crore),5 were compared. In terms of the financial leverage metric, large corporates steadily deleveraged (Charts 6 and 7). With regard to corporates’ balance sheet liquidity in both these cohorts, clearly large corporates were liquidity rich, with cash and marketable securities exceeding 40 per cent of on-balance sheet debt in each of the lastfour years (Chart 8). Since corporates in the large segment are liquidity rich and thus could have limited credit requirements, this has implications for reviving the investment cycle given their significant share in wholesale credit. | C. Financial markets 1.20 The previous issue of the Financial Stability Report (FSR) posited that the IL&FS stress episode brought the NBFC sector under greater market discipline as the better performing companies continued to raise funds while those with asset liability management (ALM) and/or asset quality concerns were subjected to higher borrowing costs. Given the ongoing developments both in the NBFC and the housing finance sectors, the issue of NBFCs’ cost effective market access continuesto be relevant. Chart 1.25 plots the weighted interquartile difference6 in 3-month commercial paper (CP) yields of private NBFCs (including housing finance companies (HFCs)) and private non-financial corporates, all in the short-term rating grade of A1+. As can be seen in the chart, the distinction between the best and the rest is quite pronounced as measured by weighted inter-quartile differences both for NBFCs and non-financial obligors, although the NBFC spreads are marginally wider. However, such an estimate is only a lower estimate of risk aversion given that this analysis does not capture market exclusion. The spreads are choppy for non-financials but NBFC spreads show an increasing trend in FY 2019-20. While an increase in spreads possibly points to better screening capabilities notwithstanding the uniform rating across the spectrum of issuances, such differentiation is particularly pronounced for NBFCs when the number of NBFCs accessing market funding is large. The issue of spillovers of dislocation in the mutual funds to money market rates was discussed in the December 2018 FSR. While no liquidity regime can take care of investor aversion, the extant liquidity policy is conscious of such spillovers and is aimed at reducing volatility in spreads induced by such dislocations. The limitations of the role of the obligor rating in credit screening of short-term instruments is discussed in Box 3.3. 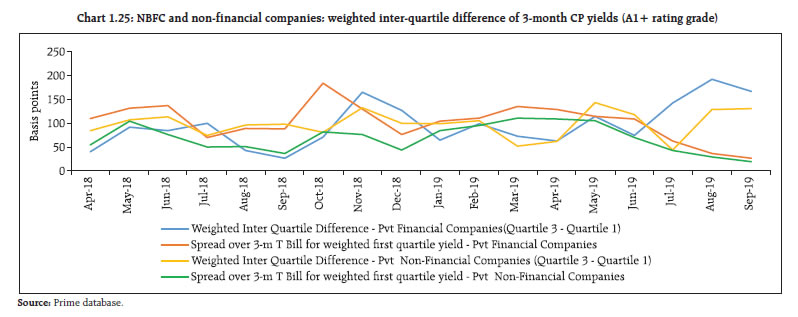
 1.21 Monetary transmission has assumed increasing importance globally as monetary headroom reduces with policy rates edging lower. A sustainable monetary transmission regime requires symmetric transmission of policy impulses to both assets and liabilities in banks' balance sheets. With the Basel liquidity regime incentivising stable retail deposits, a general rigidity in completely transmitting monetary impulses of lower rates to key deposit tenors is observed globally impacting the banking sector’s profitability. In the Indiancase, Chart 1.26 outlines the movement in policy rates and average deposit rates for 3-month ,1-year and 2-year tenors for five major public sector banks (PSBs). As can be seen in this chart, the shorter tenor rates appear more responsive to policy impulses while the longer tenor rate appears sticky and in a few instances moves contrary to the policy rate’s movements. Hence, there appears to be tenor specific rigidities on the liability side being guided by the idiosyncratic ALM positioning of individual institutions. 1.22 In this context, price of securities and embedding of information therein from other markets become relevant. Box 1.3 discusses a few recent experiences in this regard. Box 1.3: Are Indian bond markets efficiently assimilating information? In a financial market architecture wherein multiple instruments are traded in different segments, how well a particular segment assimilates information arising out of other segments has implications for informational efficiency. In order to gauge the extent of this informational efficiency, market price movements for bonds and equity (and hence imputed distance to default) for (i) a defaulted subsidiary of a core investment company and (ii) an institution currently undergoing resolution are considered. Charts 1 and 2 give the secondary market price and /or valuation price for the mutual fund portfolio of the debt issued by the respective obligors and plot the corresponding rating movements. They show that the valuation of debt is seen to be clearly a function of the ratings action with not so significant movement in prices till the investment grade threshold. Further resilience in price was observed even after the subsidiary in one of the cases was classified as‘default’ (Chart 1). This might be possible because of the ‘structured obligation’ embedded in the nature of the debt. On the other hand, equity prices in both the cases show adjustments both in the form of discrete jumps and continuous movements. Though all equity movements may not be of relevance for bond valuations since bonds are superior in terms of claim hierarchy, they still present an early sign of distress. Therefore, it may be useful as an early warning mechanism to convert equity prices to an imputed distance to default measure to which the actual bond prices should be compared. 
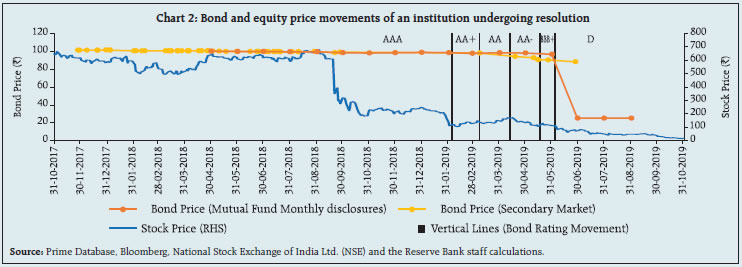
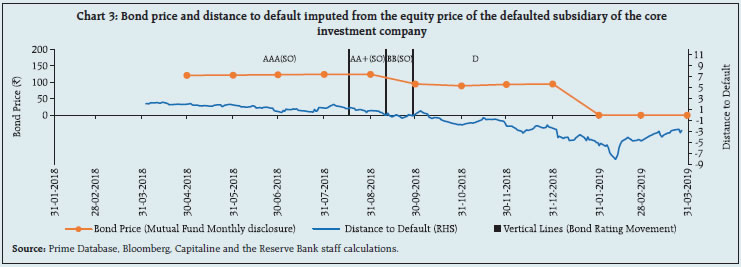
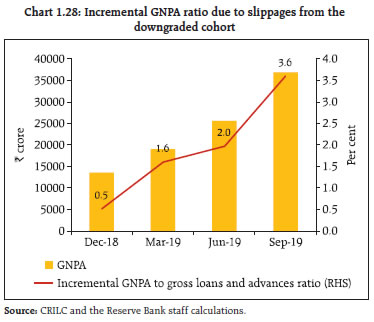
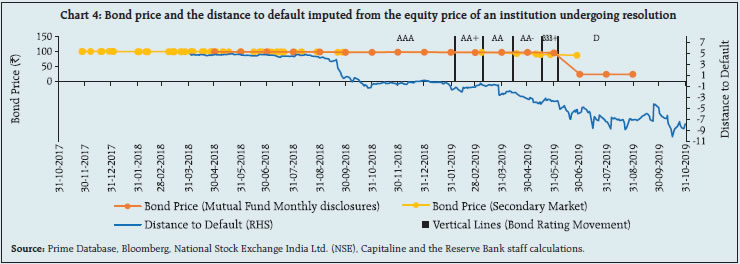 Charts 3 and 4 plot the imputed distance to default7 derived from equity prices and debt valuation. While equity prices and hence the imputed distance to default are volatile and move around a lot, comparing them to the rating agency’s actions in terms of default categorisation in both the cases shows that while in one case the rating agency’s action of recognition of the default was almost coterminous with feedback from equity markets, in the other case it was done considerably later. While comparing ‘through the cycle’ rating measure provided by rating agencies with the ‘point in time’ rating measure derived from equity prices may, prima facie, appears inconsistent, the issue being debated here is the efficiency of feedback and information assimilation across diverse markets which possibly shows gaps in information feedback across market segments. While the current analysis of using equity prices as an early warning signal only explores the case of a default, it can be useful in determining intermediate rating transitions. Such an approach is not without criticism since adjusting portfolios based on imputed ratings’ migration will entail false signals and over-reactions. Hence, to what extent such prices may be internalised for market valuation of debt instruments / prudential action is a debatable point. Yet, in a financial system where secondary markets in debt are illiquid at best, a relatively vibrant and active equity price is the only source of emerging information for all stakeholders including rating agencies. A prudential valuation plan for debt may be useful to take such emerging feedback into consideration. References: 1. Merton, R.C. (1974), On the pricing of corporate debt: the risk structure of interest rates. Journal of Finance 29: 449-70. 2. Bharath, S.T. and T. Shumway (2008), Forecasting default with the Merton Distance to Default model. Review of Financial Studies 21:1339-1369. | 1.23 The health of the corporate sector and its corresponding impact on banks’ balance sheets isan important issue. Chart 1.27 plots the long term bank loan rating momentum (quarterly upgrades versus downgrades) against the number of obligors. Clearly the rating momentum has been adverse since Q4:2018-19. Since ratings reflect the obligor’s “through- the-cycle” behaviour, the financial health of the recently downgraded corporates (April- September 2019) was tracked over the last four quarters to see its evolution. To put the numbers in perspective, they have been scaled in the relevant quarters by the standard assets outstanding at the end of the relevant quarters. 1.24 Further, to study the economic impairment in the cohort of the obligors that are downgraded, payment records as reflected in the books of the banks for this cohort of obligors were tracked in two ways. First, the slippage to default for any obligorsince December 2018 was tracked (Chart 1.28). In addition, for standard obligors, the evolution of their accounts in the banks’ books was tracked since September 2018 (Chart 1.29). The slippage to default from the downgraded category (incremental GNPA) possibly points to the lagging nature of the ‘past due’ norm-based default classification as compared to the expected weakness based classification. The general reduction in the proportion of “Standard - zero day past due” (Standard_0_dpd) category since September 2018 also points to possible vulnerabilities in the cohort. To conclude, the recent adverse rating momentum in the case of some borrowers from the banking sector, though supposed to be precautionary actions, seem to reflect their already weakening financials. 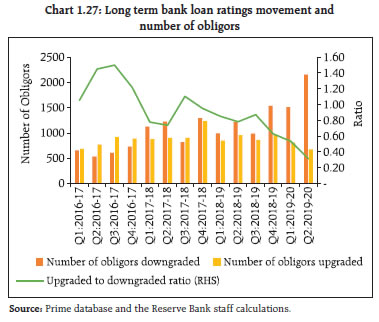
 1.25 While the previous analysis pertains to the downgraded portfolio of the wholesale book of banks (> ₹5 crore), the impact of such downgrades has to be seen in the context of the wholesale loan books of private sector obligors which are currently classified as performing and have an outstandingexternal rating. In Chart 1.30 it can be seen that the ‘vulnerable spectrum,’ that is, BBB and below in the aggregate portfolio, declined from an aggregate exposure of ₹10.17 lakh crore in September 2018 to ₹8.53 lakh crore as on September 2019, which is also reflected in an improvement in the average risk weight8 of the portfolio – an encouraging sign that lenders are taking better informed decisions after the recent events.
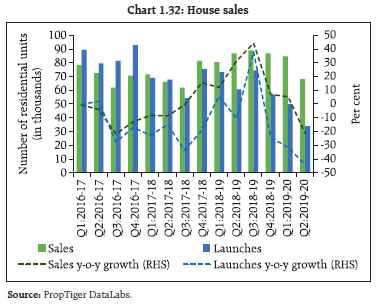
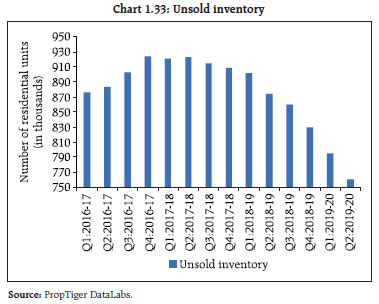
Trends in residential property markets 1.26 Housing market activity remained muted in the first half of FY 2019-20. Major markets recorded softening of house prices in the last oneyear (Chart 1.31) although such softening has notled to any buoyancy in sales as yet (Chart 1.32). The implementation of the Real Estate (Regulation and Development) Act (RERA)9 brought about a certain discipline and consumer safeguards in the housing market specifically with regard to funding of new housing projects and this resulted in real estate companies becoming more cautious about new launches in the short run. The setback to the sector on account of RERA is expected to be transitory even as it brought about funding discipline and end-use restrictions of advance money from home buyers, thus preventing diversion of such advance money to other projects/activities. Issues of access to funding faced by realtors were brought into sharp focus following the adverse developments in the non-bank funding channels post IL&FS event. Consequently, new house launches fell sharply, although unsold inventory is at a multi-year low(Charts 1.32 and 1.33). Despite the government’s measures to infuse liquidity, in the backdrop of subdued market conditions, expectations of price adjustments are keeping consumer demand muted, which is adversely impacting real estate activities. 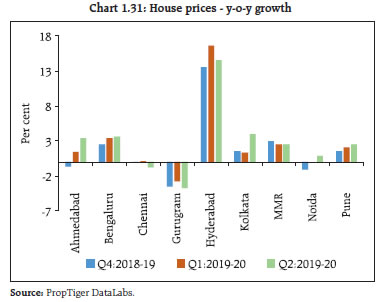
 Systemic Risk Survey10 1.27 In the latest systemic risk survey (SRS), all major risk groups viz., global risks, risk perceptions on macroeconomic conditions, financial market risks and institutional positions were perceived as medium risks affecting the financial system. However, the perception of domestic growth risk, fiscal risk, corporate sector risk and banks’ asset quality risk increased between the earlier survey (April 2019) and the current survey (October 2019). About 32 per cent of the respondents felt that the Indian banking sector’s prospects are going to improve marginally in the next one year while 25 per cent of the respondents felt that the prospects are going to deteriorate marginally. Participants were of the opinion that resolution of the legacy bad assets under the Insolvency and Bankruptcy Code (IBC) is essential to enable the banking system to support the aspirations of economic growth.
|