The global economy has picked up steam and the growth momentum appears sustainable. Notwithstanding efforts to normalise monetary policy by the Federal Reserve and the Bank of England, financial conditions in the advanced economies remain accommodative. The commodities space is firming up and increased geopolitical risks imply likely volatility in commodity prices. In the emerging market context, exports are growing at their fastest clip in six years on the back of a pick-up in global growth. On the domestic front, gross value added (GVA) rebounded in 2017-18:Q2 after initial hiccups associated with the rollout of the nationwide goods and services tax (GST) coming on the back of demonetisation. The ongoing deleveraging in the heavily indebted parts of the corporate sector and credit growth in public sector banks (PSBs) present a downside risk to growth. The overall investment climate remains challenging though the situation has shown improvement since 2017-18:Q1. The positive signals of improvement – ‘the decline in number and cost of stalled projects in 2017-18:Q2’, ‘the efforts to improve the quality of government expenditure’, ‘ease of doing business ranking’, ‘India’s sovereign rating upgrade by Moody’s’ and the ‘bank recapitalisation announcement’ are expected to provide a significant fillip to investment sentiments in the coming quarters. Global backdrop Economy and trade 1.1 According to the World Economic Outlook (October 2017 update), the global output is projected to expand by 3.6 per cent in 2017 and 3.7 per cent in 2018 on the back of a pick-up in investments, trade and industrial production (Chart 1.1). While falling energy prices in 2017:H1 boosted household demand, the global energy prices rebounding to their highest level in two years make the risk of reversal of household purchasing power significant. Nevertheless, improved global fundamentals with a broad-based growth outlook for both advanced and emerging economies provide a significant buffer to growth risk. In contrast, heightened geopolitical risks and still unclear contours of the US tax reform have the potential to adversely affect elevated market valuations and dampen the growth momentum. 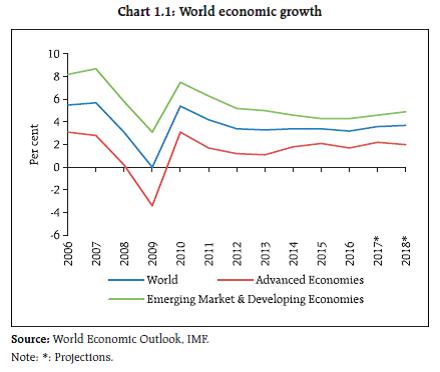 1.2 Looking at the advanced economies (AEs), the US real gross domestic product (GDP) increased at an annual rate of 3.3 per cent in 2017:Q3, due to higher personal consumption expenditure, non-residential fixed investments and the federal government’s spending. The US economy’s performance is comforting, notwithstanding its low productivity growth and a slowly ageing population. The Euro area also maintained its pace of expansion in 2017:Q3, growing at an annual rate of 2.6 per cent which makes it one of its best performances in a decade. Germany expanded by 2.8 per cent, while growth in Italy accelerated to 1.7 per cent, its best performance since 2010. Japan grew at a faster-than-expected 2.5 per cent in 2017:Q3 on account of strong export growth overcoming weak domestic demand. Overall, there is a perceptible momentum in terms of the geographical spread of the growth, lending support to an above average global growth rate. 1.3 In the emerging market economies (EMEs), exports are growing at their fastest pace in six years; these are being aided by a pick-up in global economic growth. With unit prices for exports rising, thanks to an ongoing recovery in commodity prices from last year’s lows, 2017 looks set to be the most positive year for emerging market exporters since 2011 (Box 1.1). According to the World Trade Organisation (WTO), trade growth is becoming more synchronised across regions than it had been for many years (Chart 1.2). Box 1.1: Commodity prices and Geopolitical risks According to the recent Organisation of the Petroleum Exporting Countries (OPEC) monthly oil market report, in October 2017 the OPEC Reference Basket1 reached the highest value in more than two-and- a-half years. Crude futures also reached levels not seen since mid-2015. The US Energy Information Administration expects the current price movement to improve US shale oil production and estimates it to reach a record 6.17 million barrels per day (mbpd) by December 2017. The International Energy Agency (IEA) expects non-OPEC supply to increase by 1.4 mbpd in 2018. The global oil market demand-supply balance is, however, subject to some debate. According to the OPEC report, the global oil market is set to show a deficit of around 0.80 mbpd in 2018 assuming that OPEC production remains constant. IEA, on the other hand, believes that global oil demand will grow by 1.3 mbpd in 2018, which will be more than offset by the increase in non-OPEC supplies. IEA also envisages a balanced oil market in 2017:Q4 and rise in oil inventories in the first half of 2018. Base metals also continued with their rally in the recent period (Chart I) as Chinese supply curbs due to environmental regulations contributed to a supply squeeze. Yet, commodity market pricing risks cannot be completely hypothesised by a demand-supply imbalance. Considering that the supply of some of the critical commodities also comes from some of the most volatile regions of the world, the effect of geo-political events on commodity prices can be sharp, non-linear and persistent. Interestingly, geopolitical risks upsetting the current ‘high valuation, low volatility’ regime has also been formally captured in Caballero and Simsek (2017). The authors posit that the current equilibrium in asset markets is seemingly happening with high valuations, low interest rates and a high equity risk premium but it is also happening in an environment of record low levels of realised volatility. Such an equilibrium does require a rather high Sharpe ratio2 to generate the asset valuations that are currently prevalent. This makes the global economy particularly susceptible to persistent spikes in asset price volatility. They hypothesise that volatility could arise due to a technical market correction, a recession or a geopolitical event, the first two of which they rule out in the current environment. Hence, they are left with ‘….a significant geopolitical event as the most likely source of a destabilising volatility spike.’ As a consequence, a simultaneous sharp movement in asset and commodity markets can have self-reinforcing feedbacks making emerging markets particularly vulnerable. 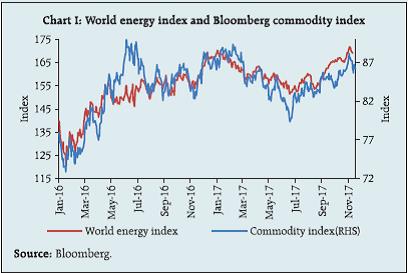 Reference: 1. Caballero, Ricardo and Alp Simsek (2017), ‘Risk intolerance and the global economy: A new macroeconomic framework’, available at: http://voxeu.org/article/risk-intolerance-and-global-economy 2. OPEC (2017), OPEC Monthly Oil Market Report, November 13. Available at:
http://www.opec.org/opec_web/static_files_project/media/downloads/publications/OPEC%20MOMR%20November%202017.pdf 3. IEA (2017), IEA Monthly Oil Market Report, November available at : www.iea.org/oilmarketreport/omrpublic | 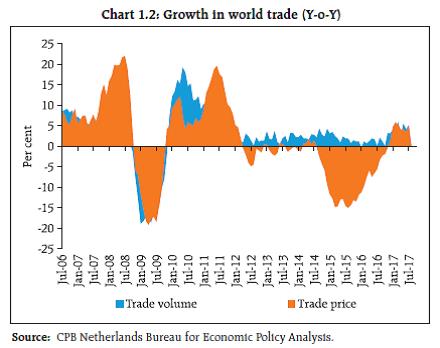 1.4 In terms of structural change, the information technology-led growth is possibly making the world a lot more unequal, thereby challenging the post-World War II political economies across the world. The increasing returns to scale inherent in the information technology industry have made technology giants progressively more dominant. There is a significant shift of wealth from tangibles to intangibles. In this context, the declining wage share of GDP in AEs is likely to have implications for their political economies (Chart 1.3). As regards emerging market and developing economies, the International Labour Organisation (ILO) finds that in many of these countries the decline in the labour income share is even more pronounced than in advanced economies, with considerable declines in Asia and North Africa. The wage shares in Latin America are more stable but still declining3. This requires sustained policy attention. Capital flows and the rate markets 1.5 While the Euro area as a whole is showing remarkable ‘across the board recovery,’ the general impact of Euro zone growth on the ‘global savings glut’ (Chart 1.4) and hence on global savings imbalances may not be insignificant since it requires the rest of the world to run current account deficits so as to absorb such a significant savings pool, on a sustainable basis. Yet among the major economies of the rest of the world, an ageing Japan has large and increasing current account surplus; in the UK domestic demand is increasingly affected by Brexit related transition issues; and while US domestic demand and consequent current account deficit is large, such a large deficit is being increasingly subjected to bilateral trade negotiations. 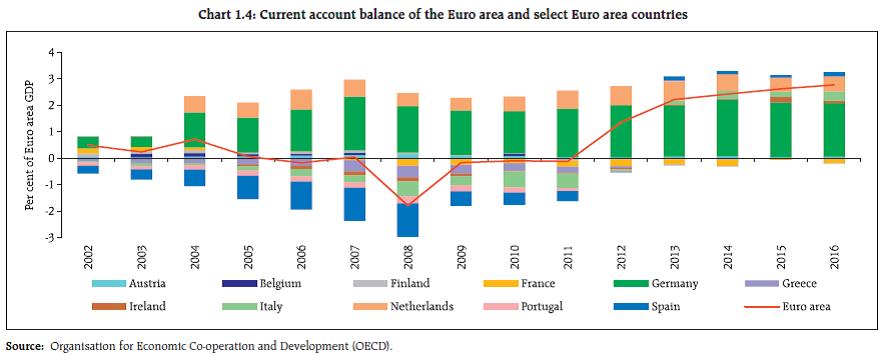 1.6 Capital flows since the taper tantrum to five large Asian economies, ex-China, seem to reflect country-specific pull factors (Chart 1.5). Going forward, it is expected that non-resident investors will continue to differentiate the countries on the basis of fundamentals, structural reforms and political outlook. In India, bank-related headwinds are expected to wane in the wake of planned recapitalisation package and this should strengthen capital inflows. 1.7 Financial conditions in AEs remained accommodative so far (Chart 1.6), though they may turn relatively tighter in the UK and the US. Going forward, ECB’s policy stance may continue to remain accommodative. While the financial condition in Asia remains accommodative, it may reverse given the rising commodity prices. With the monetary policy stance of central banks in AEs at considerable variance, the mechanism to condition market expectations of policy paths remains a communication challenge (Box 1.2).  Box 1.2: When a Central Bank talks…… Over the past few decades, central banks have dramatically rewritten the script of how they talk to the financial market and to the public at large. Starting from opacity in communicating even the policy rates to the current evolution to forward guidance, central bank communication has seen a remarkable transformation with researchers currently taking the help of artificial intelligence (AI) to decipher the minds of central bankers through their facial expressions (non-verbal communication). But is this transformation too much of a good thing? In the context of forward guidance, Hyun Shin (2013) warns of committing a ‘category mistake.’ Shin argues that in most discussions of central banks’ forward guidance, the market is treated as a representative agent with whom central banks can sit down and reason i.e., central banks ignore the heterogeneity of the market agents. Stein (2014) draws on this insight to explain taper tantrums. He posits that even in a market with reasonable median expectations, it is the behaviour of the most optimistic investors rather than that of the moderates that drives the prices as they are the ones most willing to take large positions based on their beliefs. Moreover, this optimism can motivate them to leverage their positions aggressively. In such circumstances central banks’ communication that merely ‘clarifies things – that is, one that delivers the median market expectation but truncates some of the more extreme possibilities can have powerful effects. Highly levered optimists are forced to unwind their positions, which then must be absorbed by other investors with lower valuations. This effect is likely to be amplified if the preannouncement period was one with unusually low volatility…’ Moreover, transparency over the path of future policy rates is seen as a device to manipulate long rates. And crucially, such manipulation is seen as something amenable to fine-tuning. But by committing to such an action, Shin believes that the central banks are in danger of committing ‘…a category mistake where we anthropomorphize the “market” as a rational individual with beliefs…’. He also observes that communication being a two-way street (talking and listening), it is more comprehensive to explore the balance between talking and listening rather than examining them in isolation. Shin claims a trade-off between talking and listening with more of one implying less of the other, i.e., if central banks talk more, they should listen less, else they risk finding themselves confined in an ‘echo chamber of their own making, acting on market signals that are echoes of their own pronouncements…’ However, since central banks matter far too much in the lives of ordinary people, they cannot totally opt out of communication channels; moreover, ‘the more the central bank whispers in order not to upset markets, the more market participants lean in to hear better’ (Stein, 2014). Fed Chair Janet Yellen recently mentioned an interesting perspective on differing information needs. According to her, while market participants’ demand for information about the policy path generally exceeds central banks’ desire to provide it, the broader public is satisfied with periodic reinforcement of central bank commitment to inflation objectives. Nevertheless, Shin feels that listening by central banks has been an underappreciated virtue. References: 1. Shin, Hyun Song (2013), ‘Commentary on Robert E. Hall ‘The Routes into and out of the Zero Lower Bound,” speech delivered at “Global Dimensions of Unconventional Monetary Policy,’ the Federal Reserve Bank of Kansas City, Jackson Hole, Wyo., August 22-24, 2013 pp. 8-9. 2. Shin, Hyun Song (2017), ‘Can central banks talk too much?’, speech at the ECB conference on ‘Communications challenges for policy effectiveness, accountability and reputation,’ Frankfurt, November 14. 3. Stein, Jeremy C (2014), ‘Challenges for Monetary Policy Communication’, speech at the Money Marketeers of New York University, New York, May 6. 4. Yellen, Janet (2017), ‘At the heart of policy: challenges and opportunities of central bank communication’ – policy panel at the ECB conference on ‘Central Bank Communication,’ Frankfurt, November 14. | 1.8 In the meantime, the recent hardening of US interest rates and movement in commodity prices has led to a gradual upward shift in US long term rates. However, while the high yield bond yield is off the lows (notwithstanding a gradual reduction in duration), there is no discernible trend in the reversion of risk appetite (Chart 1.7). Domestic economy Domestic macro-financial developments 1.9 India’s gross domestic product (GDP) growth rebounded to 6.3 per cent in 2017-18:Q2 from 5.7 per cent since 2017-18:Q1 (Chart 1.8a) after the initial hiccups associated with the rollout of nation-wide goods and services tax (GST), coming on the back of demonetisation. Gross value added (GVA) also posted 6.1 per cent rise in 2017-18:Q2 from 5.6 per cent in previous quarter (Chart 1.8b). 1.10 The ongoing deleveraging in the heavily indebted parts of the corporate sector and muted credit growth in public sector banks (PSBs) pose a risk to growth. Subdued credit, which may also be a consequence of thin capital buffers of PSBs, leads to lower investments in the economy. Credit growth in major sectors as well as industries has witnessed a decline4 over the past two years (Chart 1.9). Personal loans remain a bright spot in an otherwise muted credit growth environment. It is expected that the recent recapitalisation move for PSBs will give a significant fillip to credit growth. 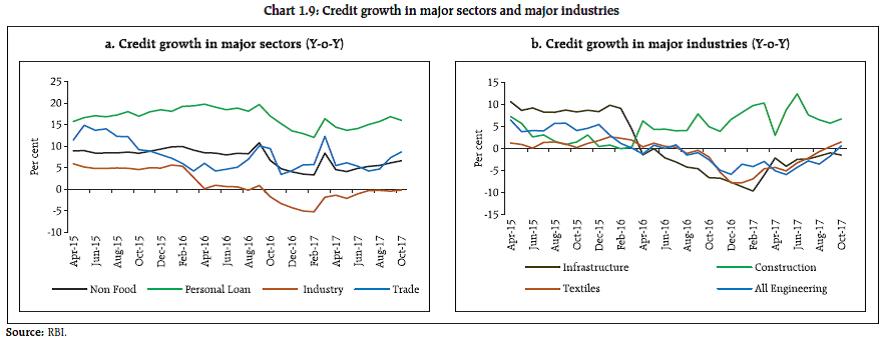 1.11 Investment demand, as measured by gross fixed capital formation (GFCF), remained depressed with its share in GDP declining from 34.3 per cent in 2011-12 to 29.5 per cent in 2016-17 (Chart 1.10). Investments exhibited a slender recovery in 2017-18:Q1. According to the Centre for Monitoring Indian Economy (CMIE), new investment proposals significantly declined in 2017-18:Q2 in terms of both numbers and value (Chart 1.11a). However, the number and cost of stalled projects reported in 2017-18:Q2 (Chart 1.11b) showed a decline.
1.12 The quality of government expenditure has shown signs of improvement in recent years (Chart 1.12). While public sector undertakings (PSUs5) increased their investments, this stretched their leverage (Chart 1.13). The recapitalisation plan for the banking sector is likely to boost investment growth going forward.
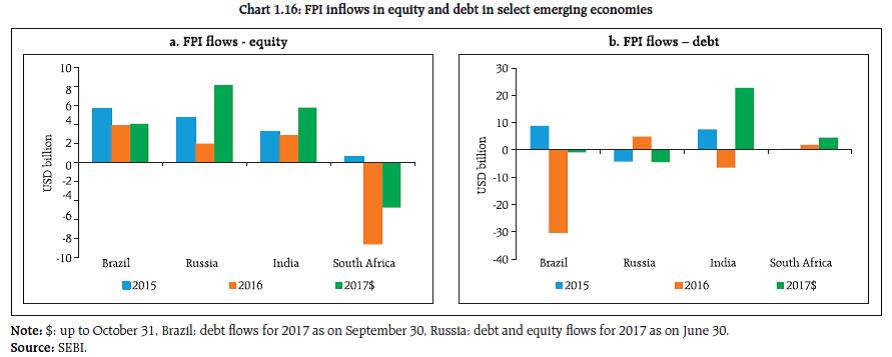
External sector 1.13 Against the backdrop of improving global trade, the recovery in the growth of Indian merchandise exports is underway. After registering negative growth for seven consecutive quarters, exports have been growing since 2016-17:Q3 (Chart 1.14a). Merchandise import growth which has been higher than export growth in the recent past (Chart 1.14b) appears to have converged as per the latest data. While the trade deficit moderated in 2017-18:Q2 from its level in the previous quarter, sustained higher growth in imports relative to exports against the backdrop of a rebound in oil price potentially reduces the external sector’s resilience. Financial markets 1.14 The significant increase in liquidity in financial markets in the wake of demonetisation has led to unprecedented fund flows to both equity and debt mutual funds (Chart 1.15a). Foreign portfolio investment (FPI6) flows into the capital market also remained buoyant with a greater preference for debt (Chart 1.15b), until recently. Among BRICS nations (ex-China), India received the second highest FPI equity flows during January to October 2017, following Russia (Chart 1.16a). India experienced the highest FPI inflows in the debt segment (Chart 1.16b). 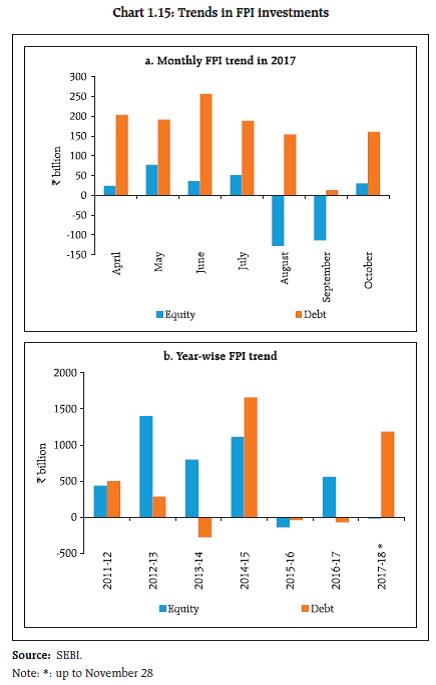
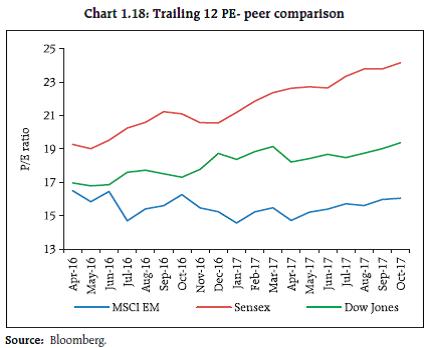
 1.15 In the capital market, the relative movement in earnings-per-share (EPS) estimates of Sensex vis-à-vis MSCI Asia Pacific index shows a relative downgrade of approximately 11 per cent for Sensex as compared to an upgrade of about 4 per cent for MSCI Asia Pacific7 (Chart 1.17a). Sectoral forward earnings (2017-18) estimates of Asia-Pacific companies vis-à-vis India show better performance of Indian corporates in major domestic-focused sectors (Chart 1.17b). On trailing PE based measures Indian valuation continues to outpace its Asian peers (Chart 1.18). 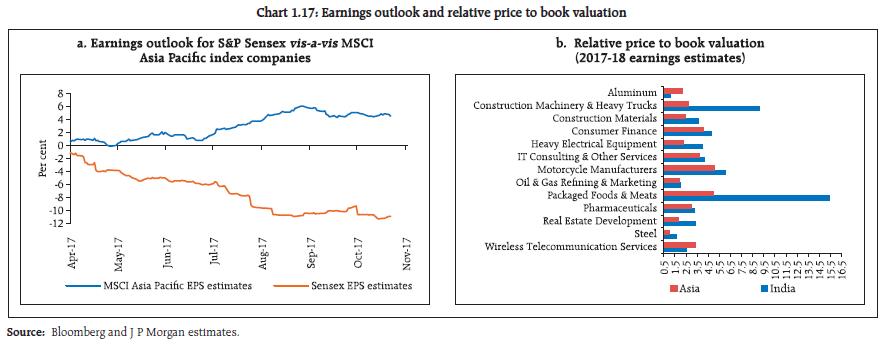
 1.16 Given the significant increase in the mutual funds’ (MFs) corpus and an excess monthly return of almost 250 bps (annualised) from a representative money market fund over the Clearing Corporation of India Ltd. (CCIL) liquid T-bill benchmark8, there seems to be some risk migration from the banks to the mutual funds. On a different scale, the top-5 fund houses contributed approximately 50 per cent of the aggregate corpus of liquid and money market mutual funds (MMMFs). 1.17 Another manifestation of the swelling MF corpus and consequent investment in corporate bonds is a gradual contraction in higher rated corporate bond spreads9 (Chart 1.19). The unexpected rise in BBB corporate spreads maybe on account of lack of liquidity in lower rated corporates in the wake of demonetisation and a consequent revision in the spread determination methodology for such rating grades. 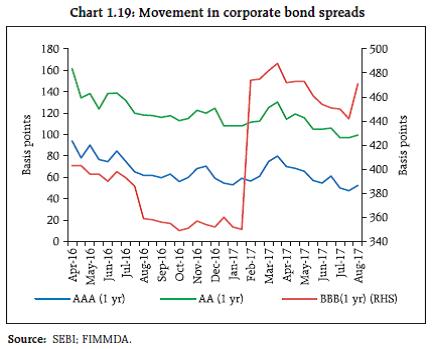 1.18 A significant differential between the risk-free rate (T-bill yield) and bank Marginal Cost of Funds based Lending Rate (MCLR10) expands the scope for disintermediation of bank financing by corporate bonds in case of quality corporates; the corporates might find it advantageous to place issues with MFs rather than accessing bank finance (Table 1.1). The table shows that bank financing is competitive below the rating grade ‘AA-’ based on recent FIMMDA valuation (August 2017)11. Such disintermediation trends are consistent across tenors as can also be seen from Table 1.112. To stem the erosion in the quality of credit portfolios, some of the well-capitalised banks have reportedly started resorting to risk-free benchmark based pricing as opposed to MCLR linked pricing. | Table 1.1: MCLR and corporate yields | Tenor
(years) | Risk Free rate | Yields | Reference MCLR (annualised) | | AAA | AA+ | AA | AA- | A+ | A | A- | | 1 | 6.21 | 6.99 | 7.32 | 7.57 | 7.68 | 8.43 | 9.43 | 9.68 | 8.30 | | 2 | 6.39 | 7.19 | 7.45 | 7.66 | 7.84 | 8.59 | 9.59 | 9.84 | 8.41 | | 3 | 6.52 | 7.26 | 7.57 | 7.75 | 8 | 8.75 | 9.75 | 10 | 8.41 | | 4 | 6.55 | 7.32 | 7.64 | 7.83 | 8.1 | 8.85 | 9.85 | 10.1 | 8.41 | | 5 | 6.57 | 7.39 | 7.7 | 7.9 | 8.2 | 8.95 | 9.95 | 10.2 | 8.41 | | Source: FIMMDA and RBI staff estimates. | 1.19 The effects of pervasive domestic liquidity in financial markets following demonetisation and abundant liquidity induced as a result of foreign exchange operations have pushed down borrowing costs for higher rated Indian corporates. The risk appetite in FPIs for unhedged government and corporate bond exposure has also increased (Chart 1.20a). The recent upgrade in India’s sovereign rating by Moody’s implies that Indian corporates’ dollar borrowing cost is likely to remain benign. However, there has been a slight firming of long term yields in domestic debt markets (Chart 1.20b). Implied volatility in foreign exchange options in the shorter tenure has also shown some upward movement (Chart 1.20c). Finally the significant build up in offshore index futures13 relative to onshore can have spillover effects to related onshore markets during times of stress (Chart 1.20d and 1.20e). House prices 1.20 The all-India residential property price index (RPPI) rose by 8.7 per cent in 2017-18:Q1 as compared to 7.3 per cent growth in the corresponding quarter of the previous year (Chart 1.21). The gross non-performing advances (GNPAs) ratio for housing finance assets remained flat at 1.55 per cent in September 201714. The retail housing segment does not appear to pose any significant systemic risks in the Indian context at present.
|