The business of scheduled commercial banks (SCBs) remained subdued mainly due to the muted performance of public sector banks (PSBs). The asset quality of banks deteriorated further between March and September 2016. PSBs continued to record the lowest capital to risk-weighted assets ratio (CRAR) among the bank groups with negative returns on their assets. The banking stability indicator shows that the risks to the banking sector remained elevated due to continuous deterioration in asset quality, low profitability and liquidity. Given the higher levels of impairment, SCBs may remain risk averse in the near future as they clean up their balance sheets and their capital position may remain insufficient to support higher credit growth. Stress tests of SCBs show that their GNPA ratio may increase further if macroeconomic conditions deteriorate sharply. The asset quality of scheduled urban co-operative banks (SUCBs) as well as non-banking financial companies (NBFCs) deteriorated. The capital adequacy of SUCBs, however, improved marginally. Section I Scheduled commercial banks1 2.1 In this section, the soundness and resilience of scheduled commercial banks (SCBs)2 is discussed under two broad sub-heads: i) performance on functional aspects and ii) resilience using macro-stress tests through scenarios and single factor sensitivity analyses. Performance 2.2 SCBs’ business growth continued to be subdued with public sector banks (PSBs) continuing to lag behind their private sector peers. Overall, capital adequacy in terms of capital to risk-weighted assets ratio (CRAR) remained unchanged at 13.3 per cent, whereas, the Tier-I leverage ratio3 at the system level increased marginally between March and September 2016. System level profit after tax (PAT) contracted on y-o-y basis in the first half of 2016-17 due to higher growth in risk provisions, loan write-off and decline in net interest income (NII). PSBs as a group continued to record losses. SCBs’ return on assets (RoA) marginally improved to 0.4 per cent from 0.3 per cent and return on equity (RoE) increased to 5.0 per cent from 3.2 per cent between March and September 2016 (Chart 2.1). Asset quality 2.3 The asset quality of banks deteriorated further. The gross non-performing advances (GNPAs) ratio of SCBs increased to 9.1 per cent from 7.8 per cent between March and September 2016, pushing the overall stressed advances4 ratio to 12.3 per cent from 11.5 per cent (Chart 2.2). Given the higher levels of impairment, SCBs may remain risk averse in the near future as they clean up their balance sheets and their capital position may remain insufficient to support higher credit growth. Credit quality of large borrowers5 2.4 The asset quality of large borrowers deteriorated significantly. The share of special mention accounts6 (SMA)-2 increased across bank-groups. The share of large borrowers’ in SCBs’ total loan portfolio declined between March and September 2016, whereas, their share in GNPAs increased during the same period (Chart 2.3). Risks Banking stability indicator 2.5 The banking stability indicator (BSI)7 shows that the risks to the banking sector remained elevated since the publication of the last FSR.8 Though the soundness of banks reflecting their capital position improved further, continuous deterioration in their asset quality, low profitability and liquidity contributed to the high level of overall risk (Charts 2.4 and 2.5). Resilience – Stress tests Macro stress test-Credit risk9 2.6 The resilience of the Indian banking system against macroeconomic shocks was tested through a series of macro stress tests for credit risk at system, bank group and sectoral levels. These tests encompassed assumed risk scenarios incorporating a baseline and two (medium and severe) adverse macroeconomic risk scenarios (Chart 2.6). The adverse scenarios were derived based on standard deviations of the historical values of the macroeconomic variable: up to 1 standard deviation (SD) for medium risk and 1.25 to 2 SD for severe risk (10 years historical data).
System level credit risk 2.7 The stress test indicated that under the baseline scenario, the GNPA ratio may increase from 9.1 per cent in September 2016 to 9.8 per cent by March 2017 and further to 10.1 per cent by March 2018. If the macroeconomic conditions deteriorate, the GNPA ratio may increase further under such consequential stress scenarios. However, the system level CRAR may remain above the required regulatory minimum (Chart 2.7). Bank group level credit risk 2.8 Among the bank groups, PSBs may continue to register the highest GNPA ratio. Under baseline scenario, the PSBs’ GNPA ratio may increase to 12.5 per cent in March 2017 and then to 12.9 per cent in March 2018 from 11.8 per cent in September 2016, which could increase further under a severe stress scenario. PSBs may continue to record the lowest CRAR among bank groups (Chart 2.8).
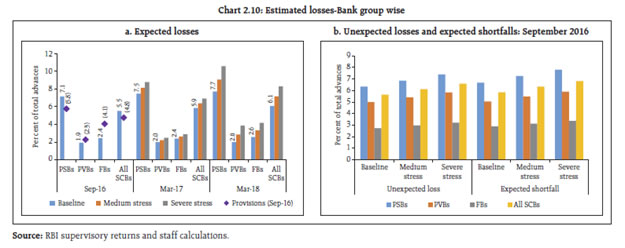
Sectoral credit risk 2.9 A macro-stress test of sectoral credit risk reveals that among the select seven sectors, iron and steel is expected to register the highest GNPAs followed by construction and engineering in March 2017 as well as in March 2018 under the baseline scenario (Chart 2.9). Estimation of losses11 for credit risk: Provisioning and capital adequacy 2.10 Extant provisions12 as per cent of their total advances – 5.8 per cent for PSBs, 2.3 per cent for PVBs and 4.1 per cent for FBs as of September 2016 – seem to be insufficient to meet expected losses (ELs) under stress scenarios. Specifically, PSBs need to further increase their provisioning levels to meet the ELs arising from credit risk, under baseline and adverse macroeconomic risk scenarios. However, the present level of total capital13 (Tier-I plus Tier-II) as per cent of total advances across bank groups is expected to be sufficient to meet estimated unexpected losses (ULs) and expected shortfalls (ESs) arising from credit risk, even under severe macroeconomic stress conditions (Chart 2.10). 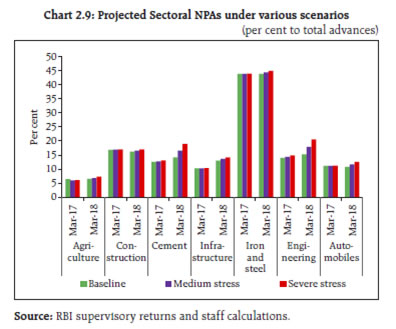
 2.11 The bank-wise14 estimation of ELs and ULs arising from credit risk shows that 33 banks, which had a 74 per cent share in the total advances of the select 60 banks, may be unable to meet their ELs with their existing provisions. On the other hand, six banks (with a 7 per cent share in the total advances of the select banks) were estimated to have ULs exceeding their total capital (Chart 2.11). Sensitivity analysis: Bank level15 2.12 Single factor sensitivity stress tests16 (top-down) were carried out on SCBs17 to assess their vulnerabilities and resilience under various scenarios.18 SCBs’ resilience with respect to credit, interest rate and liquidity risks was studied by imparting extreme but plausible shocks. The results are based on September 2016 data. Credit risk 2.13 A severe credit shock is likely to impact capital adequacy and profitability of a significant number of banks. The impact of various static credit shocks for banks showed that system level CRAR will remain above the required minimum of 9 per cent. Under a severe shock of 3 SD19 (that is, if the average GNPA ratio of 60 select SCBs moves up to 15.3 per cent from 9.3 per cent), the system level CRAR and Tier-1 CRAR will decline to 10.6 per cent and 8.0 per cent respectively. At the individual bank-level, the stress test results show that 23 banks having a share of 40.7 per cent of SCBs’ total assets might fail to maintain the required CRAR under such severe shock. PSBs were found to be severely impacted with the CRAR of 20 PSBs likely to go down below 9 per cent (Charts 2.12 and 2.13).
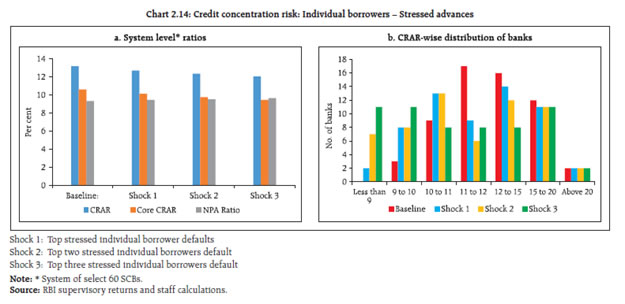
Credit concentration risk 2.14 Stress tests on banks’ credit concentration risks, considering top individual borrowers according to their stressed advances showed that the impact20 (under three different scenarios) was significant for 11 banks, comprising about 13.5 per cent of the assets, which may fail to maintain 9 per cent CRAR in at least one of the scenarios. The impact could be 63 per cent of profit before tax (PBT) under the scenario of a default by the topmost stressed borrower and 112 per cent in case the top two stressed borrowers fail. The impact on CRAR at the system level under the assumed scenarios of failure of the top one, two and three stressed borrowers will be 46, 83 and 112 basis points (Chart 2.14). 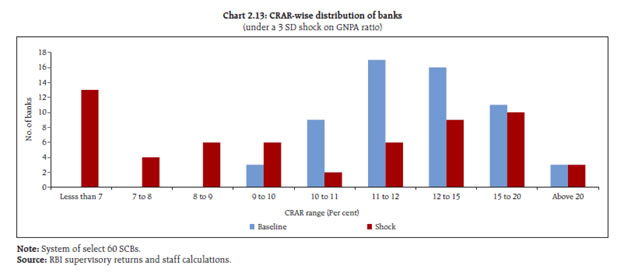
 2.15 Stress tests on banks’ credit concentration risks, considering top individual borrowers according to their exposures, showed that the impact21 (under three different scenarios) was significant for three banks, comprising about 3.9 per cent of the assets, as they may fail to maintain 9 per cent CRAR in at least one of the scenarios. The losses could be 37 per cent of PBT under the scenario of a default by the topmost individual borrower and 59 per cent in case the top two individual borrowers default. The impact on CRAR at the system level under the assumed scenarios of default of the top three individual borrowers will be 56 basis points (Chart 2.15). 2.16 Stress tests using 10 different scenarios, based on the information of group borrowers reveal that the losses could be around 5 per cent and 9 per cent of the capital at the system level under the assumed scenarios of default22 by the top group borrower and by the top two group borrowers. As many as 22 banks will not be able to maintain their CRAR at 9 per cent if top 10 group borrowers default (Table 2.1). 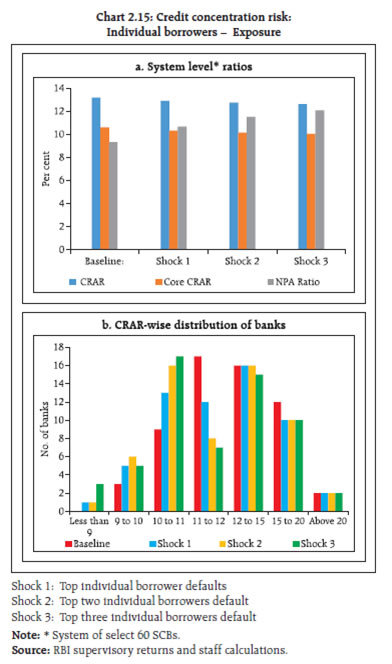
| Table 2.1: Credit concentration risk: Group borrowers – Exposure | | Shocks | System level* | Bank level | | CRAR | Core CRAR | NPA ratio | Losses as % of capital | Impacted banks (CRAR < 9%) | | Baseline (Before shock) | 13.2 | 10.6 | 9.3 | --- | No. of banks | Share in total assets of SCBs (in %) | | Shock 1 | The top 1 group borrower defaults | 12.6 | 10.0 | 12.4 | 5.1 | 2 | 0.2 | | Shock 2 | The top 2 group borrowers default | 12.1 | 9.5 | 14.6 | 8.8 | 5 | 4.9 | | Shock 3 | The top 3 group borrowers default | 11.7 | 9.1 | 16.5 | 12.0 | 8 | 9.7 | | Shock 4 | The top 4 group borrowers default | 11.4 | 8.8 | 18.1 | 14.7 | 10 | 11.0 | | Shock 5 | The top 5 group borrowers default | 11.1 | 8.5 | 19.6 | 17.2 | 12 | 16.2 | | Shock 6 | The top 6 group borrowers default | 10.8 | 8.2 | 20.8 | 19.3 | 15 | 18.4 | | Shock 7 | The top 7 group borrowers default | 10.6 | 8.0 | 21.9 | 21.0 | 17 | 22.8 | | Shock 8 | The top 8 group borrowers default | 10.4 | 7.8 | 22.7 | 22.4 | 20 | 28.2 | | Shock 9 | The top 9 group borrowers default | 10.3 | 7.7 | 23.4 | 23.6 | 21 | 28.8 | | Shock 10 | The top 10 group borrowers default | 10.3 | 7.7 | 23.7 | 24.2 | 22 | 29.5 | Note: * System of select 60 SCBs.
Source: RBI supervisory returns and staff calculations. | Sectoral credit risk 2.17 Credit risk arising from exposure to the infrastructure sector (specifically power, transport and telecommunications) was examined through a sectoral credit stress test where GNPA ratio of the sector was assumed to increase by a fixed percentage point impacting the overall GNPA ratio of the banking system. The results showed that shocks to the infrastructure segment will impact the profitability of banks considerably, with the most significant effect of the single factor shock being on the power and transport sectors (Chart 2.16). Interest rate risk 2.18 For investments under available for sale (AFS) and held for trading (HFT) categories (direct impact) a parallel upward shift of 2.5 percentage points in the yield curve will lower the CRAR by about 94 basis points at the system level (Table 2.2). At the disaggregated level, five banks accounting for 4.7 per cent of the total assets were impacted adversely and their CRAR fell below 9 per cent. The total loss of capital at the system level is estimated to be about 8.1 per cent. The assumed shock of a 2.5 percentage points parallel upward shift of the yield curve on the held to maturity (HTM) portfolios of banks, if marked-to-market, will reduce the CRAR by about 281 basis points resulting in 23 banks’ CRAR falling below 9 per cent. The income impact on SCBs’ banking books23 could be about 29 per cent of their latest annual PBT under the assumed shock of a parallel downward shift of 2.5 percentage points in the yield curve.24 Liquidity risk 2.19 The liquidity risk analysis aims to capture the impact of deposit run-offs and increased demand for the unutilised portions of credit lines which were sanctioned/committed/guaranteed. Banks in general may be in a position to withstand liquidity shocks with their high quality liquid assets (HQLAs)25 and SLR investments. In assumed scenarios, there will be increased withdrawals of un-insured deposits26 and simultaneously there will also be increased demand for credit resulting in withdrawal of the unutilised portions of sanctioned working capital limits as well as utilisation of credit commitments and guarantees extended by banks to their customers. Using their HQLAs for meeting day-to-day liquidity requirements, most banks (49 out of the 60 banks in the sample) will remain resilient in a scenario of assumed sudden and unexpected withdrawals of around 10 per cent of deposits along with the utilisation of 75 per cent of their committed credit lines (Chart 2.17). In case of ‘incremental shocks’ in an extreme crisis, banks will be able to withstand further (about 15 per cent) withdrawals of deposits using their remaining SLR investments through specific policy measures taken as per requirements (Chart 2.18). Table 2.2: Interest rate risk – Bank groups – Shocks and Impacts
(under shock of 250 basis points parallel upward shift of the INR yield curve) | | (per cent) | | | PSBs | PVBs | FBs | | AFS | HFT | AFS | HFT | AFS | HFT | | Modified duration | 3.6 | 5.1 | 2.1 | 4.2 | 1.1 | 2.4 | | Share in total investments | 32.5 | 0.7 | 34.7 | 5.5 | 86.2 | 13.8 | | Reduction in CRAR (bps) | 112 | 48 | 131 | | Source: RBI supervisory returns and staff calculations. |
Stress testing of the derivatives portfolio of banks – Bottom-up stress tests 2.20 A series of bottom-up stress tests (sensitivity analyses) on derivatives portfolio were conducted for select sample banks27 with the reference date as at end of September 2016. The banks in the sample, reported the results of four separate shocks on interest and foreign exchange rates. The shocks on interest rates ranged from 100 to 250 basis points, while 20 per cent appreciation/depreciation were assumed for foreign exchange rates. The stress tests were carried out for individual shocks on a standalone basis. 2.21 In the sample, the marked-to-market (MTM) value of the derivatives portfolio for the banks varied with PSBs and PVBs, except one, registering small positive as well as negative MTM, while most of the FBs had a relatively large positive as well as negative MTM. Most of the PSBs and PVBs had positive net MTM, while most of the FBs recorded negative net MTM (Chart 2.19). 2.22 The stress test results showed that the average net impact of interest rate shocks on sample banks were negligible. The foreign exchange shock scenarios also showed a relatively lower impact in recent quarters (Chart 2.20). Section II Scheduled urban co-operative banks Performance 2.23 At the system level,28 the CRAR of scheduled urban co-operative banks (SUCBs) increased marginally from 12.8 per cent to 13.0 per cent between March and September 2016. However, at a disaggregated level, five banks failed to maintain the minimum required CRAR of 9 per cent. GNPAs of SUCBs as a percentage of gross advances increased sharply to 8.6 per cent from 6.6 per cent and their provision coverage ratio29 increased to 47.2 per cent from 46.7 per cent during the same period. Further, RoA increased from 0.6 per cent to 0.9 per cent and the liquidity ratio30 fell marginally from 34.8 per cent to 34.7 per cent during the same period. Resilience – Stress tests Credit risk 2.24 The impact of credit risk shocks on the CRAR of SUCBs was observed under four different scenarios.31 The results show that even under the adverse scenario of one SD increase in GNPAs (third scenario), the system level CRAR of SUCBs came down below the minimum regulatory requirement. Individually, a large number of banks (out of 54 banks, 28 banks under scenario iii and 40 banks under scenario iv) may not be able to meet the required CRAR levels.
Liquidity risk 2.25 A stress test on liquidity risk was carried out using two different scenarios; i) 50 per cent and ii) 100 per cent increase in cash outflows, in the one to 28 days’ time bucket. It was further assumed that there was no change in cash inflows under both the scenarios. The stress test results indicate that SUCBs may be significantly impacted under a stress scenario (out of 54 banks, 26 banks under Scenario i and 35 banks under Scenario ii). Section III Non-banking financial companies 2.26 As of September 2016, there were 11,555 non-banking financial companies (NBFCs) registered with the Reserve Bank, of which 188 were deposit-accepting (NBFCs-D) and 11,367 were non-deposit accepting (NBFCs-ND). There were 220 systemically important non-deposit accepting NBFCs (NBFCs-NDSI) 32. All NBFCs-D and NBFCs-ND-SI are subject to prudential regulations such as capital adequacy requirements and provisioning norms along with reporting requirements. Performance 2.27 The aggregated balance sheet of the NBFC sector expanded by 8.5 per cent on a y-o-y basis in September 2016 as compared to 15.5 per cent in March 2016. Loans and advances increased by 10.5 per cent while total borrowings increased by 7.4 per cent in September 2016 (Table 2.3). Net profit as a percentage to total income improved between March and September 2016, whereas, RoA remained unchanged at 2.2 per cent (Table 2.4). | Table 2.3: Consolidated balance sheet of the NBFC sector: Y-o-Y growth | | (per cent) | | | Mar-16 | Sep-16 | | 1. Share capital | 4.8 | 9.9 | | 2. Reserves and surplus | 14.3 | 9.1 | | 3. Total borrowings | 15.3 | 7.4 | | 4. Current liabilities and provisions | 31.8 | 13.8 | | Total liabilities / assets | 15.5 | 8.5 | | 1. Loans & advances | 16.6 | 10.5 | | 2. Investments | 10.8 | 0.6 | | 3. Other assets | 12.7 | 4.8 | | Income/expenditure | | | | 1. Total income | 15.8 | 6.4 | | 2. Total expenditure | 15.8 | 1.5 | | 3. Net profit | 15.6 | 20.8 | | Source: RBI supervisory returns. |
| Table 2.4: Select ratios of the NBFC sector | | (per cent) | | | Mar-16 | Sep-16 | | 1. Capital market exposure (CME) to total assets | 8.5 | 8.1 | | 2. Leverage ratio | 3.9 | 3.6 | | 3. Net profit to total income | 18.3 | 18.6 | | 4. RoA (Annualised) | 2.2 | 2.2 | | 5. RoE (Annualised) | 10.6 | 10.5 | | Source: RBI supervisory returns. | Asset quality and capital adequacy 2.28 GNPAs of the NBFC sector as a percentage of total advances increased to 4.9 per cent from 4.6 per cent between March and September 2016. NNPAs as a percentage of total advances also increased to 2.7 per cent from 2.5 per cent during the same period (Chart 2.21). 2.29 As per extant guidelines, NBFCs33 are required to maintain a minimum capital consisting of Tier-I34 and Tier-II capital, of not less than 15 per cent of their aggregate risk-weighted assets. The CRAR of NBFC sector as a whole declined to 23.1 per cent from 24.3 per cent between March and September 2016 (Chart 2.21). Resilience – Stress tests System level 2.30 A stress test on the credit risk for the NBFC sector as a whole for the half year ended September 2016 was carried out under three scenarios: (i) GNPA increase by 0.5 SD, (ii) GNPA increase by 1 SD and (iii) GNPA increase by 3 SD. The results indicate that in the first scenario, CRAR of the sector declined to 21.0 from 23.1 and in the second scenario, it declined to 15.3 per cent but remained above the regulatory minimum of 15 per cent. Individual NBFCs 2.31 A stress test on the credit risk for individual NBFCs was also conducted for the same period under the above three scenarios. The results indicate that under scenarios (i) and (ii), around 5 per cent of the companies will not be able to comply with the minimum regulatory capital requirements of 15 per cent; 9 per cent of the companies will not be able to comply with the minimum regulatory CRAR norm under the third scenario. Section IV Interconnectedness35 Trends in the interbank market 2.32 The size of the interbank market36 declined by around 2 per cent (y-o-y) in September 2016. Interbank exposures in September 2016 constituted nearly 6 per cent of the total assets of the banking system. The fund-based segment recorded a share of around 81 per cent in September 2016 as against 83 per cent in September 2015 (Chart 2.22). 2.33 PSBs continued to be the largest contributors in the interbank market followed by PVBs. However, the share of PSBs has been decreasing since March 2015 even as private and foreign banks are increasing their exposure (Chart 2.23). 2.34 The quantum and share of long-term37 bilateral exposures (fund based) between banks have been steadily increasing over the years. Long-term exposures increased from ₹2.6 trillion in March 2013 to ₹3.5 trillion in September 2016. From a share of 53 per cent in the interbank market (fund-based) in March 2013, short-term38 exposures fell to 40 per cent in September 2016 (Chart 2.24). 2.35 In the short term market, the share of call and certificate of deposits (CDs) has been decreasing steadily and accounted for about 39 per cent in September 2016. In the long term market, the share of capital instruments and of debt instruments and deposits increased while that of loans and advances declined (Charts 2.25 and 2.26).
Network structure and connectivity 2.36 The network structure39 of the banking system has been consistently tiered over the years, with the same set of banks dominating. The number of such banks was nine in March 2012 which came down to six in September 2016. The dominant banks are depicted in the inner most circle of the network plot (Chart 2.27).
2.37 The degree of interconnectedness in the banking system can be measured by the connectivity ratio40 which showed a declining trend indicating that the links/ connections between the banks have reduced over time. The cluster coefficient41 which depicts local interconnectedness remained stable during March 2012 and September 2016 indicating that the clustering/grouping within the banking system network did not change much over time (Chart 2.28). Network of the financial system42 2.38 From the perspective of the larger financial system, SCBs are the dominant players accounting for nearly 57 per cent of the total bilateral exposures followed by NBFCs at 13 per cent, asset management companies managing mutual funds (AMC-MFs) at 11 per cent, insurance companies and all India financial institutions (AIFIs) at 9 per cent each. UCBs and pension funds together account for nearly 1 per cent of the total bilateral exposures in the financial system. 2.39 On a net basis, AMC-MFs followed by the insurance companies are the biggest fund providers in the system while NBFCs followed by SCBs are the biggest receivers of funds. Within the SCBs, however, both PVBs and FBs have a net payable position vis-à-vis the entire financial sector whereas PSBs have a net receivable position (Chart 2.29). 2.40 Among the net lenders (that is those who have a net receivable position against the rest of the financial system), the net exposure of AMC-MFs declined between March and September 2016, while that of insurance companies, pension funds, UCBs and PSBs increased. Among the net borrowers (i.e. those who have a net payable position against the rest of the financial system), the net exposure of AIFIs declined, while that of NBFCs and PVBs increased. FBs which were net lenders in March 2016 turned net borrowers in September 2016 (Chart 2.30). Interaction between SCBs, AMC-MFs and insurance companies43 2.41 As at the end of September 2016, the gross receivables of AMC-MFs towards the financial system was around 28 per cent of its average assets under management (AUM), while the gross receivables of the banking system was around 9 per cent of its total assets.44 2.42 The banking sector had a gross exposure (receivable) of nearly ₹134 billion in September 2016 towards the insurance and mutual fund sectors taken together (as against ₹176 billion in March 2016). At the same time, the combined exposure (gross receivable) of AMC-MFs and insurance companies towards the banking sector was nearly ₹4.4 trillion (as against ₹4.9 trillion in March 2016), which accounted for nearly 4 per cent of the total liabilities of the banking system in September 2016. 2.43 While the gross exposure (receivable) of AMC-MFs to banks was primarily short-term (₹1.1 trillion), the insurance companies had substantial long-term exposure (₹2.2 trillion) (Chart 2.31). Exposure to NBFCs 2.44 NBFCs were the largest net receivers of funds from the rest of the financial system with SCBs accounting for 36 per cent, followed by AMC-MFs (at 34 per cent) and insurance companies (at 25 per cent). Pension funds accounted for nearly 3 per cent of the net borrowings by NBFCs from within the financial system.45 2.45 A part of the churning in the domestic banking sector is probably benefitting the NBFCs even as the regulatory stance is to harmonise the regulation of NBFCs with that of banks. Notwithstanding the increasing level of regulations for NBFCs, a significant share of bank finance to NBFCs and the better performance of the latter suggest that banks which are currently distressed have a scope to improve their margins by reworking their strategies. Exposure of Pension funds46 2.46 Pension funds were net lenders in the financial system with a gross exposure (receivable) of ₹239 billion in September 2016, of which almost 97 per cent was by way of bonds and other long term instruments. Within the financial system as referred to in the analysis here, nearly 55 per cent of the exposure (gross receivables) of pension funds was to the NBFC sector followed by the banking sector (30 per cent).47 Pension funds’ exposure (gross receivables) grew by 26 per cent between March and September 2016, mainly fuelled by an increase in their exposure to the NBFC sector (Chart 2.32). Contagion analysis48 2.47 A contagion analysis using network tools is a stress test which is carried out to estimate potential losses that could happen in the event of failure of one or more banks. The maximum (top 5) estimated impact under the joint solvency liquidity contagion49 in terms of loss of liquidity and Tier-I capital of the banking system is given in Chart 2.33.
|