| November 20, 2015 The Deputy Governor
Reserve Bank of lndia
Mumbai Submission of the Report of the Advisory Committee on Ways and Means Advances to State Governments In terms of the letter No. 1125/10.18.13/2014-15 dated November 24, 2014 constituting an Advisory Committee on Ways and Means Advances to State Governments, the report of the Committee is enclosed. We would like to place on record the outstanding contribution and assistance made by Shri L. Lakshmanan, Assistant Adviser, Internal Debt Management Department of the Reserve Bank of India in the preparation of the Report as also for the analytical inputs towards deliberations of the Committee. | | | Sd/-
(Sumit Bose)
Chairman | | | | |
Sd/-
(Rathin Roy)
Director, NIPFP | Sd/-
(Sudhir Shrivastava)
Add. Chief Secretary (Fin)
Govt. of Maharashtra | Sd/-
(K. Shanmugam)
Pr. Finance Secretary
Govt. of Tamil Nadu | | | | |
Sd/-
(D. P. Reddy)
Pr. Finance Secretary
Govt. of Punjab | Sd/-
(Temjen Toy)
Pr. Secretary & Finance
Commissioner
Govt. of Nagaland |
Sd/-
(N. K. Choudhary)
Pr. Finance Secretary
Govt. of Jammu & Kashmir | | | | | Sd/-
(L. N. Tochhawng)
Finance Commissioner &
Secretary
Govt. of Mizoram |
Sd/-
(G. C. Murmu)
Add. Secretary (PF-I), MoF
Govt. of India |
Sd/-
(R. Kausaliya)
Director, IDMD, RBI
Convenor & Member Secretary |
ACKNOWLEDGEMENT The Committee would like to thank all the State Finance Secretaries/ other Officials of the State Governments and Ministry of Finance, Government of India (GoI) for their participation in the meetings and valuable suggestions for the Report. The Committee wishes to place on record the contributions by the three resources persons, viz., Shri N.R.V.V.M.K. Rajendra Kumar, General Manager, Internal Debt Management Department (IDMD) for his deliberations and inputs, Shri A.K. Mitra, Director, Monetary Policy Department towards his analytical inputs on fiscal monetary coordination and Shri Brijesh Pazhayathodi, Assistant Adviser, Department of Economic and Policy Research (DEPR) for analytical material on State finances. The Committee acknowledges the untiring efforts and valuable support of the Officers and Staff of IDMD, RBI. In particular, the following deserves special mention: Shri Amit Kumar Meena, Assistant Adviser for his data compilation support and Shri Milind S. Phadke, Manager for his logistical and other administrative support in organising the meetings of the Committee as also officials attached to the Regional Offices of Kolkata and New Delhi for the arrangements made for conducting the meetings there and the hospitality extended. The Committee also recognises the contributions of Directors Smt. Deepa S. Raj and Shri I. Bhattacharya and other Officials of Fiscal Analysis Division of DEPR in particular Shri Anand Prakash Ekka, Research Officer for data support. The Committee acknowledges Smt. Rekha Warriar, Chief General Manager, IDMD for her guidance. The Committee immensely benefited from the discussions with Shri H.R. Khan, Deputy Governor and Shri P. Vijaya Bhaskar, Executive Director of the Reserve Bank of India.
EXECUTIVE SUMMARY i. The State Finance Secretaries (SFS) conference held in August 2014 decided to set up a Committee to revisit the Ways and Means Advances (WMA) scheme for the State Governments. Accordingly, the Advisory Committee on WMA to State Governments was constituted in November 2014. For the first time, the composition of the Committee was extended to six SFSs and Joint Secretary, PF-I, GoI as Members in addition to two external fiscal experts including one as Chairman. Evolution of WMA Scheme ii. The Reserve Bank of India (RBI) provides financial accommodation to the States banking with it through agreement to tide over temporary mismatches in the cash flow of their receipts and payments as WMA. They are intended to provide a cushion to the States to carry on their essential activities and normal financial operations. iii. In addition to Normal WMA, Special Drawing Facility (SDF) (nomenclature changed from Special WMA) has also been in operation since April 1953. When the advances to the State Governments exceed their SDF and WMA limits, Overdraft (OD) facility is being provided. iv. Three Advisory Committees were constituted in the past under the chairmanship of (i) Shri B.P.R. Vithal (1998), (ii) Shri C. Ramachandran (2003), and (iii) Shri M.P. Bezbaruah (2005), in addition to the Informal Group of State Finance Secretaries (2000) to review the WMA scheme for the State Governments. State Finances and 14th Finance Commission (FC) Implications v. A brief review of State finances indicates that the ratio of revenue deficit to fiscal deficit improved significantly, declining from 36.8 per cent in 2004-05 to (-) 10.4 per cent in 2012-13. The surplus in the revenue account was, however, nearly wiped out in 2013-14. vi. Outstanding debt-GDP ratio of States declined steadily from 31.1 per cent in 2004-05 to 21.6 per cent in 2012-13. Freeing up resources for higher capital outlays, improving the quality of fiscal consolidation and setting the consolidated debt-GDP ratio of the States on a declining trajectory is crucial to the health of State finances. vii. The fiscal size of the States increased significantly after 2005-06 as the compound annual growth rate (CAGR) of revenue expenditure increased to 15.4 per cent during 2006-07 to 2013-14 as compared with 9.3 per cent during 2000-01 to 2005-06. viii. Reviewing the fiscal situation of States, the 14th FC noted that, at an aggregate level, fiscal indicators of States improved during 2004-05 to 2013-14. The 14th FC recommendations indicate compositional shift in transfers from grants to tax devolution with a view to meet the twin objectives of increasing the flow of unconditional transfers to the States and yet leave appropriate fiscal space for the GoI to carry out specific purpose transfers to the States. ix. As per the 14th FC, the aggregate corpus of State Disaster Response Fund (SDRF) works out to ₹61,219 crore during the award period of 2015-16 to 2019-20. As mentioned in the SDRF investment guidelines, if the State Executive Committee (SEC) earmarks specific amount for investment in Government securities, the Reserve Bank could manage the same on the lines of Consolidated Sinking Fund (CSF)/Guarantee Redemption Fund (GRF)/ Special Drawing Facility (SDF) investments. Liquidity Position of the State Governments and Availment of WMA x. Annual review of availment of WMA to ascertain the adequacy of the limit reveals that since 2008-09, only few States have been regularly availing SDF/ WMA, while some availed occasionally. States availing OD increased from 3 in 2008-09 to 6 in 2011-12 and further to 10 in 2014-15. Average peak utilisation of OD increased to ₹449 crore in 2014-15 from ₹199 crore in 2013-14. xi. The Committee studied the pattern of transfers from GoI to States during the recent period and observed that the cash flow mismatch on account of transfers from the Centre seems limited, except in Q4. xii. Notwithstanding the manyfold increase in the net RBI credit to State Governments, the contribution of WMA to reserve money growth remained relatively modest. xiii. Since the financial year 2012-13, it is observed that the peak availment of WMA and OD by the States together was much lower than the tolerable limit for monetary policy implications. xiv. Empirical evidence suggests that if increase in revenue expenditure is more than covered by higher revenue receipts, then the revenue deficit reduces over a period of time, and thereby preempts a lower access to WMA from the Reserve Bank. However, the growth of revenue receipts was not in tandem with the growth in revenue expenditure for all the States, which forced some States to resort to WMA/ OD. Conclusions and Recommendations xv. Taking into account the significant increase in fiscal size of the States, as also to provide some cushion to keep pace with the fiscal developments, the Committee felt that there is a need to revise the WMA limits at this stage. xvi. The Committee considered various scenarios/ basis for the revision of WMA, viz., GFD, GSDP, total expenditure, revenue receipts, total expenditure minus revenue deficit, etc., for devising the formula. Finally, the Committee decided to take total expenditure net of lotteries for the latest three years’ average as the base for deciding WMA limit (2011-12 to 2013-14 Accounts). xvii. Quantum increase in WMA limit of around 15 per cent was considered appropriate keeping in view the similar growth in expenditure between 2005-06 and 2013-14 and also bifurcation of quantum among Himalayan States & North Eastern States (HS&NES) and other States in the ratio of 12.81:87.19. Accordingly, the multiplying ratio has been arrived at 2.78 per cent and 2.03 per cent, respectively for HS&NES and other States. xviii. The revised WMA quantum works out to ₹32,225 crore for all the States. The increase in Statewise WMA limits is in the range of 70.6 per cent to 132 per cent. CSF Investment and SDF Eligibility xix. The CSF withdrawal and its impact on SDF eligibility was referred later to the Committee for its deliberation and recommendation. The Committee recommended that the present system of incremental investments in CSF/GRF will continue for deciding the eligibility of the SDF. As an incentive to invest in CSF and GRF liberally, all incremental investments (at present restricted to WMA limit) may be allowed for availing SDF without any limit in line with the eligibility available for investments in G-Secs and Auction Treasury Bills (ATBs). xx. If States avail of SDF against the collateral of GoI dated securities and ATBs, they will not be allowed to invest in any of these securities for the next 90 days. xxi. In case of second and subsequent investment in 91 day TBs and availing of SDF against such collateral, during the financial year, such availment would be treated as WMA after the first occasion. Future Guidance xxii. The 14th FC recommendations on devolution and the post devolution revenue deficit grants to 11 States are expected to eliminate structural revenue deficits. The Committee felt that since 14th FC recommendations were being implemented from FY 2015-16, States would require some transition time to adjust their finances in line with the new vertical and horizontal devolution. The limits proposed by the Committee will be implemented in the current financial year. These limits would continue for two years. However, the Committee recommends that a review be undertaken by the RBI in 2017-18 when final expenditure numbers for FY 2015-16 will be available. xxiii. From 2017-18, the WMA limits will be revised based on the total expenditure net of lotteries, revenue deficit and power bond expenses, if any. xxiv. Committee based next revision of WMA may be effected in 2020-21 taking into account the then fiscal positions of the States and the road map likely to be deliberated in the 15th FC report.
I. INTRODUCTION The Reserve Bank of India (RBI) is the debt manager for 29 State Governments and the Union Territory of Puducherry as also the banker to the State Governments except Government of Sikkim1, in terms of their agreement with RBI under Section 21 A of the Reserve Bank of India Act 1934. Under this Section, the Reserve Bank shall undertake all money, remittance, exchange and banking transactions in India, including in particular, the deposit, free of interest, of all its cash balances with the Bank; and the management of the public debt of, and the issue of any new loans by, that State. Towards this endeavour, the Reserve Bank makes advances to State Governments to tide over mismatches in the cash flows of their receipts and payments. Such advances are termed as Ways and Means Advances (WMA), which are repayable in each case not later than three months from the date of the making of the advance in terms of Section 17 (5) of the RBI Act. The Reserve Bank has been extending such advances to State Governments since 1937 under this provision. The maximum amount of WMA by the Reserve Bank and the interest charged thereon are regulated by agreements with the State Governments as also based on the recommendations of various Committees/ Groups constituted, which are discussed in detail in Chapter II. 1.2 The WMA scheme was revised in April 2006 based on the recommendations of the Advisory Committee on Ways and Means Advances to State Governments (Chairman: Bezbaruah). In response to the requests made by some of the State Governments as also in accordance with the discussions held in the State Finance Secretaries’ (SFS) conference of 2013, the WMA limit was increased by 50 per cent for all States over their then existing limit since November 11, 2013. As discussed in the SFS conference held in August 2014 based on an agenda item to revisit the WMA scheme, an Advisory Committee was constituted in November 2014, with two external fiscal expert including one as Chairman, Joint Secretary, PF-I, GoI and six SFSs representing each zone of Indian States as members in addition to a Member Secretary from Internal Debt Management Department (IDMD) of the RBI. Accordingly, the initial composition2 of the Advisory Committee was as under: i. Shri Sumit Bose – Chairman (Member, Expenditure Management Commission, GoI and former Finance Secretary, GoI) ii. Dr. Rathin Roy, Director, National Institute of Public Finance and Policy (NIPFP) – Member iii. Shri Sudhir Shrivastava, Additional Chief Secretary of Govt of Maharashtra – Member iv. Shri K. Shanmugam, Principal Finance Secretary of Govt of Tamil Nadu - Member v. Smt Vini Mahajan, Principal Finance Secretary of Govt of Punjab - Member vi. Shri Temjen Toy, Principal Secretary & Finance Commissioner of Govt of Nagaland - Member vii. Shri B.B. Vyas, Principal Finance Secretary of Govt of Jammu & Kashmir - Member viii. Ms. L.N. Tochhawng, Finance Commissioner of Govt of Mizoram - Member ix. Shri Rajiv Kumar, Joint Secretary, PF-I, MoF, GoI - Member x. Smt R. Kausaliya, Director, IDMD, RBI – Convenor & Member Secretary TERMS OF REFERENCE OF THE COMMITTEE 1.3 The terms of reference (ToR) of the Committee broadly covers the following: i. To review the existing WMA scheme for the State Governments, particularly the formula for fixation of limits, and recommend modifications, if necessary, in the light of the recommendations of the 14th Finance Commission; ii. To examine the existing Overdraft regulations for the State Governments; iii. To examine the scheme of Special Drawing Facility (SDF) of the State Governments; and iv. Any other issues germane to the subject. As a fallout of the discussion in the SFS conference 2015, the CSF withdrawal and its impact on SDF eligibility was referred later to the Committee for its deliberation and recommendation. APPROACH OF THE COMMITTEE 1.4 The composition of the Committee was extended for the first time to include Finance Secretaries of select six State Governments as Members in addition to PF-I, GoI representation. The Secretarial and research support to the Committee was provided by the Internal Debt Management Department of the RBI. The Committee adopted a consultative approach and accordingly formalised its recommendations based on the discussion among Members as also non-member State representatives and fiscal experts. The Committee held three meetings. In the first meeting in Mumbai (Annex 9), it was decided to examine, among others: (i) the reasons for sudden and regular availment of WMA/ OD by some States; (ii) empirically study the relationship between Revenue Deficit (RD), cash surplus and availment of WMA for the recent period; (iii) analyse the 14th Finance Commission report and its implication on State finances; and also (iv) analyse the increase in WMA limit and its overall impact on money supply and other monetary policy related implications. 1.5 The second meeting was held in Kolkata, where Finance Secretaries of five State Governments of the region, were also invited to offer their views. In the meeting, it was decided to: (i) ascertain the status of implementation of e-receipts and e-payments model in the State Government transactions and its implications on cash management; (ii) study the tax forecast of the Union Budget vis-à-vis actual collection and its devolution to State Governments for the recent period; (iii) estimate the tolerable limit of WMA target as per Bezbaruah Committee formula adjusted for inflation and fiscal targets; (iv) study the cross country experience on sub-national cash management of few countries such as Brazil, Indonesia, South Africa and Germany; and (iv) study the feasibility of more number of auctions of SDLs to reduce the cash flow mismatches as also to avoid availing more WMA/ OD from the Reserve Bank. 1.6 In addition, Shri Sumit Bose, Chairman of the Committee was invited to the SFS conference held on May 25, 2015 to address the State Officials. Based on the discussion, Chairman requested all the State Governments to forward their views for the benefit of the Committee. Views received from State Governments were discussed and are summarised in Annex 8 of the Report. Further, in the SFS conference, an agenda item on withdrawal from CSF by States was discussed. As the incremental investment in CSF is eligible as collateral to avail SDF from the RBI, some of the State Governments suggested that their eligibility to avail SDF should not be curtailed after such withdrawal from the CSF. It was decided in the SFS conference that this issue may be referred to the Advisory Committee for further deliberation to arrive at an appropriate recommendation as part (iv) of ToR. 1.7 The Chairman, along with Dr. Rathin Roy, had discussions with select officials of the IDMD on August 31, 2015. The final meeting of the Committee was held at RBI, New Delhi on November 20, 2015, which finalised the recommendations, after due deliberations, and the letter of transmittal was signed by the Members. The follow-up actions on the issues raised in the Committee meetings as well as other issues discussed are appropriately included across the Report. STRUCTURE OF THE REPORT 1.8 Against this backdrop, the rest of the Report is organised into four Chapters. Though the evolution of the WMA scheme for the State Governments was given in the earlier Committees’ reports, a summary of the same is covered in Chapter II for ready reference and the detailed historical review of the minimum balance and the background of WMA scheme are elaborated in Annex 2. The 14th Finance Commission (FC) recommendations and its implications on State finances along with the recent fiscal position of the States are discussed in Chapter III. Chapter IV empirically evaluates the liquidity position of the States and analyses in detail the availment of WMA/ OD by the States. Further, the increase in WMA limit and its overall impact on the money supply in the context of monetary policy are also examined in this Chapter. Conclusions and recommendations of the Committee are set out in Chapter V. An update of the consolidated measures recommended by the earlier Committees is listed in Annex 1. Historical trend in interest rates on WMA and OD are codified in Annex 3. Annex 4 details the utilisation of WMA and consolidates the investment in Intermediate Treasury Bills (ITBs) and Auction Treasury Bills (ATBs) by the State Governments. Fiscal indicators, viz. , revenue expenditure, lottery expenditure and capital expenditure used as base for WMA calculation of the States is given in Annex 5. Annex 6 briefly sets out the operating procedures and liquidity management framework of the Reserve Bank. Annex 7 lists the various combinations of WMA formulas attempted for this Report. Annex 8 briefly summaries the views expressed by the State Governments on WMA/ OD. Annex 9 lists the officials who attended the Advisory Committee meetings II. EVOLUTION OF WAYS AND MEANS ADVANCES SCHEME 2.1 The Reserve Bank provides financial accommodation to the States banking with it through agreement to help the States to tide over temporary mismatches in the cash flow of their receipts and payments as WMA. They are intended to provide a cushion to the States to carry on their essential activities and normal financial operations. As mentioned earlier, the WMA provided by the RBI to the States are governed by Section 17(5) of the Reserve Bank of India Act, 1934. There are two types of Ways and Means Advances, viz., (i) Normal WMA or clean advance, which was introduced in 1937; and (ii) Special WMA instituted in 1953, which is secured advance provided against the collateral of GoI securities. As requested by the State Governments in the SFS conference held in May 2013, the nomenclature of Special WMA was changed to SDF since June 23, 2014 by amending the respective agreement with State Governments. In addition, an overdraft (OD) facility is also provided to the State Governments whenever RBI credit to the State Government exceeds the SDF and WMA limits. The maximum amount of such advances by the Reserve Bank and the interest charged thereon are, however, not specified in the RBI Act but are regulated by voluntary agreements with the State Governments as also based on the recommendations of various Committees. 2.2 As a banker to the State Governments, the Reserve Bank is not entitled to any remuneration for the conduct of ordinary banking business other than the advantages, which may accrue to it from the holding of States’ cash balances free of obligation to pay interest thereon. The WMA limit was equal to the minimum balance in 1937, when these limits were instituted for the first time. A major change in the principles adopted for working out the WMA limits occurred in 1999 consequent to the recommendations made by an Informal Advisory Committee (IAC). WMA/ OD SCHEME: PERIODIC REVISIONS 2.3 The WMA scheme was periodically reviewed, keeping in view the States’ requirements, the evolving financial and institutional developments, as well as the objectives of monetary and fiscal management3. Ten revisions were made in the WMA limits till August 1996. In 1953, the WMA limits were fixed at twice the revised minimum balance. The WMA limits were increased to 12 times of the minimum balances in 1967 and further to 168 times in 1996. During the period October 1986 to March 1988, two intra-year WMA limits were specified - 52 times the minimum balance during the first half of the year and 48 times the minimum balance in the second half. Since 1999, the limits are being fixed based on the recommendations of the Advisory Committees set up periodically by the Reserve Bank. ADVISORY COMMITTEES CONSTITUTED BY THE RBI 2.4 In the past, three Advisory Committees were set up by the RBI, in addition to an informal Group of State Finance Secretaries (GSFS). Each Advisory Committee was headed by an expert with experience in State finances (Table 1). Each Committee had one fiscal expert as member along with the Chairman. The consolidated recommendations by these Committees on the WMA formula are tabulated briefly in Annex 1 and historical background is set out in Annex 2. VITHAL COMMITTEE (1998) 2.5 A major change in fixing the Normal WMA and Special WMA limits of States was effected by the Informal Advisory Committee (Chairman: Shri B.P.R. Vithal, Member, 10th Finance Commission). The Vithal Committee observed that fixing the WMA limits as multiples of an unchanged minimum balance did not capture the differing needs of the States as observed from the States budgetary transactions. This had resulted in wide inter-State variations in the WMA limits in relation to the size of the budget and it was felt that this needs to be corrected. | Table 1: Advisory Committees Constituted by the RBI | | Sl. No. | Year | Chairman | Member | Member Secretary | | 1 | 1998 | B.P.R. Vithal | Ashok Lahiri | CGM, IDMD | | 2 | 2003 | C. Ramachandran | Suman Bery | CGM, IDMD | | 3 | 2005 | M.P. Bezbaruah | D.K. Srivastava | CGM, IDMD | 2.6 Therefore, the Vithal Committee recommended delinking of the size of the WMA limit with the minimum balance and recommended that the WMA limits of the States be fixed as a multiple of their budgetary turnover to capture the differing needs of the States in line with the growth in their budgetary transactions. Separate multiplying ratios were specified for Special and Non-Special Category States. Accordingly, the WMA limits were fixed by applying the ratio of 2.25 per cent and 2.75 per cent, respectively for non-special and special category States to the three year average of revenue receipts plus capital expenditure (accounts) for the years 1994-95, 1995-96 and 1996-97, as published in the State Budgets. INFORMAL GROUP OF STATE FINANCE SECRETARIES (2000) 2.7 The Vithal Committee had recommended substantial enhancement of limits of WMA but had stated that these limits should remain unchanged for the period covered by the recommendations of the 11th Finance Commission (FC). However, based on the representations from the State Governments, Group of State Finance Secretaries (GSFS) was constituted by the Reserve Bank in November 2000. Certain modifications in the then existing scheme and further enhancements of WMA limits were recommended by that Group. Two years after adopting the recommendations of the GSFS, the Reserve Bank decided to review the entire formula of WMA in the light of the emerging fiscal conditions in State finances. Accordingly, an Advisory Committee was constituted to review the WMA scheme under the Chairmanship of Shri C. Ramachandran, former Secretary (Expenditure), GoI. RAMACHANDRAN COMMITTEE (2003) 2.8 The Ramachandran Committee recognized that, from the point of view of the States, it is the adequacy of the limit to accommodate likely mismatches that is relevant and important. Therefore, exclusion of capital expenditure from the base could be compensated by adopting a higher ratio to the revenue receipts than the ratio used to determine the WMA limits. Therefore, the Committee recommended multiplying ratios of 3.19 per cent and 3.84 per cent, respectively for non-special and special category States on the base of average of the latest three years revenue receipts - two years’ actuals and one year’s revised estimates approved by the Comptroller and Auditor General (C&AG). 2.9 In the 1990s, the WMA, in addition to meeting the temporary mismatches in cash flows, also emerged as one of the sources of financing the structural mismatches of the States. The Ramachandran Committee observed that the review of WMA limits can be linked with the Finance Commission’s award on resource transfer to the States. Further, the WMA formula remained generally valid during the award period of the Finance Commission and thus, recommended a review of the WMA formula after the receipt of the recommendations of the 12th FC. BEZBARUAH COMMITTEE (2005) 2.10 The last formula based WMA revision was made on the basis of the Bezbaruah Committee. The Bezbaruah Committee perceived that the formulation of WMA limits by the Reserve Bank over the medium term needs to take into consideration: (i) the adequacy of existing WMA limits to cover temporary mismatches in the cash flows of the State Governments; (ii) the size of expected temporary cash flow mismatches over the medium term particularly in the context of the recommendations of the 12th FC; and (iii) consistency with the objectives of monetary management. The Committee recommended that the base should be taken as the average of the latest three years’ total expenditure (actuals) excluding repayments and adjusted for onetime ad-hoc expenditures and lottery expenditures. While in the case of States having a revenue deficit, the base should exclude the revenue deficit. After approximation, the multiplying ratios were taken as 3.1 per cent for Non-Special Category States and 4.1 per cent for Special Category States. Accordingly, the WMA limit was revised since April 1, 2006. 2.11 The Committee observed that the WMA limits may be reviewed every year. The Committee expects that with the reduction in the revenue deficit over time, the limits as computed for 2006-07 may prove to be quite adequate, in which case annual revision of the limits may not be necessary. The Committee further recommended that the next review of the WMA/ OD scheme may be undertaken after the receipt of the recommendations of the 13th FC. 2.12 The Reserve Bank has been undertaking annual reviews of WMA availment by the States since the revision held in 2006-07. It was observed that since 2009-10, about 11 States have been regularly availing WMA/ OD, while few States availed WMA occasionally. Many States have not availed WMA despite substantial increase in their expenditure since 2006-07. Annual reviews of utilisation of WMA revealed that only few States were availing this facility frequently and also the total utilisation of WMA was not much. 2.13 As there were continuous requests from some of the State Governments to revise the WMA limits, as also requests made in the SFS conference held in May 2013, the cash flow analysis of many of the States was undertaken. It was decided to increase the WMA limits for the State Governments by 50 per cent of then existing limit of ₹10,240 crore to ₹15,360 crore with effect from November 11, 2013. Thereafter, this Advisory Committee was constituted to review the WMA/ OD scheme. State-wise current WMA limit is set out in Table 2. As banker, the RBI has to provide reasonable amount of temporary advances to States to tide over liquidity mismatches. However, the quantum of advances the Reserve Bank could provide without affecting the monetary policy operations and fiscal discipline are issues that need to be addressed. The reconciliation of these conflicting needs of providing adequate temporary financing and continuing a regime where fiscal discipline is maintained, as well as the difficulties of distinguishing between a temporary liquidity problem and a structural deficit problem, are the challenges, which the RBI has to face while dealing with the WMA, which are discussed in detail in Chapter IV. | Table 2: WMA Limit for State Governments | | (₹ Crore) | | Sl. No | States/UTs | Limit as per Bezbaruah Formula | Limit since Nov 11, 2013 | | 1 | Andhra Pradesh4 | 880 | 770 | | 2 | Arunachal Pradesh | 65 | 98 | | 3 | Assam | 300 | 450 | | 4 | Bihar | 425 | 638 | | 5 | Chhattisgarh | 190 | 285 | | 6 | Goa | 65 | 98 | | 7 | Gujarat | 630 | 945 | | 8 | Haryana | 295 | 443 | | 9 | Himachal Pradesh | 190 | 285 | | 10 | Jammu and Kashmir | 315 | 473 | | 11 | Jharkhand | 280 | 420 | | 12 | Karnataka | 625 | 938 | | 13 | Kerala | 350 | 525 | | 14 | Madhya Pradesh | 460 | 690 | | 15 | Maharashtra | 1160 | 1740 | | 16 | Manipur | 60 | 90 | | 17 | Meghalaya | 60 | 90 | | 18 | Mizoram | 55 | 83 | | 19 | Nagaland | 80 | 120 | | 20 | Odisha | 300 | 450 | | 21 | Punjab | 360 | 540 | | 22 | Rajasthan | 505 | 758 | | 23 | Tamil Nadu | 730 | 1095 | | 24 | Telangana * | - | 550 | | 25 | Tripura | 100 | 150 | | 26 | Uttar Pradesh | 1020 | 1530 | | 27 | Uttarakhand | 145 | 218 | | 28 | West Bengal | 545 | 818 | | 29 | Puducherry | 50 | 75 | | | Total | 10,240 | 15,360 | | * Reorganised from Andhra Pradesh since June 2, 2014. | SPECIAL DRAWING FACILITY (SDF) 2.14 In addition to the WMA, SDF5 has also been in operation, which is a secured advance and linked to the investments made by State Governments in the GoI securities. At the time of the initiation of the scheme in April 1, 1953, a uniform limit of ₹2 crore was allocated to each State. The sanctioned limits of Special WMA were linked to (six times) the minimum balance in 1967 and were periodically revised upwards to 64 times the minimum balance in 1996. Since March 1999, Special WMA limits of the State Governments have been linked exclusively to their holdings of GoI dated securities and Treasury Bills, adjusted for margin. The Reserve Bank also maintains two Funds - CSF and GRF - on behalf of the States and the incremental investments in these Funds also qualifies for SDF upto a ceiling equivalent to their WMA limit as recommended by the Bezbaruah Committee. A uniform hair cut margin of five per cent is being applied on the market value of the securities for determining the operating limit of the SDF. Accordingly, the SDF limit for the State Governments will undergo changes according to the valuation of outstanding securities. As at end-March, 2015, the SDF eligibility of the State Governments stood at ₹42,755 crore. OVERDRAFT FACILITY (OD) 2.15 When the advances to the State Governments exceed their SDF and WMA limits, OD facility is being provided. The limit on number of days was fixed at 7 consecutive working days in the initial period. Subsequently, based on the representations from certain State Governments, the Reserve Bank introduced some flexibility in the scheme by enhancing the period for which a State Government could run on OD from 7 to 10 consecutive working days with effect from November 1, 1993. As per IAC recommendation, in 1998 the Reserve Bank imposed a ceiling on the OD amount at 100 per cent of the WMA limit with the provision that any OD over 100 per cent of the WMA limit had to be cleared within three working days. Subsequently in 2001, based on the recommendations of the GSFS, the limit of 10 consecutive working days was extended to 12 consecutive working days and the restriction for bringing down the OD level within the level of 100 per cent of the WMA limit was relaxed to five consecutive working days. The Committee observed that even with enhancement in the WMA, resort to OD has not declined. It appears that when a State remains in OD for more than 200 days in a year, WMA becomes a resource and the OD becomes WMA. As a result, OD is used to manage the resource crunch between two spells of WMA, hence constraint is no longer financial limit but a time limit. Thus frequent resort to OD is a manifestation of structural imbalance or bad cash management. 2.16 The Ramachandran Committee observed that greater resort to OD is a clear indication of fiscal imbalance and unless regulated in time, it would lead to a situation where the corrections would become costly and difficult. However, the total number of days that a State can remain in OD has been extended to 14 consecutive working days by the Ramachandran Committee. The existing norm of restricting OD to 100 per cent of the WMA limit being continued, i.e., if the OD exceeds this limit continuously for 5 consecutive working days for the first time in a financial year, the State will be advised by the RBI to bring down the OD level and if such irregularity persists on a second or subsequent occasion in the financial year, the RBI will stop payments notwithstanding the provision of permitting OD upto 14 days. In a quarter, the OD availed should not exceed 36 days irrespective of 14 days & 5 days rules. The Bezbaruah Committee decided not to modify the existing time limits for OD at that stage. INTEREST RATE ON SDF, WMA & OD 2.17 Advances availed by the State Governments attract interest on the outstanding6. The interest rates on WMA and OD witnessed periodic revisions. Prior to May 1976, the interest rate on WMA did not exceed the Bank Rate. Thereafter the rate of interest on these advances was revised. From May 1976 to August 1996 a graduated scale of charges based on the duration of the advance was introduced to discourage the States from using the facility as a normal budgetary resource. Since then a single rate of interest is being applied on WMA. In general, while WMA were charged not above the Bank Rate, the interest rate on OD usually exceeded the Bank Rate. The details of historical interest rates charged on SDF, WMA and OD are listed in Annex 3. Based on the recommendations of the Bezbaruah Committee, the interest rate on WMA scheme has been revised as in Table 3. | Table 3: Interest Rate on SDF, WMA & OD | | Scheme | Days/Limit | Rate of Interest | | 1. SDF | – | Repo rate minus 1% | | 2. WMA | Up to 90 days | Repo rate | | 3. WMA | Above 90 days | Repo rate plus 1% | | 4. OD | Availment equal to WMA Limit | Repo rate plus 2% | | 5. OD | Availment is more than WMA Limit | Repo rate plus 5% | | Note: As on November 13, 2015, the Repo Rate was at 6.75%. | III. STATE FINANCES AND 14th FINANCE COMMISSION IMPLICATIONS Recent Trends in State Government Finances7 3.1 Before discussing the trends in availment of WMA/ OD by the States, as also the tolerance level of WMA by the Reserve Bank in view of monetary policy operations, it would be more appropriate to examine the recent developments in fiscal position of the States and the recommendations of the 14th FC on the State finances. At the consolidated level, key deficit indicators of the States for 2014-15 were budgeted to improve from the revised estimates (RE) of the previous year (Table 4). Budget estimates (BE) for 2014- 15 was based on a marked acceleration in revenue receipts to bring about an expansion in the surplus on the revenue account after erosion to near-balance in the preceding year. It may be observed that States taken together, moved into a revenue surplus position in 2006-07 and have maintained this since then, except for 2009-10 when the implementation of Pay Commission awards and reduced revenue buoyancy on account of the economic slowdown resulted in revenue deficit. The surplus in the revenue account was, however, nearly wiped out in 2013-14. Underlying this erosion was a reflection of slowdown in both own tax and non-tax revenues. Notwithstanding an improvement in the State VAT revenue growth, other major own tax revenues were affected by the sluggishness in the economy. At the same time, growth in revenue expenditure increased significantly over the previous year on account of increase in social sector expenditure. In addition, the capital outlay on food and warehousing had to be enhanced in preparation for the implementation of the National Food Security Act, 2012. While the overall GFD-GDP ratio in 2013-14 at 2.5 per cent was in line with the 13th FC target, State-wise position shows that 12 out of the 28 States could not meet the same. Most States reaffirmed their commitment to fiscal consolidation in 2014-15. | Table 4: Major Deficit Indicators of State Governments | | (As per cent of GDP) | | Item | 2005-06 | 2006-07 | 2007-08 | 2008-09 | 2009-10 | 2010-11 | 2011-12 | 2012-13 | 2013-14 (RE) | 2014-15 (BE) | | GFD | 2.4 | 1.8 | 1.5 | 2.4 | 2.9 | 2.1 | 1.9 | 2.0 | 2.5 | 2.3 | | RD | 0.2 | -0.6 | -0.9 | -0.2 | 0.5 | 0.0 | -0.3 | -0.2 | 0.0 | -0.4 | | PD | 0.2 | -0.4 | -0.5 | 0.6 | 1.2 | 0.5 | 0.4 | 0.5 | 1.0 | 0.8 | 3.2 Decomposition of the consolidated GFD of the States indicates that the capital outlay exceeded the GFD in 2014-15, with the revenue surplus augmenting the required resources for financing the same (Table 5). In absolute terms, the GFD constituted on an average 52 per cent of the capital outlay during 2009-10 to 2014-15. | Table 5: Decomposition of Gross Fiscal Deficit | | (per cent) | | Item | 2005-06 | 2006-07 | 2007-08 | 2008-09 | 2009-10 | 2010-11 | 2011-12 | 2012-13 | 2013-14 RE | 2014-15 BE | | GFD=(1+2+3-4) | 100 | 100 | 100 | 100 | 100 | 100 | 100 | 100 | 100 | 100 | | 1. Revenue Deficit | 8 | -32 | -57 | -9 | 16 | -2 | -14 | -10 | -1 | -18 | | 2. Capital Outlay | 86 | 127 | 158 | 106 | 79 | 94 | 102 | 99 | 94 | 114 | | 3. Net Lending | 6 | 8 | 9 | 4 | 5 | 9 | 13 | 12 | 8 | 5 | | 4. Non-Debt Capital Receipts | 0 | 2 | 9 | 0 | 0 | 1 | 0 | 0 | 0 | 0 | 3.3 The notable features of financing the GFD during the recent period is that the market borrowing emerged as the major financing source as the compound annual growth rate (CAGR) increased to 31.7 per cent during 2006-07 to 2013-14 as compared with 8 per cent of CAGR during 2000-01 to 2005-06. Contribution of national small savings fund (NSSF) investments in State Governments’ special securities in financing GFD continued to remain negative due to redemptions exceeding fresh investments (Table 6). State provident fund is another source of financing of the GFD of the States. | Table 6: Financing of Gross Fiscal Deficit | | (Per cent) | | Year | Market Borrowings | Loans from Centre | Special Securities issued to NSSF | Provident Fund, etc. | Others | | 2005-06 | 17.0 | 0.0 | 81.9 | 11.6 | -10.5 | | 2006-07 | 16.9 | -11.5 | 72.3 | 13.4 | 8.9 | | 2007-08 | 71.5 | -1.2 | 7.8 | 16.4 | 5.7 | | 2008-09 | 77.3 | -0.6 | 1.1 | 11.6 | 10.5 | | 2009-10 | 59.7 | -0.9 | 12.8 | 12.3 | 16.2 | | 2010-11 | 55.0 | 0.4 | 23.9 | 17.2 | 3.4 | | 2011-12 | 80.4 | 0.1 | -4.8 | 15.8 | 8.4 | | 2012-13 | 74.8 | 0.9 | -0.1 | 13.2 | 11.2 | | 2013-14 (RE) | 70.8 | 2.6 | -1.3 | 9.0 | 18.9 | | 2014-15 (BE) | 77.7 | 4.4 | -0.6 | 9.1 | 9.4 | 3.4 The outstanding liabilities of the State Governments recorded double-digit growth during the period 2012-13 to 2014-15 (BE). The proposed transition from the present origin-based indirect tax regime to a destination-based tax regime under the goods and services tax (GST) from April 1, 2016 should create a buoyant source of revenue in the medium term. Freeing up resources for higher capital outlays, improving the quality of fiscal consolidation and setting the consolidated debt-GDP ratio of the States on a declining trajectory is crucial to the health of State finances. 3.5 A brief review of State finances shows that the ratio of revenue deficit to fiscal deficit, an indication of the extent to which borrowing is used for meeting revenue expenditures, showed a marked improvement, declining from 36.8 per cent in 2004-05 to (-) 10.4 per cent in 2012-13. The outstanding debt-GDP ratio declined steadily from 31.1 per cent in 2004-05 to 21.6 per cent in 2012-13. Most aggregate indicators of revenue receipts on the whole showed improvement till 2007-08 and deteriorated thereafter for 2008-09 and 2009-10. The trend seems to have reversed again from 2010-11, with revenue receipts showing significant increases. The States’ aggregate own revenues (the sum total of own tax revenues and own non-tax revenues) as a percentage of GDP showed an upward trend, increasing from 7.0 per cent in 2004-05 to 7.6 per cent in 2012-13. Aggregate own tax revenues increased more or less steadily from 5.6 per cent in 2004-05 to nearly 6.5 per cent in 2012-13 (with marginal decrease in 2008- 09 and 2009-10). However, aggregate own non-tax revenues decreased from 1.4 per cent in 2004-05 to about 1.2 per cent in 2012-13, thus partly offsetting the buoyancy of own tax receipts. The VAT constituted around 61 per cent of aggregate own tax revenues of the States and remained almost unchanged throughout the period 2004-05 to 2012-13. Overall improvement in State finances was driven by States’ own initiatives to increase revenues and rationalise expenditure, higher tax devolution because of buoyancy in Central taxes, and increased collections from VAT. By 2012-13, most States became revenue surplus, with their combined GFD being well below the target of 3 per cent of GSDP. 3.6 The fiscal size of the States has increased significantly after the 2005-06 revision of WMA as the CAGR of revenue expenditure increased to 15.4 per cent during 2006-07 to 2013-14 as compared with 9.3 per cent of CAGR during 2000-01 to 2005-06 (Table 7). Similarly, revenue receipt increased by 15.6 per cent during the period as compared with 13.4 per cent increase during the previous period. However, the capital expenditure recorded a slower growth of 12.9 per cent after 2005-06 as compared with 16.1 per cent earlier to cope up with the fiscal discipline prescribed by the FCs as also the FRBM restrictions. Also the capital receipts increased by 8.6 per cent during 2006-07 to 2013-14 compared with 8.3 per cent during the earlier period. Taking into account the significant increase in fiscal size of the States, compared with the position during the last revision as also to provide some cushion to keep pace with the fiscal developments, the Committee felt that there is a need to revise the WMA formula at this stage. | Table 7: Annual Compound Growth of Fiscal Parameters (%) | | Indicator | 2000-01 to 2005-06 | 2006-07 to 2013-14 | | Revenue Receipts | 13.4 | 15.6 | | Revenue Expenditure | 9.3 | 15.4 | | Capital Receipts | 8.3 | 8.6 | | Capital Expenditure | 16.1 | 12.9 | | Total Receipts | 11.8 | 13.9 | | Total Expenditure | 10.5 | 14.9 | | Total Gap | 3.7 | 12.6 | | Market Borrowings | 8.0 | 31.7 | 3.7 Some of the challenges for States on the fiscal front are: (i) efficient utilisation of the enhanced resources through tax devolution under the 14th FC award; (ii) efforts to mobilise non-tax revenue; (iii) impact of seventh pay commission awards; (iv) realistic capital outlays; and (v) an appropriate measurement of debt to include off-budget high risk liabilities. 3.8 While reviewing the fiscal position of States, RBI publication titled “State Finances: A Study of Budgets of 2014-15” highlighted the necessity to improve the predictive power of budget estimates with respect to actual outcomes. Improvement in fiscal marksmanship is important for delivering on fiscal consolidation intentions. In this regard, States need to improve the reliability of their forecasts of key fiscal parameters like tax, expenditure, macroeconomic aggregates, etc. 14TH FC RECOMMENDATIONS AND ITS IMPLICATIONS ON STATE FINANCES 3.9 The 14th FC (Chairman: Dr. Y.V. Reddy) submitted its Report in December 2014, which was placed before the Parliament on February 24, 2015. Reviewing the fiscal situation of States, the 14th FC noted that, at an aggregate level, fiscal indicators of States improved during the period from 2004-05 to 2013-14 (RE). Some of the major recommendations of the 14th FC relating to State Finances are in the following paras. Vertical Distribution 3.10 With a view to minimising discretion, improving the design of transfers, avoiding duplication and promoting co-operative federalism, the 14th FC suggested a review of existing arrangements for transfers outside the recommendations of the FC. Accordingly, it suggested that a new institutional arrangement may be evolved which can, inter alia, make recommendations regarding sector-specific and area-specific grants. The FC recommended increase in tax devolution to 42 per cent from 32 per cent of the divisible pool and sector-specific FC grants to be dispensed with - reflecting compositional shift in transfers from grants to tax devolution with a view to meet the twin objectives of increasing the flow of unconditional transfers to the States and yet leave appropriate fiscal space for the Union to carry out specific purpose transfers to the States. 3.11 Sector-specific FC grants to be dispensed with include grants-in-aid to be given for local bodies (53.5 per cent share in total grants); disaster management (10.2 per cent share) and post devolution revenue deficit grant where devolution alone could not cover the assessed gap (36.3 per cent share). Accordingly, 11 States qualified to receive such grants. States such as Andhra Pradesh, Himachal Pradesh, Jammu and Kashmir, Manipur, Mizoram, Nagaland and Tripura will need a revenue deficit grant for each of the years of the award period. In addition, four States, viz., Assam, Kerala, Meghalaya, and West Bengal will need a revenue deficit grant for at least one of the years of the award period. The post devolution revenue deficit as calculated by the 14th FC has been fully covered by the recommended revenue deficit grant. Horizontal Distribution 3.12 Inter-state devolution attempts to mitigate the impact of the differences in fiscal capacity and cost disability among States. The 14th FC has not used the distinction between non-special and special category states. Grants for Local Bodies 3.13 Grants distribution to States for local bodies are on the basis of the 2011 population data (weight of 90 per cent) and area (weight of 10 per cent). The grants are to be divided into two broad categories on the basis of rural and urban population - Gram Panchayats and Municipal Bodies. The share of Gram Panchayats is to be 69.6 per cent of the total grants during the award period 2015-2020; further, grants to be of two types – basic grant and performance grant, which depends on (i) making available reliable data on local bodies’ receipt and expenditure through audited accounts; and (ii) improvement in own revenues. State Governments should strengthen State Finance Commissions (SFC), including timely constitution, and adequate resources for smooth functioning and timely placement of the SFC report before State legislature. Goods and Services Tax 3.14 The compensation for revenue loss to the States for implementation of GST is to be 100 per cent for first 3 years, 75 per cent in the fourth year and 50 per cent in the fifth year. An autonomous and independent GST Compensation Fund is to be created. Fiscal Discipline and FRBM 3.15 The 14th FC recommended that the States’ annual GFD-GSDP ratio is to be anchored at 3 per cent of GSDP and will have the flexibility of upto 0.5 per cent provided the following conditions are met. Making a marked departure, the 14th FC has linked fiscal discipline to borrowing criteria rather than devolution criteria and the States are eligible for additional borrowings if: (i) the debt-GSDP ratio is less than or equal to 25 per cent; and/ or (ii) the interest payments are less than or equal to 10 per cent of the revenue receipts in the preceding year. Availing additional borrowing is conditional on the State having no revenue deficit in the year in which borrowing limit is to be fixed as also in the preceding year. Further, States to be given the option to carry forward unutilised borrowing limit in the following year during the award period. Thus, a State can have a maximum GFD-GSDP limit of 3.5 per cent in any given year during the award period. This may enable fiscally well managed States to borrow more for undertaking developmental capital expenditure. 3.16 The 14th FC has recommended that the Union Government should consider making an amendment to the FRBM Act to omit the definition of effective revenue deficit from April 1, 2015. Moreover, it recommended an amendment to the FRBM Act mandating the establishment of an independent fiscal council to undertake ex-ante assessment of the fiscal policy implications of budget proposals and their consistency with fiscal policy and rules. 3.17 In continuation with the disintermediation principle advocated by the 13th FC, the 14th FC has recommended that States may be excluded from the operations of the NSSF with effect from April 1, 2015, and their involvement be limited to discharging the liabilities already incurred. However, Union Budget 2015-16 has made a provision of ₹103.4 billion for NSSF’s investment in State Government securities, indicating that NSSF would continue to finance State Governments’ fiscal deficit. The 14th FC recommended that all the States should target improving the quality of fiscal management encompassing receipts and expenditures. Further, State Governments are to provide statutory ceiling on the sanction of new capital works to an appropriate multiple of the annual budget provision. However, some of the above recommendations are yet to be considered by the Union Government. Implications for State Government Finances 3.18 On the issue of tax devolution, the 14th FC’s recommendation of 42 per cent tax devolution may not significantly alter the aggregate resource transfers from the Centre, although it may give more untied transfers to the States, thus providing greater fiscal autonomy. To address horizontal imbalance, 14th FC has accorded greater importance to fiscal capacity, with the indicators of cost and revenue disabilities being assigned a combined weight of 72.5 per cent as against 57.5 per cent assigned by the 13th FC. 3.19 It may be noted that as per the recommendations of the 14th FC, the Centre-State funding pattern of some of the Centrally Sponsored Schemes (CSS)/ Programmes is already being modified in the Union Budget 2015-16 in view of the larger devolution of tax resources to States. The Union Budget proposed that eight CSS be delinked from support from the Centre. In respect of various other CSS, the sharing pattern will undergo a change with States sharing a higher fiscal responsibility in terms of scheme implementation. 3.20 In terms of 14th FC recommendations, all States are required to contribute 10 per cent to the SDRF during the award period of 2015-16 to 2019-20, and the remaining 90 per cent will be contributed by the Union Government. Accordingly, the aggregate corpus of SDRF works out to ₹61,219 crore during the award period. In view of huge proposed corpus in the SDRF, if the State/ State Executive Committee (SEC) earmarks specific amount to be invested in Government securities, the Reserve Bank could manage the same on behalf of the State Governments, provided the investment operation procedures would be similar as followed in case of CSF/ GRF/ SDF managed by the Reserve Bank. IV. LIQUIDITY POSITION OF THE STATE GOVERNMENTS AND AVAILMENT OF WMA: AN EMPIRICAL ANALYSIS Trends in availment of WMA/ OD 4.1 The Reserve Bank has undertaken annual review of availment of WMA/ OD by the States after the revision in 2006-07 to ascertain the adequacy of the limit. It is observed that since 2008-09, few States have been regularly availing SDF/ WMA, while some availed occasionally. Many States have not availed WMA despite substantial increase in their expenditure since 2006-07. The number of States that availed WMA increased from 6 in 2010-11 to13 in 2013-14, which declined to 12 in 2014-15 (Table 8). States availing OD also increased from 3 in 2008-09 to 6 in 2011-12 and further to 10 in 2014-15. | Table 8: Availment of SDF, WMA & OD by States | | (No. of States) | | Year | SDF | WMA | OD | | 2008-09 | 8 | 6 | 3 | | 2009-10 | 10 | 10 | 4 | | 2010-11 | 8 | 6 | 4 | | 2011-12 | 8 | 9 | 6 | | 2012-13 | 10 | 9 | 8 | | 2013-14 | 13 | 13 | 8 | | 2014-15 | 13 | 12 | 10 | | 2015-16 * | 8 | 11 | 7 | | * Upto September 2015 | 4.2 In view of the requests from some of the State Governments to revise the WMA limits, as also requests made in the SFS conference, the Reserve Bank reviewed the utilisation in alignment with State’s cash flow projections during 2013. Based on the above, it was observed that due to substantial increase in budget size of the States, it was considered to raise the WMA limit. Accordingly, the WMA limit was raised for all States by 50 per cent of the then existing limit with effect from November 11, 2013 and was decided that an Agenda on this would be placed in the SFS conference 2014 to look into the WMA scheme. Accordingly, the total limit was increased to ₹15,360 crore from ₹10,240 crore. In response to the increase in limits, utilization of WMA and OD increased substantially by select States (Annex 4.1). Thus, the dependence of select States on WMA continued in the post revision period also. 4.3 The average utilisation of WMA by the States put together against the total limits fixed stood at 2.1 per cent of the total limits in 2010-11, which increased to 3.2 per cent in 2012-13 and declined thereafter to 2 per cent in 2013-14 (Table 9). During 2014-15, however, the average utilisation of WMA by the States together stood at 4.79 per cent of the total limits for all States. Average utilisation of WMA and OD put together doubled during 2014-15 as compared to the previous year. Since March 2015, the monthly average utilisation of WMA/ OD by the States has been high upto October 2015 (Annex 4.1). Though States were encouraged to maintain positive cash balance at the end of the financial year, the utilisation of OD during March 2015 is a cause of concern despite increase in WMA limits in November 2013. Thus, linking enhanced WMA limit with increase in volume of transaction would not serve the purpose, as upto certain limits, the cash flow mismatches should be managed within the exiting WMA limit. Increase in volume does not automatically lead to an increase in the mismatch. | Table 9: Utilisation of SDF, WMA and OD by States | | (₹ Crore) | | Year | SDF | WMA | OD | | Peak Utilisation | Daily Average Utilisation | Peak Utilisation | Daily Average Utilisation | Average Utilisation as % to Total Limits | Peak Utilisation | Daily Average Utilisation | | 2007-08 | 1791.14 | 281.59 | 968.90 | 258.63 | 2.61 | 1292.99 | 108.72 | | 2008-09 | 1578.56 | 282.76 | 1111.42 | 54.11 | 0.55 | 700.56 | 12.41 | | 2009-10 | 1034.63 | 203.17 | 814.12 | 109.07 | 1.10 | 425.80 | 25.22 | | 2010-11 | 1323.34 | 414.71 | 985.00 | 212.46 | 2.14 | 1283.16 | 83.57 | | 2011-12 | 1149.46 | 294.36 | 1298.80 | 243.44 | 2.38 | 3073.19 | 82.03 | | 2012-13 | 1234.64 | 237.01 | 1220.00 | 326.76 | 3.19 | 999.19 | 121.70 | | 2013-14 | 1159.89 | 277.10 | 1265.90 | 313.93 | 2.04 | 1141.33 | 103.44 | | 2014-15 | 4594.75 | 487.89 | 3005.88 | 736.01 | 4.79 | 4204.95 | 246.69 | | Source: RBI records | Relationship between RD, Availment of WMA/ OD and Cash Surplus – An Empirical Analysis 4.4 Since 2011, the annual average availment of SDF/ WMA/ OD by the State Governments has increased year after year due to structural issues faced by some of the fiscally stressed States. Number of States availing WMA/ OD as at end-March increased from 3 in 2011 to 6 in 2015, which reveal that some part of these States’ GFD has been financed by borrowings from the RBI through WMA. Annual average overall liquidity mismatches (as measured by the utilization of NWMA, SDF and OD (NSO) has increased to ₹133.16 crore, ₹74.21 crore and ₹134.5 crore, respectively during 2014-15 from ₹72.94 crore, ₹60.19 crore and ₹62.82 crore during 2013-14. 4.5 A panel regression exercise was conducted in order to ascertain the linkages between structural/fiscal imbalances and economic growth on the one hand and liquidity imbalances of the State Governments on the other, over the period from 2007-08 to 2014-15. The dependent variable was overall liquidity mismatch, as given by the sum of the annual averages of NWMA, SDF and OD, which was also normalized by the aggregate (revenue plus capital) expenditure (NSO_TEXP). The independent variables were revenue deficit (RD), RD as a ratio of GSDP (RD_GSDP), RD as a ratio of GFD (RD_GFD), States investment in ITBs and the rate of growth of GSDP (GGSDP). Consolidated data on States’ availment of SDF/ WMA/ OD during 2007-08 to 2014-15 have been taken together for this exercise. In the panel data framework, both fixed effect and random effect models were attempted. 4.6 In the fixed effect model, the variables such as RD_GFD, the growth of GSDP and ITBs were found to be statistically significant (Table 10). The overall fit of the above equations are fairly good. In the fixed effect model, the RD_GFD is statistically significant at 1 per cent level. The positive sign in RD_GFD indicates that overall liquidity mismatches, as a ratio to aggregate expenditure (NSO_TEXP) would increase with an increase in RD. Alternatively, with a reduction in RD_ GFD, reflecting an improvement in the quality of fiscal adjustment, overall liquidity mismatches would decline. This seems likely, since a large part of revenue expenditure is committed and directed towards non-developmental purposes such as salary, pension, etc. If increase in revenue expenditure is more than covered by an enhancement of revenue receipts, then the revenue deficit would get reduced over a period of time, and would, thus, preempt a lower proportion of borrowings from the RBI. This, in turn, is likely to reduce the day-to-day mismatches in the cash flows of receipts and expenditures. 4.7 The coefficient of the rate of growth of GSDP (GGSDP) is negative and statistically significant at 5 per cent level in both the models. This indicates that an increase in the rate of growth of GSDP is associated with a reduction in overall liquidity mismatches. This is again on expected lines, since the size and regularity of cash inflows are likely to enhance during a phase of buoyant economic growth. The coefficient of investment in ITBs is negative and statistically significant at 10 per cent level in fixed effect model and at 5 per cent level in random effect model. This indicates that increase in availment of WMA/ OD from RBI will reduce States’ investment in ITBs. | Table 10: States Availment of NSO- Fixed effect model | | DEP. VAR | R2 | F | IND. VARs | COEFF | T-STAT | SIGNIFICANCE | | NSO_TEXP | 0.45 | 5.15 | RD_GFD | 1.15 | 3.37 | 0.001 | | | | | GGSDP | -1.11 | -2.084 | 0.039 | | | | | ITBs | -2.48 | -1.86 | 0.0649 | 4.8 In the random effect model also, variables such as ITBs, RD, growth rate of GSDP and RD_GFD were significant (Table 11). An attempt has also been made to segregate the data of special category and non-special category States. The fit of the non-special category States was statistically insignificant as many of them availed WMA/ OD occasionally while few States have availed WMA/ OD regularly. However, majority of the special category States have been availing WMA/ OD regularly and the result of the panel data regression under random effect model showed statistical significance at 1 per cent level for RD-GFD and 10 per cent level for other variables. | Table 11: States Availment of NSO- Random effect model | | DEP. VAR | R2 | F | IND. VARs | COEFF | T-STAT | SIGNIFICANCE | | NSO_TEXP | 0.14 | 6.14 | RD_GFD | 1.16 | 1.78 | 0.0773 | | | | | GGSDP | -3.99 | -2.113 | 0.0362 | | | | | RD | -7.62 | -2.78 | 0.0061 | | | | | ITBs | -1.16 | -2.505 | 0.0133 | STATES’ CASH FLOWS AND GOI TRANSFERS 4.9 Transfers from the GoI in the form of grants-in-aid and share in central taxes constituted about 40 per cent of the revenue receipts of all the States during 2009-10 to 2013-14 and in the case of special category States, it constituted about 75 per cent during 2013-14. Therefore, transfers from the Centre are also an important factor that determines the cash flows of the State Governments. To understand the impact on cash flows of States, tax transfers to States from GoI are analysed, both quarter-wise and month-wise. 4.10 Under quarter-wise analysis, usual trend in GoI transfers is observed where the last quarter of the year always receives the maximum tax receipts compared to the first three quarters. It is assumed that the gross tax revenue (GTR) collection of the GoI would be 40 per cent in the last quarter and 20 per cent each for the first three quarters. Accordingly, the budgeted GTR is bifurcated across four quarters as per the above ratio. On similar logic, it is also assumed that transfer from GoI to States is also as per the above ratio, i.e., 20 per cent each for Q1 to Q3 and 40 per cent for Q4. Against the budget estimates, the actual receipt of GTR by the GoI as reported in the monthly Government Accounts has been juxtaposed to ascertain the shortfall in collection at the GoI level. 4.11 The major observations at the GoI level reveal that GTR was ₹11,40,064 crore on an average during 2012-13 to 2014-15 and the same was distributed according to the ratio of 20 per cent for Q1 through Q3 and 40 per cent for Q4 (Table 12). The actual receipt of GTR as percentage to BE for GoI, on an average, worked out to 93.2 per cent during 2012-13 to 2014-15 and on a quarterly basis, it was at 72.5 per cent, 114.9 per cent, 115.4 per cent and 81.5 per cent for Q1 through Q4. It is observed that, GoI collection of GTR fell short of the estimate in Q1 and Q4 while around 15 per cent more than the assumed estimate was seen in Q2 and Q3. | Table 12: Gross Tax Revenue - Average of 2012-13 to 2014-15 | | Amt in ₹ Crore | | Item | Average of 2012-13 to 2014-15 | Average of 2012-13 to 2014-15 | | Q1 | Q2 | Q3 | Q4 P | | GoI | | 20% | 20% | 20% | 40% | | 1 | BE of Gross Tax Revenue by GoI | 1,226,002 | 245,200 | 245,200 | 245,200 | 490,401 | | 2 | Actual Gross Tax Revenue | 1,140,064 | 176,696 | 281,200 | 282,351 | 399,817 | | 3 | Tax Revenue receipt by GoI as a Percentage to BE (%) | 93.2 | 72.5 | 114.9 | 115.4 | 81.5 | | Assignments to States | | 20% | 20% | 20% | 40% | | 4 | Budget Estimate of GTR by States | 343,710 | 68,742 | 68,742 | 68,742 | 137,484 | | 5 | Actual Tax Revenue transfer from GoI to States | 315,862 | 76,956 | 76,452 | 75,796 | 93,184 | | 6 | Tax Revenue receipt by States as a Percentage to BE (%) | 92.2 | 111.9 | 111.2 | 110.3 | 68.6 | | P: provisional for Q4 of 2014-15 | | Source: http://cga.nic.in/ monthly account & Union Budget 2015-16. | 4.12 At the States level, it is observed that States received (transfer of tax revenues) marginally more than the estimates in the first three quarters, i.e., 111.9 per cent, 111.2 per cent, 110.3 per cent against 68.6 per cent in Q4, respectively. This shows that during Q1 through Q3, States received more than the estimates. In other words, keeping in view the assumptions, Central transfers to States was as per estimates and no uncertainties were observed except in the last quarter when overall collection of GoI itself was much lower than the estimates. Rather the shortfall in transfers in the last quarter was compensated with higher transfers in the first three quarters in spite of GoI collection being less than the estimates. On the whole, the GoI transfer to States was as per the estimates and no uncertainties were observed except in the last quarters. Accordingly, cash flow mismatch on account of transfers from the Centre seems limited, except in Q4. Assignments to States in excess of 100 per cent in the initial quarters would imply an automatic lower eligibility in the fourth quarter and that per se may not be a sign of uncertainty. INCREASE IN WMA LIMIT – OVERALL IMPACT ON MONEY SUPPLY AND MONETARY POLICY 4.13 The Reserve Bank, a unique central bank, has agreements with the sub-national Governments to act as banker. As a banker, the Reserve Bank is providing temporary advances to State Governments to facilitate normal financial operations. Loans and advances to State Governments in the form of SDF/ WMA/ OD is a unique scheme to tide over their cash flow mismatches. As once WMA limits are prescribed, States have the full freedom to access it and it becomes an autonomous component of liquidity over which the central bank has least control. Liquidity forecasting exercise becomes simpler for the central bank if the Governments maintain a targeted balance in their single treasury account (STA) with the central bank and pursue active cash management to ensure that they hit the targeted balance at the end of the day. While such a high degree of sophistication is not envisaged for the State Governments in the near future, they should ensure that the current WMA discipline is not weakened. 4.14 In the ultimate analysis, WMA to State Governments entails injection of liquidity to the financial system. Liquidity deficit of the Centre and the States adds to the liquidity in the financial system. This can, in principle, conflict with the primary monetary policy objective of achieving price stability. On an incremental basis, the increase in the net RBI credit to State Governments accounted for 1.9 per cent of accretion to reserve money during 2014-15, up from 0.4 per cent in 2013-14. Notwithstanding the many-fold increase, the contribution of WMA of State Governments to reserve money growth remained relatively modest. 4.15 In the absence of any means to forecast the WMA of State Governments, the day-to-day volatility can complicate making assessment of the system level expected liquidity mismatch on a daily/ intra-day basis. The resort to WMA by State Governments from the Reserve Bank represents an autonomous injection of liquidity to the banking system to meet temporary cash flow mismatches (and not to fund structural deficit) of State Governments that, ceteris paribus, needs to be offset by withdrawing liquidity through its liquidity management tools. However, in practice, WMA of State Governments, has been a small element in the overall liquidity exercise. If, however, all States are in WMA, and the amount varies significantly on a daily basis, it can have significant implications for liquidity management of the Reserve Bank. It is, therefore, imperative that State Governments continue to limit their recourse to WMA to minimise the spillover effects to the RBI’s monetary policy operations for the purpose of ensuring monetary stability. The increased utilisation of WMA at the year-end by the State Governments during the recent period (comparing end-March position of 2013, 2014 and 2015) is a cause of some concern. TOLERANCE LEVEL 4.16 The broad objectives of the Reserve Bank’s liquidity management operations are to ensure that liquidity conditions do not hamper the smooth functioning of financial markets and disrupt flow of funds to the real economy (Annex 6). The WMA to the State Governments results in an increase in liquidity in the financial system. The WMA, however, has historically remained a minor component in the reserve money expansion. Different States have different temporal patterns of liquidity gaps. It is the net position at the aggregate level that matters for liquidity management of the Reserve Bank. The increase in net Reserve Bank credit (WMA) to State Governments accounted for less than 2 per cent of the accretion to reserve money in 2014-15. This has been mainly because the WMA scheme provides for a strict discipline in cash management, involving in the extreme, suspension of payments to State Governments. Further, even when different States access the WMA facility across the year, they do not access WMA window at the same points of time. 4.17 While the WMA limits need to be arrived at as per the past practice adopted by the various Advisory Committees to provide for discipline in cash management and ensure fiscal prudence, the implications for monetary and liquidity management also have to be borne in mind. In view of the above, keeping in view the need for State Governments to continue with their progress in achieving fiscal consolidation, and taking note of the devolution that has been recommended by the 14th FC, as an outer limit in a year, the maximum share of incremental WMA in incremental reserve money should not exceed 2 per cent (i.e., ₹4,000 crore per annum) till the current WMA limit is exhausted, and contained within 1 per cent (₹2,000 crore per annum) thereafter. Since the financial year 2012-13, it is observed that the peak availment of WMA and OD by the States together was at ₹2,463 crore for 2012-13, ₹1,822 crore in 2013-14 and ₹5,455 crore during 2014-15. Thus, the incremental WMA in the incremental reserve money has been well within the tolerable limit. Keeping States’ past usage of WMA record, it is envisaged that States as a whole will not take recourse to the WMA facility at any given point of time, which would otherwise have severe monetary implications. IMPLICATIONS OF SURPLUS CASH BALANCES OF STATE GOVERNMENTS 4.18 Over the past decade, State Governments have accumulated sizeable surplus cash balances. The surplus cash balances of State Governments are invested automatically in ITBs of the GoI and form part of its liabilities. Though States are encouraged to maintain positive cash balance at the end of the financial year, about 4-6 States have availed WMA during the past four years (Annex 4.2). However, on an average, State Governments have been maintaining about ₹76,300 crore in the ITBs for the past five years (Annex 4.3). In addition, some States have invested in ATBs to the tune of about ₹53,800 crore, on an average, for the past three years (Annex 4.4). 4.19 At present, States cash balances are automatically invested in the ITBs of the GoI where the rate of interest is 5 per cent per annum, which is lower than other forms of borrowings, which are market determined rate. The revenue loss to the States is evident from the difference in the ITB rate and the market rate for their borrowings. Many States have expressed concern on this negative carry (Annex 8). States have suggested that the Bezbaruah Committee had changed the bench mark interest rate on WMA/ OD from the Bank rate to Repo rate, thus the return on States’ investment in ITBs should also have been linked ideally to the Repo rate. 4.20 The 14th FC observed that State Governments, in aggregate, have reported sizeable cash balances during the recent period. While it is necessary for the States to keep adequate cash balances to cover risks, excessive balances entail costs, both in terms of interest payments and lower capital expenditures. There is merit in analysing the reasons that led to holding of such costly large cash balances during the period and addressing the relevant issues such as negative carry in the cash balance of the States. Overall, State Governments should undertake prudent measures to improve their cash management practices and attempt to minimize the access to WMA facility, if not fully eliminated. V. CONCLUSIONS AND RECOMMENDATIONS 5.1 As observed from the discussions in the preceding chapters, the fiscal position of the States during the very recent period is different from the situation that prevailed before 2006-07, when the report of the last Advisory Committee (Chairman: Bezbaruah) was disseminated. First, States have been adhering to fiscal discipline envisaged by the 13th FC, which has been reiterated by the 14th FC. Second, overall availment of WMA/ OD by the States has decreased significantly as compared with the position before 2006-07. Only few States availed WMA/ OD from the Reserve Bank frequently while some States resorted to WMA occasionally to meet their temporary cash flow mismatches. Third, States’ investments in ITBs and ATBs have increased significantly during the recent period due to prudent cash management by the States. Fourth, financing of GFD of the States are mainly from market borrowings than small savings and other sources of financing as seen earlier. The 14th FC has recommended for exclusion of State Governments from the operations of the NSSF, which may further increase the share of market borrowings in financing the fiscal deficit. Fifth, financing of GFD through borrowings from the Reserve Bank has declined significantly as only six States availed WMA at the end of the financial year 2014-15 compared to 20 States at the end of March 2005. Finally, the fiscal size of the State budgets has increased significantly since the last Committee based WMA revision as the revenue receipts, revenue expenditure, capital outlay and loans and advances increased by over 15 per cent on a CAGR basis. Against this backdrop, this Committee has attempted to formulate WMA and OD schemes best suited to the requirements of the States while keeping in view the need for appropriate fiscal discipline. RECOMMENDATIONS OF THE COMMITTEE NORMAL WMA LIMITS 5.2 The WMA Scheme has been periodically reviewed, keeping in view the States’ requirements; the evolving fiscal, financial and institutional developments as well as the objectives of monetary and fiscal management. As stated earlier in the report, the formula for Normal WMA limits were last revised in 2006-07 on the basis of Bezbaruah Committee recommendations, which proposed that the base should be taken as the average of the latest three years total expenditure excluding repayments and adjusted for one-time ad-hoc expenditures and lottery expenditures (Accounts). It is observed that previous three Advisory Committees/ Group recommended increase in WMA limits ranging between 34.1 per cent and 76.4 per cent during 1998- 2005 (Table 13). While the Vithal Committee adopted revenue receipt and capital expenditure as the base, the Ramachandran Committee fixed the WMA limits based on revenue receipts, and the Bezbaruah Committee took the total expenditure with some adjustments for revenue deficit and one-time expenditure as the base to fix the WMA limits. This Committee deliberated on the current WMA limits, adequacy of the limits, utilization of the WMA by the States, size of temporary mismatches as also macroeconomic issues such as States’ fiscal position, fiscal-monetary coordination, etc., while formulating the formula. | Table 13: Increase in WMA Limits over the Period | | Limits recommended by | Non-Spl. Category States
(₹ Cr) | Spl. Category States
(₹ Cr) | Total
(₹ Cr) | Increase
(%) | | Limits prior to Advisory Committee based Revision | 2,033 | 202 | 2,234 | | | Vithal Committee (1998) | 3,589 | 352 | 3,941 | 76.4 | | Group of SFSs (2000) | 4,794 | 489 | 5,283 | 34.1 | | Ramachandran Committee (2003) | 6,445 | 725 | 7,170 | 35.7 | | Bezbaruah Committee (2005) | 8,820 | 1,055 | 9,875 | 37.7 | | Current Limits (Since Nov 11, 2013) | 13,305 | 2,055 | 15,360 | 55.5 | | Note: WMA limits for UT of Puducherry and J&K were included in 2007-08 and 2011-12, respectively. | Observations of the Committee 5.3 Current Status: As stated earlier, the current scheme of WMA limits for the State Governments was launched in 2006-07 based on the Bezbaruah Committee formula8, with a limit of ₹9,875 crore9. Since then, annual reviews on WMA limits were undertaken; however, the limits were kept unchanged as utilisation was low and generally availed by the same 8 to 10 States on a regular basis (Table 8). Thereafter, based on the discussion in the SFS conference held in May 2013, as also on the basis of cash flow analysis of some States undertaken by the Reserve Bank, revision was effected from November 11, 2013 whereby the WMA limits were increased by 50 per cent of the then existing limits and the full-fledged revision of WMA formula was to be decided through this Committee. 5.4 Adequacy of WMA/ OD Limits: Though many States managed their cash flows without recourse to advances from the Reserve Bank, few States availed WMA/ OD from the RBI to tide over their temporary cash flow mismatches. The purpose of increase in the WMA limit in November 2013 was to limit few States going in for OD frequently, however, the position did not improve much thereafter. Thus, there is a difficulty to distinguish between the liquidity needs and sign of underlying structural imbalance in the finances of some of the States. Thus, if WMA is seen as additional finance, it may not be appropriate in the FRBM regime. At the same time, there could be genuine requirement on the part of the States to tide over their temporary liquidity problems. Thus, taking into account the significant increase in fiscal size of the States, as also to provide some cushion to keep pace with the fiscal developments, the Committee felt that there is a need to revise the WMA limits at this stage. 5.5 Relationship between Deficit Indicators and WMA Limits: Empirical evidence suggests that if increase in revenue expenditure is more than covered by higher revenue receipts, then the revenue deficit reduces over a period of time, and thereby leads to a lower access to WMA from the Reserve Bank. However, the growth of revenue receipts was not in tandem with the growth of revenue expenditure for all the States, which forced some States to resort to higher WMA/ OD from the RBI. 5.6 Fiscal-Monetary Coordination: As a banker to the State Governments, the Reserve Bank has to provide a space within which legitimate mismatches can reasonably be expected to be handled and not to fine-tune flows of revenues and expenditures of the States within such space. At the same time, the flows from the Reserve Bank should not hinder its monetary policy operations, in particular, liquidity management. Therefore, in view of fiscal-monetary coordination of keeping the liquidity at a tolerable level, internal assessment of optimum WMA limit advocates that, in case of revision, the maximum share of incremental WMA in incremental reserve money should ideally be limited to 2 per cent till the extant WMA limit of ₹15,360 crore is exhausted, and contained within 1 per cent, once the extant WMA limit is crossed. It is imperative to minimise the spillover effect of enhanced WMA to the Reserve Bank’s monetary policy operations for the purpose of ensuring monetary stability operations in an environment of inflation targeting regime. Since the financial year 2012-13, it is observed that the peak availment of WMA and OD by the States together was at ₹2,463 crore for 2012-13, ₹1,822 crore in 2013-14 and ₹5,455 crore during 2014-15. Thus, the incremental WMA in incremental reserve money was well within the tolerable limit. During 2015-16 (upto September 2015), the peak availment of WMA/ OD by the States, at any one point of time, stood at ₹4,864 crore. In view of the above, the spillover effect of enhanced WMA limit is likely to be limited from the point of view of monetary stability. WMA Formula 5.7 The Committee deliberated exhaustively taking into account all the factors as discussed above and decided to chalk out an accommodative path in working out a formula for WMA limit. In accordance with this approach, the Committee considered various scenarios/ basis for the revision of WMA in detail, viz., GFD, GSDP, total expenditure, revenue receipts, total expenditure minus revenue deficit, etc., as basis for WMA formula. 5.8 As the WMA is to finance the temporary mismatch in cash flows, the limits should normally be fixed taking into account the variation in the flow of revenue and expenditure and consequent mismatches and the capacity of a State to raise resources on its own to cover such mismatches. Therefore, the WMA limits for States have to be evolved on the basis of some principles that capture cash flow mismatches. Accordingly, the Committee also decided for a simplified formula that would represent the cash flows. In view of the above, various exercises based on different combination of expenditure/ receipts were undertaken, which are listed in Annex 7. After due deliberation on various combinations of WMA formula, the Committee decided to adopt total expenditure as the basis for calculation of WMA limit, which is a logical surrogate for cash flows in the absence of cash flow forecasting framework at the State level. It may be mentioned that the minimum balance was also revised in March 1999 based on the average base of total expenditure excluding revenue deficit. WMA Calculation Based on Total Expenditure 5.9 Keeping in view the fairly significant structural changes in Central and State finances over the past ten years, it was felt that there is a case for allowing States reasonable medium-term room with respect to WMA access. The 13th FC had, after taking into account the fiscal situation of the fiscally stressed States, recommended that all the States to eliminate their revenue deficits by 2014-15. However, about 12 States registered revenue deficit during that year. Therefore, while analyzing the suitability of the base for the WMA formula, revenue receipt was not considered. In case of GSDP, it was observed that, for some States, GSDP was not in alignment with their fiscal size, thus adopting a formula on this basis did not provide a clear picture. Similarly, as the growth of capital expenditure was very low for many States compared to revenue expenditure and revenue receipt, WMA formula on these lines was not attempted. On the contrary, WMA formula based on total expenditure reflected somewhat equal distribution of limit to all States according to their fiscal size. Keeping the above in view, the Committee recommends that WMA limit will be set on the basis of total expenditure adjusted for lottery expenditure until commencement of fiscal year 2017-18. Quantum of WMA Limit 5.10 As the total expenditure excluding lottery expenditure has recorded a CAGR of 15.4 per cent since the last formula based WMA revision, it was considered that the increase in the quantum of WMA should also be in tandem with the growth in total expenditure. Accordingly, the WMA quantum works out to ₹32,225 crore for all the States. State-wise Limit 5.11 As the special category States are getting about 75 per cent of their revenue receipts through GoI transfers including Central plan assistance, the committee felt that the categorization of States as special and nonspecial should be retained for fixing the WMA limits even though the 14th FC has discontinued the distinction between special category and non-special category States. However, the NITI Aayog, in its report of the Sub Group of Chief Ministers on Centrally Sponsored Schemes (October 2015), has classified the special category states as Himalayan States (3 states) and North Eastern States (8 states). Therefore, to be in conformity with the above classification, wherever possible, the nomenclature of Himalayan States and North Eastern States (HS&NES) has been used in place of special category States in this report. In accordance with the total expenditure as the base for distribution, the quantum of WMA limit was distributed among the States in terms of a consensus formula, keeping in view various other issues as detailed below. 5.12 The quantum of WMA was bifurcated between the HS&NES and other States in the ratio of 12.81:87.19, which was the average of the distribution ratio observed since 2005-06. Thereafter, the State-wise WMA limits for HS&NES and other States were obtained by applying the ratio10 of 2.78 per cent and 2.03 per cent, respectively, to the base, which was the average of total expenditure (revenue expenditure plus capital expenditure) excluding lottery expenditure of the States derived from the financial accounts during the previous three years (2011-12 to 2013-14) (Annex 5). The calculated limits were rounded off to the next ₹5 crore. It was observed from the calculated limits of the States that the rate of growth in WMA limits ranged between 33.3 per cent and 149.3 per cent among the States. Therefore, to maintain inter-state overall increase and to moderate the outliers, it was considered to provide a lower bound growth and also fix a ceiling. Towards this approach, standard deviation was used to distribute the WMA limits normally around the mean rate of growth. Accordingly, the maximum growth in the revised WMA limits was capped at 132 per cent and the minimum growth was scaled up to 70.6 per cent to maintain the inter-state equity. As the revised WMA limit was very low for Puducherry, the multiplying ratio for HS&NES has been used for this Union Territory. Accordingly, the State-wise proposed WMA limits are set out in Table 14. The Committee recommends that the revised limits be implemented in the current financial year, from January 2016. These limits would continue for two years upto December 2017. Thereafter, a review may be undertaken as explained in the following paras. The multiplying ratio of 2.78 per cent and 2.03 per cent of the total expenditure of the HS&NES and other States effectively works out to 36.08 per cent and 42.28 per cent, respectively of their average revenue receipts. A limit of this order should provide more than abundant cushion to cover the liquidity mismatches that could arise even from any unexpected shortfall in revenue flows to take care of the increasing expenditure. | Table 14: Proposed WMA Limits | | (₹ Crore) | | Sl. No | State | Existing Limit | Average Base (2011-12 to 2013-14) | Recom- mended Limit | % Increase | | I. | Other States (Non-HS&NES) (Ratio: 2.03 per cent) | | 1 | Andhra Pradesh | 770.0 | 127,317 | 1,510 | 96.1 | | 2 | Bihar | 637.5 | 69,931 | 1,420 | 122.7 | | 3 | Chhattisgarh | 285.0 | 34,327 | 660 | 131.6 | | 4 | Goa | 97.5 | 7,483 | 170 | 74.4 | | 5 | Gujarat | 945.0 | 94,139 | 1,915 | 102.6 | | 6 | Haryana | 442.5 | 45,064 | 915 | 106.8 | | 7 | Jharkhand | 420.0 | 28,824 | 720 | 71.4 | | 8 | Karnataka | 937.5 | 97,669 | 1,985 | 111.7 | | 9 | Kerala | 525.0 | 59,668 | 1,215 | 131.4 | | 10 | Madhya Pradesh | 690.0 | 84,640 | 1,600 | 131.9 | | 11 | Maharashtra | 1,740.0 | 166,541 | 3,385 | 94.5 | | 12 | Odisha | 450.0 | 48,497 | 985 | 118.9 | | 13 | Punjab | 540.0 | 42,934 | 925 | 71.3 | | 14 | Rajasthan | 757.5 | 80,246 | 1,630 | 115.2 | | 15 | Tamil Nadu | 1,095.0 | 121,685 | 2,475 | 126.0 | | 16 | Telangana | 550.0 | | 1,080 | 96.4 | | 17 | Uttar Pradesh | 1,530.0 | 176,051 | 3,550 | 132.0 | | 18 | West Bengal | 817.5 | 95,859 | 1,895 | 131.8 | | | Sub-Total (I)11 | 13,230.0 | 1,380,873 | 28,035 | 109.3 | | II. | HS&NES (Ratio: 2.78 per cent) | | 19 | Arunachal Pradesh | 97.5 | 6,933 | 195 | 100.0 | | 20 | Assam | 450.0 | 33,732 | 940 | 108.9 | | 21 | Himachal Pradesh | 285.0 | 19,771 | 550 | 93.0 | | 22 | Jammu and Kashmir | 472.5 | 31,539 | 880 | 86.2 | | 23 | Manipur | 90.0 | 7,008 | 195 | 116.7 | | 24 | Meghalaya | 90.0 | 6,292 | 175 | 94.4 | | 25 | Mizoram | 82.5 | 5,698 | 160 | 93.9 | | 26 | Nagaland | 120.0 | 6,955 | 205 | 70.8 | | 27 | Tripura | 150.0 | 7,097 | 255 | 70.0 | | 28 | Uttarakhand | 217.5 | 18,991 | 505 | 132.2 | | | Sub-Total (II) | 2,055.0 | 144,017 | 4,060 | 96.6 | | 29 | Puducherry | 75.0 | 4,121 | 130 | 73.3 | | | Total (All States) | 15,360.0 | 1,529,011 | 32,225 | 103.7 | Guidance for Future Revision 5.13 The Committee felt that linking WMA limits to total expenditure may provide an incentive to States to increase expenditure to avail higher WMA. While this is unlikely to happen in the case of States, which are in revenue surplus, it may be a cause for concern for States that have structural revenue deficits. At the same time, States are bound by the FRBM rule. 5.14 The 14th FC has addressed the structural issue impacting State finances in its recommendations. Based on their medium term assessment of individual States’ fiscal position, it has recommended post devolution revenue deficit grants to 11 States. In its assessment, these grants should, along with the vertical and horizontal devolutions, eliminate structural revenue deficits. The Commission’s recommendations were implemented commencing FY 2015-16 and States require some transition time to adjust their finances in line with the new vertical and horizontal devolution. The Committee, therefore, is of the view that it is necessary to allow such transition to take effect. Hence, the Committee recommends that a review be undertaken by the Reserve Bank in 2017 when the final total expenditure numbers for FY 2015-16 will be available. Commencing from that year, the WMA limits should be based on total expenditure minus any revenue deficit and lottery expenditures. Thus, the WMA limits for FY 2018-19 would be based on the expenditure for 2015-16 adjusted as above. 5.15 Some States have been issuing Discom Bonds since 2014-15, the proceeds of which are used to enhance the equity base of State Distribution Companies. This is a fiscal outlay that is not a part of Government’s regular capital expenditure program. It should not, therefore, be considered in assessing the size of WMA expenditures. SPECIAL DRAWING FACILITY 5.16 State Governments first resort to SDF to tide over their temporary mismatch in their cash flows against the collateral of investments in GoI dated securities, ATBs and incremental investments in CSF and GRF. The Committee is of the view that the facility of availing of SDF be continued to be linked against the collateral of investments made in the GoI securities without any upper ceiling and the usual haircut margin of 5 per cent would be applied. CSF/ GRF Investments and Availment of SDF 5.17 Most of the States have constituted the CSF scheme and have been using the SDF facility against such investments. Currently, the net incremental annual investment of States (i.e., outstanding balance over and above the level in the corresponding period of the previous year) is eligible for availing SDF upto a maximum of the WMA limit fixed for the State. The Ramachandran Committee recommended that SDF should continue as an exclusive scheme based on investments in Central Government securities which are unencumbered and should not include those securities which are covered under the CSF/GRF to avoid double mortgage issue. However, to provide incentive to build up CSF and GRF, Bezbaruah Committee recommended for SDF eligibility against the collaterals of incremental investment in these Funds upto a ceiling equivalent to WMA limit. 5.18 As per the CSF scheme, States are eligible to withdraw the accrued and accumulated interest income upto the close of the previous financial year to pay back their high cost liabilities and States have been doing so. With regard to the withdrawal of the principal from the CSF, the scheme mentions that a review thereof may be taken at an appropriate period after the lock in period of five years. With the expiry of the lock in period, some State Governments have requested for the withdrawal of CSF principal to repay their high cost borrowings as also for the economic use of the Fund. 5.19 An Agenda item on the above was discussed in the 28th conference of SFS held in May 2015 wherein, States additionally requested that, after withdrawal of principal from the CSF, the eligible limit of SDF should not be curtailed, as States would be forced to avail high cost borrowings of WMA / OD. Further, SDF facility acts as an incentive to maintain the Fund, and upon withdrawal, the SDF eligibility limit gets reduced as it is linked to incremental investment. Additional ToR for the Committee 5.20 In view of the discussions held in the SFS conference, the issue of withdrawal from CSF and its consequent impact on SDF eligibility was referred to the Committee for further deliberation and recommendations thereon. The Committee observed that allowing principal and accrued and accumulated interest income withdrawal without curtailing the SDF eligibility would defeat the very purpose of maintaining the CSF as an amortization Fund. In view of the discussions held in the SFS conference as also intensive discussions by the Committee about the pros and cons of the impact of SDF eligibility on CSF/GRF withdrawal, it is proposed that the present system of incremental investments in CSF and GRF should continue for deciding the eligibility of SDF. 5.21 The Committee observed that incremental investments in CSF and GRF by some States were much more than the SDF limit available to them (Table 15). In other words, States’ large investment in CSF is to build up the Fund to meet any payment obligations than the additional objective of SDF facility attached to it. The Committee further observed that, at present, other investments of States, such as in Government dated securities and ATBs, are unencumbered and qualify for SDF without any limit. As an incentive to build the CSF and GRF corpus liberally as also to align with the eligibility applicable to Government dated securities and ATBs, the Committee recommends that entire incremental investments in CSF and GRF be eligible for SDF without any limit in line with dated securities and ATBs investments. The CSF and GRF have been created for specific purpose (first charge), withdrawals from these Funds should automatically limit the eligibility of SDF (second charge) as the withdrawn securities will not be available as collateral. Therefore, the committee also recommends that the SDF eligibility is to be decided on a daily basis to avoid such double mortgage issues. This would encourage States to contribute to the Fund. At the same time, with higher SDF limit, States interest payout would decline as SDF is availed before WMA and attracts one per cent less than WMA rate. Consequently, States’ access to OD may also decline which would also result in lower interest expenditure. | Table 15: CSF/GRF Investment and SDF Eligibility – As at end-March 2015 | | (₹ Crore) | | Sl. No | State | Incremental Investment in CSF/GRF | Normal WMA Limit | SDF Limit | Investment not Counted for SDF | | 1 | Andhra Pradesh | 1105.44 | 770.00 | 770.00 | 335.44 | | 2 | Arunachal Pradesh | 50.55 | 97.50 | 50.55 | 0.00 | | 3 | Assam | 604.90 | 450.00 | 450.00 | 154.90 | | 4 | Bihar | 1141.14 | 637.50 | 637.50 | 503.64 | | 5 | Chhattisgarh | 375.20 | 285.00 | 285.00 | 90.20 | | 6 | Goa | 0.00 | 97.50 | 0.00 | 0.00 | | 7 | Gujarat | 1085.20 | 945.00 | 945.00 | 140.20 | | 8 | Haryana | 0.00 | 442.50 | 0.00 | 0.00 | | 9 | Karnataka | 153.15 | 937.50 | 153.15 | 0.00 | | 10 | Kerala | 113.85 | 525.00 | 113.85 | 0.00 | | 11 | Maharashtra | 0.00 | 1740.00 | 0.00 | 0.00 | | 12 | Manipur | 55.68 | 90.00 | 55.68 | 0.00 | | 13 | Meghalaya | 58.95 | 90.00 | 58.95 | 0.00 | | 14 | Mizoram | 55.20 | 82.50 | 55.20 | 0.00 | | 15 | Nagaland | 71.33 | 120.00 | 71.33 | 0.00 | | 16 | Odisha | 1590.60 | 450.00 | 450.00 | 1140.60 | | 17 | Puducherry | 136.08 | 75.00 | 75.00 | 61.08 | | 18 | Tamil Nadu | 711.82 | 1095.00 | 711.82 | 0.00 | | 19 | Telangana | 528.32 | 550.00 | 528.32 | 0.00 | | 20 | Tripura | 66.51 | 150.00 | 66.51 | 0.00 | | 21 | Uttarakhand | 375.74 | 217.50 | 217.50 | 158.24 | | 22 | West Bengal | 1071.90 | 817.50 | 817.50 | 254.40 | 5.22 The Committee observed that the CSF is an amortization fund, which creates a cushion to meet repayment obligations in times of fiscal/market stress, boosts investor confidence and thereby facilitates States’ borrowing in the primary market at a reasonable cost. While there could be a trade-off between CSF investment and development expenditure in the very short-term, there is also a trade-off between roll-over risk, and debt sustainability and development. The CSF investment, even in the context of revenue/ fiscal deficit, is worthwhile as it is likely to edge out expenditure with low economic return while reducing the roll-over risk of debt. Therefore, the Committee urges the few remaining States to join the CSF scheme, which would facilitate the States to avail SDF at times of temporary cash flow mismatches and also withdraw from the fund to repay any liabilities at times of need. Investment in ATBs and Availment of SDF 5.23 During the recent period, it has been observed that few State Governments transfer their ITB balances to ATBs on account of interest rate differential without making prudent cash management exercise. As a result, few States end up availing SDF from RBI after investing their cash balances in ATBs. However, this would tantamount to arbitrage activities as the SDF is provided with lower rate of interest than the WMA. Under such scenario, States avail concessional funds from the RBI through SDF window to meet their temporary cash flow mismatch while their cash surplus is invested in ATBs, say 91 day treasury bills at a higher yield. 5.24 The Bezbaruah Committee recommended that, “States may be permitted to invest their cash surplus in dated GoI securities, provided that they have not availed WMA in the immediately preceding period of 90 consecutive days. The minimum specified period of 90 days would be consistent with the tenure of WMA, and should help to obviate any possible incentive to utilise short-term accommodation from the RBI for purposes of longer-term investment”. As ATBs are also government security, it would be advisable for States to invest in ATBs when they have not availed SDF for the previous 90 days. Further, States may adhere to prudent cash management to avoid borrowing from the Reserve Bank while their surplus is invested in ATBs. To encourage prudent cash management practices of the State Governments, if a State avails SDF against such investment in 91 day TBs, Committee recommends that in the first occasion, this arbitrage activity may be allowed for a limited period. When States avail SDF against the investment in 91 day TBs, they will not be allowed to invest further in 91 day TBs for the next 90 days. However, if such practices of availing SDF and subsequent investment in 91 day treasury bills continue in the second and subsequent occasions during the financial year, such SDF availed would be treated as WMA after the first occasion. This will help to curtail arbitrage activities. Further, availing of SDF against the collateral of GoI dated securities and other ATBs (i.e., 182 day and 364 day treasury bills) will continue as mentioned in the beginning of this para (as per Bezbaruah Committee recommendation). OVERDRAFT REGULATION 5.25 In case of availment of OD, normally time restrictions are prescribed for the States and not the quantum restrictions. However, the previous Advisory Committees recommended for restricting the availment of OD generally to the extent of WMA limits. When States’ availment of OD exceed their WMA limits for notice period of five consecutive working days in the second and subsequent occasions, the payment will be stopped, irrespective of the rule of OD availment for 14 consecutive working days. Therefore, on the first occasion, unlimited OD may be availed beyond five consecutive working days subject to a time limit of 14 consecutive working days. In such a scenario, States would be advised to bring down their OD availment within their WMA limits. In a quarter, the OD availment should not exceed 36 days as recommended by the previous Committees. Accordingly, the Committee recommends that the existing time restriction for availing of OD may continue. INTEREST RATES ON SDF, WMA AND OD 5.26 The interest rate on various parameters affecting the fiscal position of the States is in Appendix Table 1 and in Chart 1. During the recent period, the repo rate increased to a peak of 8.5 per cent on October 25, 2011, which continued upto March 9, 2012. Thereafter, the repo rate exhibited mixed trend and reduced to 6.75 per cent in October 2015. As the Repo rate is the policy rate and other money market rates are expected to converge with the Repo rate, the interest rate on WMA/ OD will continue to be linked with the policy rate of the Reserve Bank, i.e., Repo rate. Accordingly, as the SDF is provided against the collateral of the State Governments’ investments, it would continue to attract Repo rate minus 1 per cent for all the days it is outstanding. 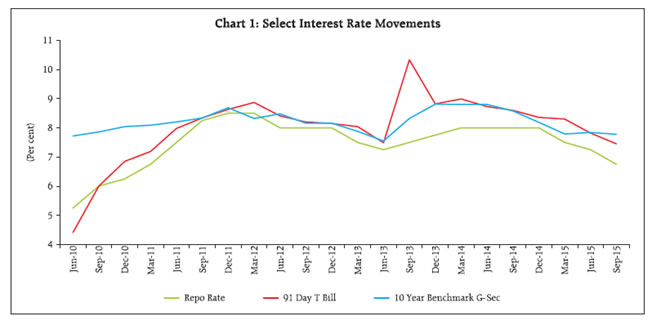 5.27 As the WMA is provided as a running facility, currently, the interest rate on WMA outstanding upto 90 days is being charged at repo rate and beyond 90 days, it is being charged at Repo rate plus 1 per cent. In view of continuing trend in availing additional accommodation through SDF to the tune of about ₹54,000 crore, on an average, as also the Committee’s recommendation to remove the restriction on SDF eligibility to a level of WMA limits against the incremental investments in CSF and GRF, the Committee felt that the WMA may generally be restricted to, in each case, not later than three months from the date of the making of the advance in terms of Section 17 (5) of the RBI Act 1934. Therefore, keeping the trends in availing of WMA during the recent period and enhanced accommodation through SDF and WMA limits, the Committee recommends that the WMA should generally be restricted upto a maximum of three months from the date of making the advance. Accordingly, the Committee also recommends to continue the interest rate on WMA at Repo rate. In view of that, States may be encouraged to restrict such advances within three months from the date of availing the same. In case a State’s WMA outstanding continues for more than three months from the date of such advance, as a precautionary stance, a higher interest of Repo rate plus 1 per cent will be charged as in the past. 5.28 Some State Governments, in the SFS conference, expressed that reduction in the interest rate on OD may be considered. With enhanced accommodation through SDF and increase in WMA limits, it would be prudent for the States to restrict the availment of OD and manage the cash flow mismatch within the WMA limit. Further, fiscal discipline envisaged by the FCs is to be adhered to by the States. Thus, it would be prudent that availment of unlimited OD may be discouraged. Therefore, availing of OD upto the WMA limits would continue to attract Repo rate plus 2 per cent and the present structure of charging the penal rate of interest of Repo rate plus 5 per cent for OD availment beyond WMA limits would continue without any modification. INVESTMENT OF DURABLE CASH BALANCES IN ITBs 5.29 Effective cash management assumes significance as sub-optimal utilization of cash balances adds burden to the fisc. Intra-year budget execution is a challenge as both the timing and seasonality of cash flows can result in temporary mismatches. International best practices reveal that prudent cash management ensures that adequate cash is available to pay for expenditures when they are due, pooling the revenues in a Single Treasury Account, borrow only when needed to minimize borrowing costs and to maximize returns on idle cash. Towards this approach, the Committee felt that Cash Flow Statement may be prepared on a weekly/ fortnightly basis and forecast be updated with latest information to improve the cash management of the States. 5.30 Realizing the need to meet any prospective exigency, States have taken recourse to build-up cash surplus as a precautionary measure. Further, with the improvements in the fiscal position, there has been a build-up of cash balances with the States during the recent period. The surplus cash balances of States have persisted and stood at ₹1,23,611 crore as at end-March 2015, as compared with ₹1,32,476 crore as at end -March 2014 (including ATBs). Some part of these cash balances has arisen mainly to take care of the temporary liquidity mismatches and thus reflects a tendency on the part of the States to avoid recourse to WMA/ OD. 5.31 Since the surplus cash balances are automatically invested in 14 day ITBs, which is the liability of the GoI, they do impart volatility to the cash balances of GoI that in turn affect the liquidity management of the Reserve Bank. Therefore, it is imperative to predict the States cash flows accurately to the extent possible to capture in advance the expected daily changes in aggregate cash surplus. Towards this direction, States are recommended to adhere to efficient cash flow management and forecast practices as also inform the Reserve Bank about the expected large scale variations in their cash flows. This practice would result in better liquidity management by the Reserve Bank for its monetary policy operations. FUTURE REVISION OF WMA SCHEME 5.32 As the proposed WMA limits and enhanced SDF limits are considered to be adequate to take care of any temporary cash flow mismatches arising out of increased expenditures of the States, while maintaining the fiscal discipline within the source of financing, it may not be necessary to revise the WMA limits every year. As recommended, the proposed limits may be continued upto December 2017 and thereafter, a review be undertaken to decide the quantum of WMA for 2018- 20, which will co-terminus with the 14th FC award period. Therefore, the Committee recommends that the next revision of WMA scheme may be effected in 2020-21 taking into account the then fiscal positions of the States and the road map likely to be deliberated in the 15th FC report.
| ANNEX 1: WMA REVISION - RECOMMENDATIONS BY PREVIOUS COMMITTEES (Contd.) | | Item | Just Prior to Vithal Committee | Vithal Committee | Group of State Finance Secretaries | Ramachandran Committee | Bezbaruah Committee | | Normal WMA | | Methodology for Computation of WMA Limit | Expressed 168 times the minimum balances of the States. | Average of revenue receipts and capital expenditure of the latest three years multiplied by a ratio of 2.25% for non-special category States and 2.75% for special category States | Average of revenue receipts and capital expenditure of the latest three years multiplied by a ratio of 2.4% for non-special category and 2.9% for special category States | Average of only revenue receipts of latest three years multiplied by a ratio of 3.19% for non-special category and 3.84% for special category States. | Average of revenue expenditure and capital expenditure of the latest three years adjusted for ad hoc expenditures and multiplied by a ratio of 3.1% for non-special category and 4.1% for special category States | | Aggregate WMA Limits | ₹ 2,234 crore | ₹ 3,941 crore | ₹ 5,283 crore | ₹ 7,170 crore | ₹ 9,875 crore | | i) Non-Special Category States | ₹ 2,033 crore | ₹ 3,589 crore | ₹ 4,794 crore | ₹ 6,445 crore | ₹ 8,820 crore | | ii) Special Category States | ₹ 202 crore | ₹ 352 crore | ₹ 489 crore | ₹ 725 crore | ₹ 1,055 crore | | Special Drawing Facility | | Computation of limits (Margin) | Limits were placed at 64 times the minimum balances | Investment in G-Secs | Investment in G-Secs | Investment in G-Secs 5 per cent uniformly. | Investments in GoI securities plus incremental investment of CSF and GRF subject to a maximum of NWMA limit. | 15 %*
10 %** | 15 %*
10 %** | | Use of SDF | Availed of after NWMA | Availed of after NWMA | Availed of after NWMA | To be availed of before utilising NWMA limit. | To be availed of before utilising NWMA limit. |
| ANNEX 1: WMA REVISION - RECOMMENDATIONS BY PREVIOUS COMMITTEES (Concld.) | | Item | Just Prior to Vithal Committee | Vithal Committee | Group of State Finance Secretaries | Ramachandran Committee | Bezbaruah Committee | | Overdraft Scheme | | No. of consecutive working Days | 10 | 10 | 12 | 14 | 14 | | No. of days in a quarter | – | – | – | 36 | 36 | | No. of consecutive working days in excess of NWMA limit | – | 3 | 5 | 5 | 5 | * For securities with residual maturity of more than 10 years.
** For securities with residual maturity of less than 10 years. |
ANNEX 2: MINIMUM BALANCE AND WMA TO THE STATE GOVERNMENTS: A HISTORICAL REVIEW In terms of the agreement between the RBI and State Governments under Section 21A of the RBI Act 1934, the latter have to maintain with the Reserve Bank such minimum balances as may be agreed upon from time to time and the Reserve Bank grants WMA to the State Governments up to certain limits. The minimum balances and limits for WMA of State Governments were fixed for the first time on April 1, 1937 and this became effective only from April 1, 1938 when the then provincial Governments became responsible for managing their own Ways and Means position. The minimum balances were fixed in 1937 on the basis of the ratio of the total revenue and expenditure of the concerned provincial Government to the total revenue and expenditure of the pre-provincial autonomy Central Government. The Finance and Revenue Accounts of the three years 1931-32 to 1933-34 were considered for this purpose. With the coming into force in January 1950 of the Constitution of India, the Reserve Bank of India Act was amended in 1951 by insertion of Section 21A, which authorised the Bank to act, by agreement, as banker to the States. With the reorganisation of States, their classification into Part A, Part B and Part C States disappeared and except in regard to certain Union Territories, all States were placed on the same footing. The minimum balances so fixed also represented the limits up to which States could avail themselves of WMA from the RBI. This position continued up to 1953. 1953 REVISION The minimum balances were found to be inadequate by the Bank in 1953 on the basis of the revenue and expenditure of State Governments. The State Governments had also availed of WMA considerably in excess of the prescribed limits to meet the gap between revenue and expenditure. A revision of the minimum balances and WMA limits was, therefore, undertaken in 1953. The basis which was adopted for arriving at the revised minimum balances was as under: -
The minimum balances of Part A States, fixed in 1937, were increased by the ratio of the increase in the total amount of the average revenue and expenditure charged to revenue budget in the years 1948-49 to 1950-51 to the total amount of revenue and expenditure charged to revenue budget in the three years 1931-32 to 1933-34. -
The minimum balances of Part B States were similarly arrived at on the basis of the revenue and revenue expenditure in the two years 1949-50 and 1950-51. -
The total minimum balances on this basis amounted to ₹ 8.70 crore as against a sum of about ₹ 2 crore stipulated earlier. In order to avoid any strain on the resources of States, it was decided that the minimum balances instead of being increased approximately by four times to ₹ 8.70 crore should roughly be doubled so as to increase the total for all the States to about ₹ 4.00 crore. This was made effective from April 1, 1953. The limits for WMA were also liberalised for the first time with effect from April 1, 1953 and were fixed at twice the minimum balance. An additional limit of ₹ 2.00 crore against the pledge of Central Government securities was also granted to each State as special or secured advances over and above the clean advances. This limit was not rigorously enforced and special advances in excess of ₹ 2 crore were on occasions granted. The minimum balances fixed in 1953 were modified at the time of reorganisation of the States but no major changes were made. 1967 REVISION In the lights of the discussions at the conference of Chief Ministers in July 1966, on the question of preventing unauthorised OD by States in their accounts with the Reserve Bank, the issue of revision of minimum balances and WMA of States came up. It was considered neither necessary nor appropriate to relate the minimum balances of State Governments or the limits to them for WMA to their revenue or revenue and expenditure as was done till 1953 for the following reasons: -
The revenue budgets were inflated because of the accounting changes introduced in two stages in April 1961 and 1962. -
The States were assured of a stable and certain income throughout the year in view of the arrangements for payment to them of their share of tax collections, statutory grants in convenient installments and grant of advances against Plan schemes in installments beginning from April of every year. -
With the formation of autonomous corporations for generation and distribution of electricity and road transport, the States were relieved of their responsibility for meeting the revenue deficits or capital expenditure of these undertakings and this was expected to reduce the need for borrowings by States. -
States were borrowing from commercial banks against stocks of food grains and other commodities and also from LIC and the support from these sources were considerable. A new formula for the determination of minimum balances and the limits for WMA was, therefore, devised on the following basis: The total of minimum balances required to be maintained with the RBI by all the States was increased in the ratio in which the total notional predecentralisation minimum balance of the Centre increased during the period 1937 to 1967. As the working balance of the Central Government with the RBI had increased from ₹ 10 crore in 1937 to ₹ 50 crore in 1967, the States’ balances with the RBI as fixed originally in 1937 were also increased to five times the original figure. The total balances of all the States which worked out to ₹ 1.85 crore in 1937 were notionally fixed at ₹ 2.54 crore consequent on reorganisation of the States. The total minimum balances of State Governments based on the above formula were, therefore, increased to ₹ 12.70 crore in 1967 and then the amount was distributed to the States in the proportion of the revenue and expenditure charged to revenue budget of each State to the revenue and expenditure charged to revenue budget of all States together (according to actuals for the year 1964-65). It was not, however, considered realistic to increase the minimum balances of States from about ₹ 4 crore to ₹ 12.70 crore immediately. The minimum balances were therefore immediately raised to ₹ 6.25 crore (half of ₹ 12.70 crore after rounding off to the nearest five lakhs in the case of each State) with effect from March 1, 1967. It was also decided that the limit for clean and unsecured WMA should continue to be related to the level of minimum balance. The limit was revised from twice the minimum balance to three times the minimum balances. As regards the limit for secured WMA against the pledge of GoI securities, it was decided that this should be revised to twice the level of normal WMA. As a result of the above changes, the minimum balances of all States, total limits for clean and secured WMA to all States worked out as under: | (₹ Crore) | | Effective | Minimum Balances | Clean WMA | Secured WMA | | March 1, 1967 | 6.25 | 18.75 | 37.50 | 1972 REVISION The total minimum balances of all States were increased with effect from May 1, 1972 due to fixation of minimum balances in respect of four new States viz., Himachal Pradesh, Manipur, Meghalaya and Tripura. The expenditure of the States had increased considerably since the limits for clean WMA were revised in 1967. As a measure of assistance to the States against any temporary imbalance between receipts and expenditure on account of abnormal or unforeseen factors, the RBI agreed to increase authorised clean WMA to ₹ 78.00 crore from the existing level of ₹ 19.50 crore as per the recommendations of the Working Group constituted to suggest ways for elimination of overdrafts. The limits for clean WMA thus worked out to four times the existing limits, i.e., 12 times the minimum balance. The minimum balances and revised WMA limits were as under. There was no increase in the secured WMA limits. | (₹ Crore) | | Effective | Minimum Balances | Clean WMA | Secured WMA | | May 1, 1972 | 6.50 | 78.00 | 42.66* | | * This represents the aggregate of actual limits some of which were more and some less than six times the minimum balance. | 1976 REVISION The GoI suggested to the Reserve Bank in May 1975 that in the context of enormous increase in the size of States’ budgets, the question of revision of minimum balances of States and consequently, their WMA needed to be considered. A detailed examination was undertaken on the feasibility of undertaking a basic change in the method of determining WMA and minimum balances. It was recognised that any basic change in the formula would inter se alter the limits of State Governments giving rise to avoidable problems. Moreover, it was not deemed desirable to devise a formula linked to expenditure of the State Governments as this would result in automatic increases in the WMA. It was indicated that the limits were quite substantial and adequate in the case of most States and there were problems only in the case of a few States because of fundamental imbalances which could not be met merely by additional assistance in the form of WMA from the RBI. To the extent there was some need for increased limits, it was felt that the existing structure could be retained and increases agreed to within the present formula. The following suggestions were made: -
The minimum balances of ₹ 6.50 crore for all States would be doubled (taking into account the increase in prices since 1966-67). -
The limits for clean advances would be fixed at 10 times the revised minimum balances instead of 12 times hitherto. -
The limits for secured advances could be increased to ten times the revised minimum balances. Accordingly, the revised minimum balances and limits for WMA were as under: | (₹ Crore) | | Effective | Minimum Balances | Clean WMA | Secured WMA | | May 1, 1976 | 13 | 130 | 130 | The rates of interest on WMA which were one per cent below Bank Rate were revised as follows: | (i) | for 90 days | 1 per cent below Bank Rate | | (ii) | for 91 to 180 days | 1 per cent above Bank Rate | | (iii) | beyond 180 days | 2 per cent above Bank Rate | | The rates of interest on overdraft were fixed as under: | | | For the first 7 days | Bank Rate | | | Over 7 days | 3 per cent above Bank Rate | 1978 REVIEW As aggregate receipt and disbursement of States budgeted for 1978-79 were around 26 times their level in 1963, it was felt that limits for RBI’s accommodation should be further revised. The limits for WMA were, therefore, raised from ₹ 130 crore in 1976 to ₹ 260 crore in 1978, i.e., twenty times the minimum balance. The limit for special WMA was, however, kept unchanged at ten times the minimum balance. The changes effected in clean WMA as on October 1, 1978 were as under: | (₹ Crore) | | Effective | Minimum Balances | Clean WMA | Secured WMA | | October 1, 1978 | 13 | 260 | 130 | 1982 REVIEW In June 1982, GoI took steps to clear WMA and overdraft of States outstanding as at the end of June 1982 by grant of medium term loans/WMA. To eliminate the incidence of OD on an enduring basis and having regard to the increased budgetary expenditure of States since October 1978, it was decided to double RBI’s accommodation. Normal and Special WMA were thus raised from ₹ 260 crore and ₹ 130 crore to ₹ 520 crore (forty times the minimum balance) and ₹ 260 crore (twenty times the minimum balance) respectively with effect from July 1, 1982. The minimum balances to be maintained by States with the RBI remained unchanged at ₹ 13 crore. | (₹ Crore) | | Effective | Minimum Balances | Clean WMA | Secured WMA | | July 1, 1982 | 13 | 520 | 260 | 1986 REVIEW The limits for WMA were again reviewed in August 1986 at the instance of the Government. It was found that even though receipts and disbursements of States had increased substantially since 1982 when the revision of limits was last made, there was no strong evidence to show that the seasonal gaps in cash flow had increased proportionately. It was also pointed out by the RBI that the streamlining of the release of funds by the Centre to the States and the staggering of the repayment of loans by the States would also help the latter in avoiding serious cash flow problems in any particular month. It was agreed between Government and the RBI that only seasonal deficits and not structural deficits should be taken care of by WMA from the RBI. Nevertheless, in view of representations from States, it was decided to grant a basic increase of 20 per cent over the existing normal limits. As the cash flow problem faced by States was more severe in the first half of the year than in the second half when the position improves with the receipts of money from market borrowings, an additional 10 per cent rise was granted in the first half of the year. The revised limits with the above increase were as under: | (₹ Crore) | | Effective | Minimum Balances | Clean WMA | Secured WMA | | October 1, 1986 | | April - September | 13 | 676
(52 times) | 260
(20 times) | | October - March | 13 | 624 | 260 | 1988 REVIEW In February 1988, a further review of the WMA limits was undertaken at the instance of the GoI in view of the cash flow difficulties reported to be experienced by States in incurring emergent expenditure on drought relief. In the financial year 1987-88, only four States had got into an OD on several occasions and from the available data it was not possible to indicate whether the OD on each of the occasions was necessitated purely or mainly on account of the expenditure incurred by those States on drought relief. Besides, some of the worst affected States had not got into the problem of OD as often as some others where drought relief expenditure had not been a major problem. It was also necessary to keep in view the fact that all the States had not been uniformly affected by drought and therefore an across-the-board increase in the limits was not necessarily the correct solution. For the same reason, a regular increase in the limits of WMA, to take care of the difficulties faced in one year and that too, particularly barely a year and a half after the last increase was effected, did not appear to be warranted. However, having regard to the time lag between incurring of drought relief expenditure which was not budgeted by State Governments and the release of Central assistance, the RBI agreed for an increase of 40 per cent in normal WMA over the limits in force prior to October 1, 1986. The limits were uniformly made applicable throughout the year instead of separate limits for the two halves of the year. The revised limits with effect from March 1, 1998 were as under: | (₹ Crore) | | Effective | Minimum Balances | Clean WMA | Secured WMA | | March 1,1998 | 13.30 | 744.80
(56 times) | 266.00
(20 times) | 1993 REVISION Several States had represented for revision of the limits upwards. The issue was examined and on analysis of the financial position of State Governments. The important observations of the analysis were: -
Majority of States had availed of WMA up to full extent; -
The number of States running into overdrafts had risen sharply and such occurrences have become more frequent and for larger amounts since 1992; and -
During 1992-93, all States except three emerged in overdrafts; the period of overdraft in some cases was as high as 192 days during the year. The RBI suspended payments in respect of six States (payments in respect of two States had to be suspended on more than one occasion). Although number of States had represented that WMA limits should be related to expenditure, a view was taken that such a link would be inappropriate as States which incur expenditure disproportionate to their receipts would be eligible for higher limits, leading to larger deficits. While the main thrust of the policy should continue to be not to allow States to run large deficits, a pragmatic assessment would warrant that genuine temporary mismatches in finances of States should be adequately met by WMA. It was felt that the linking of WMA limits as multiple of the minimum balance would ensure that relativities among States were not disturbed. Based on the above considerations changes effected from November 1, 1993 were as under: | (₹ Crore) | | Effective | Minimum Balances | Clean WMA | Secured WMA | | November 1, 1993 | 13.30 | 1,117.20
(84 times of min. balance) | 425.60
(32 times of min. balance) | Simultaneously, the time limit for clearance of overdrafts was extended from seven to ten consecutive working days under the Overdraft Regulation Scheme. 1996 REVISION As an agenda for the new Government at the Centre, it was indicated that the system of providing WMA to State Governments should be revamped and the extent of accommodation should be substantially liberalised. A study of the finances of the States based on their budget documents indicated that while there was improvement in some of the major deficit indicators, certain structural weakness persisted in the form of large revenue deficits, rising interest burden, increasing distortions in the pattern of expenditure and minuscule growth in non-tax revenues. It was, however, felt that there was a need to increase WMA to State Government so that genuine temporary mismatches in finances of State Governments could be adequately met by WMA from the RBI. Having regard to legitimate needs of States, it was considered that WMA should be revised to a level where States, which are managing their finances prudently, are freed from the problems of overdrafts. On a realistic estimate, it was decided that doubling of existing limits for WMA would be reasonable. The limits were accordingly revised as under: | (₹ Crore) | | Effective | Minimum Balances | Clean WMA | Secured WMA | | August 1, 1996 | 13.30 | 2,234.40
(168 times of min. balance) | 852.20
(64 times of min. Balance) | VITHAL COMMITTEE The Vithal Committee observed that fixing the WMA limits as multiples of an unchanged minimum balance, as in the past, does not capture the differing needs of the States in line with the different growth in their budgetary transactions. This has resulted in wide inter- State variations in the WMA limits in relation to the size of the Budget and this needs to be corrected. WMA limits should normally be fixed taking into account: (a) the cash flows, (b) the variation in the rate of flow of revenues and expenditure and consequent mismatches, and (c) the capacity of a State to raise resources on its own to cover such mismatches. The Vithal Committee proposed linking the normal WMA limit to the cash flows of the State. In this context, it proposed total (i.e., revenue plus capital) expenditure less revenue deficit, as the surrogate for cash flows. It was perceived that this base, which worked out to revenue receipts plus capital expenditure, obviated the incentive for increasing imprudent expenditure as a means to obtain a higher WMA limit. The actual WMA limits for non-Special Category States and Special Category States were obtained by applying a ratio of 2.25 per cent and 2.75 per cent, respectively, to the base which was the average of revenue receipts (including lottery receipts on a net basis) and capital expenditure of the States during the previous three years (1994-95 to 1996-97). The revised WMA limits of Non-Special Category States were obtained as follows. For each State, the ratio of its existing WMA limit to its base was obtained. The maximum ratio (2.25 per cent) was obtained in the case of Goa. This ratio (2.25 per cent) was then applied to the base of each of the States to obtain the revised WMA limits. The aggregate of the revised WMA limits thus obtained was around 62 per cent higher than the sum of the existing limits. It was also found that the increase in the WMA limits was less than 40 per cent in the case of four States, viz., Goa, Orissa, Punjab and West Bengal. Given the problems of adjustment in the short run, it was considered desirable that the increase in WMA limits should be at least 40 per cent over the existing limits for any State Government. The revised WMA limits of these four States were accordingly obtained as 40 per cent higher than their respective existing WMA limits. The aggregate of the final revised limits of the Non-Special Category States thus worked out to around 65 per cent higher than the sum of their existing limits. The revised WMA limits of Special Category States were obtained as follows. The aggregate of the existing WMA limits of these States were increased by 62 per cent (i.e. the same order of the initial increase in the case of the Non-Special Category States). The resultant amount was expressed as a percentage of the sum of the bases of all the Special Category States. This multiplying ratio, which worked out to 2.75 per cent, was then applied to the base of each of the Special Category States, to obtain the revised WMA limits. It was found that the order of increase over the existing WMA limit was less than 50 per cent in the case of two States viz., Meghalaya and Mizoram. Taking into account the peculiar problems of Special Category States, it was recommended that, as a transitional provision, the revised WMA limit for each of these States should be at least 50 per cent higher than their respective existing limits. Accordingly, the revised WMA limits of these two States were obtained as 50 per cent higher than their respective existing WMA limits. The aggregate of the final revised WMA limits of all Special Category States thus worked out to around 65 per cent of their existing limits. Thus, the aggregate normal WMA limit for all the (23) States was increased by 65 per cent to ₹ 3,685 crore with effect from March 1, 1999. Following the formation of the new States, revised limits were fixed in November 2000 for the six reorganised States, viz., Bihar, Jharkhand, Madhya Pradesh, Chhattisgarh, Uttar Pradesh and Uttarakhand. The aggregate revised WMA limits of all 26 States thus worked out to ₹ 3,941 crore, which was 76.4 per cent higher than the limits prevailing immediately prior to the Vithal Committee. GROUP OF STATE FINANCE SECRETARIES Despite the steep increase in limits as allocated by the Vithal Committee, there were requests from several State Governments for further liberalisation of these limits. The issue was discussed in the meeting of the State Finance Secretaries held on November 3-4, 2000 and an Informal Group of State Finance Secretaries (GSFS) was constituted which submitted its Report in January 2001. On the basis of the recommendations of the GSFS, the ratio was revised to 2.40 per cent for the Non-Special Category States and 2.90 per cent for the Special Category States, i.e., a uniform increase of 0.15 per cent for both the categories of States. For the reorganised States, interim limits were fixed on their bifurcation in November 2000. Accordingly, the total revised normal WMA limits worked out to ₹ 5,283 crore (based on revenue receipts and capital expenditure of 1997-98 to 1999-2000) as against the then existing limits of ₹ 3,941 crore, an increase of 34 per cent with effect from February 1, 2001. As recommended by GSFS, the limits were revised again in April 2002 to ₹ 6,035 crore based on the average of revenue receipts and capital expenditure during the latest three years (1998-99 to 2000-01). RAMACHANDRAN COMMITTEE The Ramachandran Committee (2003) modified the formula for computing WMA limits by linking it exclusively to revenue receipts. The choice of revenue receipts was based on the following factors: (a) It determines the repaying capacity of the States, (b) It is relatively transparent, (c) It is simpler to calculate, and (d) Inclusion of capital expenditure tends to cause distortions because: -
there are inter-State differences in computing capital expenditure; -
not all capital expenditure that is incurred by the States need be from the Consolidated Fund of the State; -
deficit on the capital account is camouflaged by carrying forward the unpaid bills on an incremental basis annually; and -
there is likely to be far less mismatch between receipts and expenditure on capital account than in the case of revenue account. The exclusion of capital expenditure from the base was compensated by applying a higher multiplicative factor (ratio) in order to obtain the normal WMA limits. Thus, ratios for Non-Special and Special Category States were fixed at 3.19 per cent and 3.84 per cent, respectively, as compared with the earlier ratios of 2.40 per cent and 2.90 per cent. Applying these ratios to the average revenue receipts for the period 1994-95 to 1996-97, the aggregate WMA limit worked out to ₹ 7,170 crore, an increase of 18.8 per cent. The Committee observed that a limit of this order should provide more than abundant cushion to cover the monthly liquidity problems that could arise even from any unexpected shortfall in devolution and transfer which, many States argued, were the main cause of their fiscal difficulties. The Committee also recommended that henceforth the ratios were to be applied to the average of the latest three years revenue receipts (two year’s actuals and one year’s pre-actuals as approved by the C&AG), to revise the limits annually with effect from April 1 every year. Based on the recommendations of the Ramachandran Committee, the aggregate WMA limits effective April 1, 2005 were placed at ₹ 8,935 crore. BEZBARUAH COMMITTEE The Bezbaruah Committee notes that since March 1999, WMA limits were increased every year (except in 2000- 01) and the annual average increase in WMA limits since then had exceeded the average annual rate of growth of expenditure of the State Governments. The Committee opined that, with fiscal correction well underway at the State level and with the prospective improvement in the financial position of the States as envisaged by the 12th FC, the need to further increase the WMA limits, year after year, in line with the growth of average revenue receipts may not be as compelling over the ensuing medium term. Further, it should be expected that with the States enacting FRL and adhering to the 12th FC’s fiscal restructuring plan of eliminating the revenue deficit over the medium term, the size of liquidity mismatches, and consequently, the need to avail of WMA, is likely to decline over the medium term. In such a scenario, temporary liquidity mismatches would reflect genuine seasonal factors with a few occasional disturbances. Notwithstanding the prospective improvement in the fiscal environment over the medium term, the Committee recognised that 2006-07 would continue to be a period of transition for the State Governments mainly in the context of the shift from Central Plan loans to market borrowings. However, most of the States have expressed that the transition to market borrowings in lieu of Central loans is likely to be associated with uncertainties relating to the financing of their Plan expenditures which could, in turn, manifest in liquidity mismatches during the year, even though overall devolution and transfers from the Centre would be higher. The Committee perceives that State Governments would, accordingly, require some more time to adjust to the fiscal milieu envisaged by the 12th FC. Notwithstanding the advantages of using revenue receipts exclusively as the base for computing WMA limits, as highlighted by the Ramachandran Committee, Bezbaruah Committee felt that there is merit in formulating a base that would more truly reflect the total volume of budgetary transactions. Accordingly, the Committee recommends that the base may be defined as total (revenue plus capital) expenditure excluding repayments and adjusted for one-time ad hoc expenditures. Lottery expenditures should also be excluded from the base since these are quite large in respect of some of the States and thus tend to inflate the base even if these are nearly equal to lottery receipts. In the case of a State Government which has a revenue surplus, the base may be defined as above, while in the case of a State having a revenue deficit, the base should exclude the revenue deficit. As part of one-time expenditures, actual amounts mobilised via power bonds during 2003-04 may be excluded from the base. The Committee further recommended that, the multiplying ratios may be taken as 3.1 per cent for Non-Special Category States and 4.1 per cent for Special Category States, and applied to their respective base. The base should be taken as the average of the latest three years for which actual data are available. Accordingly, the Committee proposed a WMA limit of ₹ 9875 crore for 26 States and the revision was implemented from April 2006. Consequent on the agreement entered by Government of Union Territory of Puducherry with the Reserve Bank on December 3, 2007 under Section 21 A of the RBI Act 1934, the minimum balance and the WMA limit were fixed. As Section 21 A enable the Reserve Bank to transact Government business of any States, the agreement with UT of Puducherry is pursuant to the Government of Union Territories (Amendment) Act, 2001, which provides for the creation of a separate Public Account of a Union Territory and enables borrowing upon the security of the Consolidated Fund of the Union Territory, subject to agreed conditions. Accordingly, the WMA limit for 26 States and the UT of Puducherry increased to ₹ 9,925 crore in 2007-08. Government of Jammu & Kashmir entered into a principal agreement with the Reserve Bank on September 1, 1972. On mutual agreement, the principal agreement was amended with a supplementary agreement on January 21, 2011 and accordingly, the Reserve Bank agreed to conduct the general banking business of the Government of Jammu & Kashmir with effect from April 1, 2011. Consequently, the minimum balance and the WMA were fixed for Government of Jammu & Kashmir. Accordingly, the minimum balance and the WMA limits of 27 States and the UT of Puducherry increased to ₹ 42.33 crore and ₹ 10,240 crore, respectively. Since the major revision in WMA limits effected from April 1, 2006 based on the recommendations of the Bezbaruah Committee, annual reviews were undertaken every year. However, the limits were kept unchanged as utilisation was low and generally availed by the same 8 to 10 States on a regular basis. In view of requests from some of the States to revise the WMA limits as also requests made in the SFS conference held in May 2013, it was decided to increase the WMA limits for the State Governments by 50 per cent of then existing limit of ₹ 10,240 crore to ₹ 15,360 crore with effect from November 11, 2013 (Table 16). Thereafter, this Advisory Committee was constituted to review the WMA scheme. | Table 16: Minimum Balance and Limit of WMA for State Governments | | (₹ crore) | | Sl. No. | Date of Revision | Minimum Balance
(Total for all States) | WMA Limits (In multiples of Minimum Balance) | | Normal WMA | SDF (Special WMA) | | 1 | 2 | 3 | 4 | 5 | | 1 | April 1, 1937 (effective April 1, 1938)
(Provincial Government/Part A States) | 1.95 | 1
(1.95) | * | | 2 | April 1, 1953 (Part A and Part B States) | a) 3.94 on Friday
b) 3.38 on day other than Friday
c) 4.50 before repayment of WMA | 2
(7.88) | 2.00 for each State | | 3 | March 1, 1967 | 6.25 | 3
(18.75) | 6
(37.50) | | 4 | May 1, 1972 | 6.50 + | 12
(78.0) | 6
(42.66) | | 5 | May 1, 1976 | 13.0 | 10
(130.0) | 10
(130.0) | | 6 | October 1, 1978 | 13.0 | 20
(260.0) | 10
(130.0) | | 7 | July 1, 1982 | 13.0 | 40
(520.0) | 20
(260.0) | | 8 | October 1, 1986 | | | | | | a) April-September | 13.0 | 52
(676.0) | 20
(260.0) | | | b) October-March | 13.0 | 48
(624.0) | 20
(260.0) | | 9 | March 1, 1988 | 13.30 ## | 56
(744.80) | 20
(266.0) | | 10 | November 1, 1993 | 13.30 | 84
(1,117.20) | 32
(425.60) | | 11 | August 1, 1996 | 13.30 | 168
(2,234.40) | 64
(852.20) | | 12 | March 1, 1999 | 41.04 ** | 3,941.00 # | ++ | | 13 | February 1, 2001 | 41.04 | 5,283.00 | ++ | | 14 | April 1, 2002 | 41.04 | 6,035.00 | ++ | | 15 | April 1, 2003 | 41.04 | 7,170.00 | ++ | | 16 | April 1, 2005 | 41.04 | 8,935.00 | ++ | | 17 | April 1, 2006 | 41.04 | 9,875.00 | ++ | | 18 | December 17, 2007 | 41.19 *** | 9,925.00 | ++ | | 19 | April 1, 2011 | 42.33 **** | 10,240.00 | ++ | | 20 | November 11, 2013 | 42.33 | 15,360.00 | ++ | * Secured Ways and Means Advances were occasionally granted on an ad-hoc basis.
+ The increase of ₹ 0.25 crore over the figure for 1967 was due to the fixation of minimum balance for four States viz. Himachal Pradesh, Manipur, Meghalaya and Tripura. There was no revision for other States.
** The minimum balance revised upwards linking it to the same base as for WMA.
++ The limits for special WMA liberalised, no upper limit on Special WMA, which is being provided against the actual holdings of Central Government Securities subject to margin.
# The aggregate amount applicable in March 1999 was ₹ 3,685 crore on the basis of the recommendation of IAC. On bifurcation of Bihar, Madhya Pradesh and Uttar Pradesh, interim limits were granted to the six recognized States effective November 2000.
## Joining of Goa raised the minimum balance by ₹ 0.30 crore.
*** Joining of UT of Puducherry raised the minimum balance by ₹ 0.15 crore.
**** Joining of Jammu & Kashmir raised the minimum balance by ₹ 1.14 crore.
Note: Figures in brackets in columns 4 and 5 are the total monetary limits for all the States. |
| ANNEX 3: INTEREST RATES ON WMA, SDF AND OD - HISTORICAL TREND | | S.N. | Period | Normal WMA | SDF (Special WMA) | OD | | 1 | 2 | 3 | 4 | 5 | | 1 | Prior to March 1967 | 1% below Bank Rate | i) Up to ₹ 50 lakh - 0.25% below Bank Rate | Bank Rate | | ii) ₹ 51 lakh to ₹ 125 lakh - ½ % below Bank Rate on the entire amount | | iii) Over ₹ 125 lakh - Bank Rate on the entire amount | | 2 | March 1967 to April 1976 | 1% below Bank Rate | 1% below Bank Rate | Bank Rate | | 3 | May 1976 to August 1996 | i) First 90 days - 1% below Bank Rate | i) First 90 days - 1% below Bank Rate | i) For 7 days - Bank Rate | | ii) 91-180 days - 1% above bank Rate | ii) 91-180 days - 1% above bank Rate | ii) From 8th day onwards - 3% above Bank Rate | | iii) Beyond 180 days - 2% above Bank Rate | iii) Beyond 180 days - 2% above Bank Rate | | | 4 | August 1996 to January 15, 1998 | Bank Rate | Bank Rate | Bank Rate plus3% | | 5 | Jan 16, 1998 to March 18, 1998 | 2% below Bank Rate | 2% below Bank Rate | Bank Rate | | 6 | March 19, 1998 to April 2, 1998 | 1.5% below Bank Rate | 1.5% below Bank Rate | 0.5% above Bank Rate | | 7 | April 3 to April 28, 1998 | 1% below Bank Rate | 1% below Bank Rate | 1% above Bank Rate | | 8 | April 29, 1998 to November 1998 | Bank Rate | Bank Rate | 2% above Bank Rate | | 9 | Vithal Committee-November 1998 | Bank Rate | Bank Rate | Bank Rate plus 2% | | 10 | Group of State Finance Secretaries - January 2001 | Bank Rate | Bank Rate | Bank Rate plus 2% | | 11 | Ramachandran Committee - January 2003 | Bank Rate for the period of 1-90 days and 1% above Bank Rate for the period beyond 90 days. | 1% below Bank Rate. | OD up to 100% of NWMA at 3% above the Bank Rate and for OD exceeding 100% of NWMA at 6% above the Bank Rate. | | 12 | Bezbaruah Committee - October 2005 | Repo Rate for the period of 1-90 days and 1% above Repo Rate for the period beyond 90 days. | 1% below Repo Rate. | OD up to 100% of NWMA at 2% above Repo Rate and for OD exceeding 100% of NWMA at 5% above the Repo Rate. |
| ANNEX 4.1: MONTHLY AVERAGE UTILISATION OF SDF, WMA AND OD BY STATE GOVERNMENTS | | (₹ Crore) | | Month | SDF | WMA | OD | Total | | MAR-2013 | 237.88 | 296.05 | 161.10 | 695.02 | | APR-2013 | 66.01 | 301.41 | 210.06 | 577.47 | | MAY-2013 | 69.43 | 149.87 | 28.50 | 247.80 | | JUN-2013 | 554.27 | 520.35 | 192.51 | 1267.13 | | JUL-2013 | 182.73 | 269.75 | 74.70 | 527.19 | | AUG-2013 | 373.78 | 251.77 | 263.40 | 888.95 | | SEP-2013 | 317.80 | 191.94 | 53.74 | 563.48 | | OCT-2013 | 818.64 | 378.43 | 10.50 | 1207.56 | | NOV-2013 | 56.68 | 1.87 | 0.00 | 58.55 | | DEC-2013 | 167.14 | 347.63 | 0.00 | 514.77 | | JAN-2014 | 657.14 | 492.92 | 84.82 | 1234.88 | | FEB-2014 | 58.95 | 390.93 | 31.64 | 481.52 | | MAR-2014 | 27.20 | 417.11 | 327.82 | 772.12 | | APR-2014 | 857.57 | 780.57 | 407.14 | 2045.28 | | MAY-2014 | 152.92 | 568.83 | 78.51 | 800.26 | | JUN-2014 | 234.53 | 661.33 | 91.46 | 987.31 | | JUL-2014 | 5.92 | 539.37 | 35.02 | 580.31 | | AUG-2014 | 58.85 | 621.81 | 116.41 | 797.06 | | SEP-2014 | 260.50 | 639.33 | 187.85 | 1087.68 | | OCT-2014 | 311.24 | 673.83 | 369.15 | 1354.23 | | NOV-2014 | 971.51 | 712.93 | 138.00 | 1822.44 | | DEC-2014 | 1276.85 | 743.59 | 65.27 | 2085.72 | | JAN-2015 | 491.71 | 989.19 | 346.39 | 1827.29 | | FEB-2015 | 835.14 | 665.29 | 26.33 | 1526.75 | | MAR-2015 | 444.25 | 1239.15 | 973.50 | 2656.90 | | APR-2015 | 381.55 | 748.15 | 505.54 | 1635.25 | | MAY-2015 | 552.03 | 262.21 | 60.51 | 874.75 | | JUN-2015 | 969.29 | 457.07 | 0.38 | 1426.73 | | JUL-2015 | 1911.05 | 437.79 | 3.21 | 2352.05 | | AUG-2015 | 1484.56 | 594.41 | 122.27 | 2201.23 | | SEP-2015 | 1878.28 | 844.52 | 106.26 | 2829.06 | | OCT-2015 | 1912.02 | 1092.63 | 516.55 | 3521.20 | | Source: RBI Internal Records. |
| ANNEX 4.2: INVESTMENT IN ITBs AND ATBs BY STATES (As at End-March) | | (₹ Crore) | | Sl. No. | STATE | 2011-12 | 2012-13 | 2013-14 | 2014-15 | | ITBs | ATBs | ITBs | ATBs | ITBs | ATBs | ITBs | ATBs | | 1 | Andhra Pradesh | 3497 | - | 4576 | - | 7062 | - | - | - | | 2 | Arunachal Pradesh | 49 | - | 195 | - | - | - | - | - | | 3 | Assam | 6021 | - | 6266 | - | 677 | 3000 | 2005 | - | | 4 | Bihar | 398 | - | 2049 | - | 3630 | 400 | 3523 | 400 | | 5 | Chhattisgarh | 1508 | 216 | 2624 | 58 | 1587 | - | - | - | | 6 | Goa | 557 | - | 194 | - | 194 | - | 252 | - | | 7 | Gujarat | 12235 | - | 8934 | 3500 | 10934 | - | 11414 | - | | 8 | Haryana | 285 | - | 11 | - | 3691 | - | 2488 | - | | 9 | Himachal Pradesh | 949 | - | 266 | - | - | - | - | - | | 10 | Jammu & Kashmir | 713 | - | 150 | - | 175 | - | - | - | | 11 | Jharkhand | - | - | 742 | - | 847 | - | 666 | - | | 12 | Karnataka | 7667 | - | 6886 | - | 10994 | - | 17997 | - | | 13 | Kerala | 2711 | - | 3201 | - | 759 | - | 142 | - | | 14 | Madhya Pradesh | 6698 | - | 6819 | - | 3906 | - | 4800 | - | | 15 | Maharashtra | 19060 | 8000 | 37660 | - | 4778 | 27500 | 14458 | 19000 | | 16 | Manipur | - | - | - | - | 315 | - | 126 | - | | 17 | Meghalaya | 300 | - | - | - | 1323 | - | 880 | - | | 18 | Mizoram | - | - | - | - | 26 | - | 105 | - | | 19 | Nagaland | - | - | - | - | - | - | 141 | - | | 20 | Odisha | 3912 | 3000 | 4362 | 3000 | 3882 | - | 3821 | - | | 21 | Puducherry | 862 | - | 938 | - | 1063 | 130 | 488 | 509 | | 22 | Punjab | - | - | - | - | - | - | 248 | - | | 23 | Rajasthan | 708 | 8803 | 5128 | 7603 | 2197 | 8112 | 2128 | 6701 | | 24 | Tamil Nadu | 10716 | 1990 | 14886 | 4415 | 14084 | 7143 | 11996 | 10416 | | 25 | Telangana | - | - | - | - | - | - | 1874 | - | | 26 | Tripura | 1104 | - | 2306 | - | 3546 | - | 1287 | 2400 | | 27 | Uttar Pradesh | 13508 | - | 4817 | 10000 | 4590 | - | - | - | | 28 | Uttarakhand | 50 | - | 559 | - | 802 | - | 594 | - | | 29 | West Bengal | 3084 | - | 4493 | - | 5128 | - | 2751 | - | | | Total | 96594 | 22009 | 118060 | 28576 | 86191 | 46285 | 84185 | 39426 | | Source: RBI Internal Records |
| ANNEX 4.3: AVERAGE INVESTMENT IN INTERMEDIATE TREASURY BILLS | | (₹ Crore) | | Sl. No. | STATES | 2010-11 | 2011-12 | 2012-13 | 2013-14 | 2014-15 | | 1 | Andhra Pradesh | 2,609 | 3,474 | 3,891 | 4,562 | 5,356 | | 2 | Arunachal Pradesh | 1,098 | 978 | 740 | 406 | 250 | | 3 | Assam | 7,959 | 7,117 | 4,728 | 4,647 | 4,610 | | 4 | Bihar | 4,449 | 4,492 | 2,737 | 4,103 | 5,796 | | 5 | Chhattisgarh | 1,673 | 2,809 | 1,959 | 1,536 | 1,248 | | 6 | Goa | 260 | 333 | 190 | 115 | 56 | | 7 | Gujarat | 5,927 | 7,089 | 10,690 | 6,557 | 6,096 | | 8 | Haryana | 1,165 | 791 | 809 | 1,454 | 1,626 | | 9 | Himachal Pradesh | 929 | 955 | 700 | 316 | 60 | | 10 | Jammu & Kashmir | - | 230 | 232 | 210 | 241 | | 11 | Jharkhand | 1,668 | 749 | 569 | 969 | 2,443 | | 12 | Karnataka | 7,949 | 4,078 | 4,032 | 4,397 | 5,969 | | 13 | Kerala | 2,100 | 1,697 | 2,445 | 1,495 | 905 | | 14 | Madhya Pradesh | 5,324 | 7,041 | 6,167 | 4,685 | 2,978 | | 15 | Maharashtra | 12,418 | 10,581 | 11,925 | 11,097 | 5,700 | | 16 | Manipur | 672 | 350 | 297 | 386 | 540 | | 17 | Meghalaya | 376 | 380 | 505 | 504 | 588 | | 18 | Mizoram | 117 | 161 | 167 | 131 | 118 | | 19 | Nagaland | 265 | 119 | 75 | 99 | 81 | | 20 | Odisha | 4,479 | 3,194 | 2,873 | 3,056 | 2,293 | | 21 | Punjab | 307 | 187 | 95 | 108 | 37 | | 22 | Rajasthan | 2,135 | 1,607 | 2,339 | 2,398 | 2,885 | | 23 | Tamil Nadu | 8,577 | 5,859 | 8,849 | 9,067 | 7,945 | | 24 | Telangana | - | - | - | - | 3,330 | | 25 | Tripura | 430 | 822 | 1,315 | 1,683 | 933 | | 26 | Uttar Pradesh | 4,722 | 5,959 | 14,421 | 6,723 | 8,762 | | 27 | Uttarakhand | 284 | 213 | 671 | 716 | 1,206 | | 28 | West Bengal | 408 | 420 | 857 | 719 | 682 | | 29 | Puducherry | 622 | 477 | 582 | 503 | 371 | | | Total | 78,922 | 72,162 | 84,860 | 72,644 | 73,103 | | Source: RBI Records. |
| ANNEX 4.4: AVERAGE INVESTMENT IN AUCTION TREASURY BILLS | | (₹ Crore) | | Sl. No. | STATES | 2010-11 | 2011-12 | 2012-13 | 2013-14 | 2014-15 | | 1 | Arunachal Pradesh | - | 49 | - | - | - | | 2 | Assam | 72 | 1,226 | 3,066 | 2,189 | 305 | | 3 | Bihar | - | - | - | 204 | 385 | | 4 | Chhattisgarh | 296 | 413 | 343 | 144 | - | | 5 | Gujarat | 363 | 1,311 | 2,774 | 2,384 | 3,975 | | 6 | Karnataka | - | 1,975 | 3,881 | 2,742 | 5,536 | | 7 | Maharashtra | 2,038 | 7,491 | 12,349 | 22,977 | 26,160 | | 8 | Odisha | 1,337 | 4,121 | 5,047 | 5,231 | 2,242 | | 9 | Rajasthan | 532 | 5,988 | 10,566 | 10,700 | 8,545 | | 10 | Tamil Nadu | 4,973 | 5,010 | 3,993 | 4,517 | 7,766 | | 11 | Tripura | - | 74 | - | 972 | 2,491 | | 12 | Uttar Pradesh | - | - | 1,792 | 7,355 | - | | 13 | Puducherry | - | - | - | 331 | 517 | | | Total | 9,611 | 27,657 | 43,812 | 59,746 | 57,922 | | Source : RBI Records. |
| ANNEX 5: EXPENDITURE BASE FOR CALCULATION OF WMA LIMIT | | (₹ Crore) | | Sl. No. | States/UTs | Revenue Expenediture (RE) | Lottery Expenditure | Capital Expenditure ** | Recommended base TE
= (RE+CE-Lottery) | Average base | Multi- plying Ratio | | 2011-12 | 2012-13 | 2013-14 | 2011-12 | 2012-13 | 2013-14 | 2011-12 | 2012-13 | 2013-14 | 2011-12 | 2012-13 | 2013-14 | | 1 | 2 | 3 | 4 | 5 | 6 | 7 | 8 | 9 | 10 | 11 | 12 | 13 | 14 | 15 | 16 | | I | Non-HS & NES | | | | | | | | | | | | | | | | 1 | Andhra Pradesh | 90,415 | 102,702 | 110,374 | - | - | - | 25,466 | 26,739 | 26,255 | 115,882 | 129,441 | 136,629 | 127,317 | | 2 | Bihar | 46,499 | 54,466 | 62,477 | - | - | - | 13,681 | 14,740 | 17,928 | 60,180 | 69,207 | 80,405 | 69,931 | | 3 | Chhattisgarh | 22,628 | 26,972 | 32,860 | - | - | - | 6,093 | 7,847 | 6,582 | 28,721 | 34,819 | 39,442 | 34,327 | | 4 | Goa | 5,482 | 6,061 | 6,803 | - | - | - | 1,471 | 1,285 | 1,346 | 6,953 | 7,346 | 8,149 | 7,483 | | 5 | Gujarat | 59,744 | 69,658 | 75,259 | - | - | - | 19,670 | 28,623 | 29,462 | 79,414 | 98,281 | 104,721 | 94,139 | | 6 | Haryana | 32,015 | 38,072 | 41,887 | - | - | - | 7,737 | 8,440 | 7,042 | 39,751 | 46,512 | 48,929 | 45,064 | | 7 | Jharkhand | 20,992 | 23,398 | 23,431 | - | - | - | 5,015 | 7,002 | 6,632 | 26,007 | 30,400 | 30,064 | 28,824 | | 8 | Karnataka | 65,115 | 76,293 | 89,190 | - | - | - | 20,641 | 20,308 | 21,459 | 85,756 | 96,601 | 110,649 | 97,669 | | 9 | Kerala | 46,045 | 53,489 | 60,485 | 902 | 2,083 | 3,203 | 7,745 | 8,544 | 8,884 | 52,887 | 59,950 | 66,167 | 59,668 | | 10 | Madhya Pradesh | 52,694 | 62,969 | 69,870 | - | - | - | 27,965 | 20,529 | 19,894 | 80,659 | 83,497 | 89,764 | 84,640 | | 11 | Maharashtra | 123,554 | 138,736 | 154,902 | 67 | - | 72 | 25,174 | 25,466 | 31,927 | 148,662 | 164,202 | 186,758 | 166,541 | | 12 | Odisha | 34,660 | 38,238 | 45,618 | - | - | - | 7,445 | 9,018 | 10,513 | 42,105 | 47,256 | 56,131 | 48,497 | | 13 | Punjab | 33,045 | 39,458 | 41,641 | 45 | 83 | 45 | 3,765 | 5,049 | 6,016 | 36,765 | 44,425 | 47,612 | 42,934 | | 14 | Rajasthan | 53,653 | 63,462 | 75,510 | - | - | - | 11,719 | 17,802 | 18,591 | 65,372 | 81,264 | 94,101 | 80,246 | | 15 | Tamil Nadu | 83,838 | 97,067 | 109,825 | - | - | - | 25,627 | 24,328 | 24,368 | 109,465 | 121,396 | 134,192 | 121,685 | | 16 | Telangana | - | - | 79,810 | - | - | - | - | - | 20,148 | - | - | - | - | | 17 | Uttar Pradesh | 123,885 | 140,724 | 158,147 | - | - | - | 29,827 | 32,997 | 42,573 | 153,712 | 173,720 | 200,720 | 176,051 | | 18 | West Bengal | 73,326 | 82,111 | 91,797 | 35 | 45 | 44 | 10,505 | 13,247 | 16,716 | 83,796 | 95,313 | 108,470 | 95,859 | | | Sub-Total (I) | 967,592 | 1,113,876 | 1,329,885 | 1,049 | 2,211 | 3,364 | 249,545 | 271,964 | 316,338 | 1,216,088 | 1,383,629 | 1,542,902 | 1,380,873 | 2.03% | | II | Himalayan & NE States | | | | | | | | | | | | | | | | 19 | Arunachal Pradesh | 4,418 | 4,786 | 5,731 | - | - | - | 2,247 | 1,567 | 2,050 | 6,665 | 6,354 | 7,782 | 6,933 | | 20 | Assam | 26,529 | 29,137 | 31,972 | - | - | - | 3,740 | 4,611 | 5,207 | 30,269 | 33,748 | 37,178 | 33,732 | | 21 | Himachal Pradesh | 13,898 | 16,174 | 17,352 | - | - | - | 3,431 | 4,540 | 3,919 | 17,329 | 20,715 | 21,271 | 19,771 | | 22 | Jammu and Kashmir | 22,680 | 25,117 | 27,058 | 1 | - | - | 7,176 | 6,661 | 5,925 | 29,855 | 31,778 | 32,983 | 31,539 | | 23 | Manipur | 5,005 | 5,317 | 5,719 | 2 | 1 | 1 | 1,857 | 1,677 | 1,454 | 6,861 | 6,993 | 7,172 | 7,008 | | 24 | Meghalaya | 4,835 | 5,000 | 5,552 | 1 | 1 | 1 | 1,110 | 1,124 | 1,259 | 5,944 | 6,123 | 6,810 | 6,292 | | 25 | Mizoram | 3,724 | 4,509 | 6,145 | 1 | 2 | 2 | 762 | 827 | 1,132 | 4,485 | 5,334 | 7,275 | 5,698 | | 26 | Nagaland | 4,876 | 5,601 | 5,750 | 2 | 2 | - | 1,573 | 1,593 | 1,477 | 6,447 | 7,192 | 7,227 | 6,955 | | 27 | Tripura | 4,809 | 5,213 | 5,949 | - | - | - | 1,629 | 1,815 | 1,876 | 6,438 | 7,027 | 7,825 | 7,097 | | 28 | Uttarakhand | 12,975 | 13,960 | 16,216 | - | - | - | 3,257 | 5,256 | 5,307 | 16,232 | 19,216 | 21,523 | 18,991 | | 29 | Puducherry | 3,222 | 3,051 | 4,483 | - | - | - | 534 | 505 | 568 | 3,756 | 3,556 | 5,050 | 4,121 | | | Sub-Total (II) | 106,971 | 117,865 | 131,927 | 7 | 5 | 4 | 27,316 | 30,175 | 30,174 | 134,280 | 148,035 | 162,098 | 148,138 | 2.78% | | | Total | 1,074,563 | 1,231,741 | 1,461,813 | 1,056 | 2,216 | 3,368 | 276,862 | 302,139 | 346,512 | 1,350,368 | 1,531,664 | 1,704,999 | 1,529,011 | | Note: WMA for Andhra Pradesh and Telangana has been bifurcated in the ratio advised by the AP Reorganisation Act 2014 .
** : Excludes public account items. |
ANNEX 6: OPERATING PROCEDURES AND LIQUIDITY MANAGEMENT FRAMEWORK OF THE RBI As per the prevailing operating framework of monetary policy, the fixed overnight repurchase (repo) rate under the Liquidity Adjustment Facility (LAF) is the single monetary policy rate while the weighted average call money rate (WACR) is the operating target of monetary policy. The Reserve Bank’s operating procedure aims at modulating liquidity conditions so as to anchor the WACR around the policy rate. This is the first leg of monetary policy transmission to the financial system and the economy. The main features of the revised liquidity management framework implemented since September 5, 2014 are as follows: (i) assured access to central bank liquidity of one per cent of banks’ net demand and time liabilities (NDTL) comprising 0.25 per cent of NDTL provided through overnight fixed rate repo auctions conducted daily at the policy rate, and 0.75 per cent of NDTL provided through 14-day variable rate term repo auctions conducted on every Tuesday and Friday; (ii) fine-tuning operations through variable rate repo/ reverse repo auctions of maturities ranging from overnight to 28 days to even out frictional liquidity mismatches that occur in spite of assured liquidity operations; and (iii) outright open market operations to manage enduring liquidity mismatches. Besides, the two standing facilities - Marginal Standing Facility (MSF) and fixed rate daily overnight Reverse Repo auctions allows market participants to access central bank liquidity or place surplus liquidity with the RBI. The MSF rate and the fixed overnight reverse repo rate define an informal corridor for limiting intra-day variations in the call rate.
ANNEX 7: COMBINATION OF WMA FORMULAS ATTEMPTED WMA Limits Based on GSDP The latest GSDP data available for all States pertain to 2013-14. The GSDP of the States were aggregated according to HS&NES and other States to arrive at the multiplying ratio and then the State-wise WMA limit was calculated. As per this formula, some States got lower WMA than their present limit while few other States got much higher WMA limit. Moreover, it is observed that the GSDP figures of some States were not in alignment with their fiscal position. Therefore, fixing the WMA limits based on GSDP was not considered by the Committee. WMA Limits Based on 3 per cent of GSDP The 14th FC has recommended for a GFD of 3 per cent of States’ GSDP from 2015-16 onwards. As the State-wise GSDP was not giving clear picture of the State’s fiscal position, three per cent of their GSDP also did not give any meaningful result for WMA calculation, in particular, some HS&NES got negative growth over their existing limit. Therefore, this formula was not found suitable. WMA Limits Based on Total Expenditure minus Revenue Receipts Normally, WMA is to finance the temporary mismatch in States’ cash flows. Total expenditure minus revenue receipts more or less represents the gap of the States. However, it was observed that some States were managing their expenditure so prudently that their revenue receipts and clearly known borrowings took care of their total expenditure. As a result, the gap was very narrow in such States and did not represent the true fiscal size of the States. Therefore, this methodology was not found appropriate for calculation of WMA formula. WMA calculation based on Revenue Receipts The revenue receipts of the States increased on a CAGR basis between 7.1 per cent and 20.4 per cent during the recent period and the growth was very low in respect of some of the HS&NES while 17 States registered a CAGR of over 15 per cent during the period. Further, revenue receipts may not represent the cash flow mismatches for all States as some States registered revenue deficit in 2014-15 despite the 13th FC’s recommendation for achieving revenue surplus. In addition, revised limits on the basis of revenue receipts showed wide variation in the growth between 46.7 per cent and 166.7 per cent. Therefore, formula based on revenue receipts was not found to be adequate.
ANNEX 8: VIEWS EXPRESSED BY THE STATE GOVERNMENTS In the advisory Committee meetings and SFS conference, States were requested to forward their views/ suggestions for the Committee to deliberate. Accordingly States like Tamil Nadu, Odisha, Meghalaya, Jharkhand, Haryana, etc., have forwarded their views. The summary of the views are consolidated in respective heads as under: WMA Limit The WMA/ OD is no more a means of financing the deficit after enactment of FRBM Act. Due to increase in State’s budget size, on-an-average, daily transaction has increased and any mismatch in receipts, especially from the Centre/ State’s Commercial Taxes, coinciding with bullet payments, the gap will also increase. This will result in the State exhausting their WMA and OD limits quickly. Further, past performances alone should not be taken as the criterion for fixing the WMA limits and the future perspectives should also be given due consideration by the Committee. There is a need to re-assess the WMA limit, which will provide cushion to the States to carry on their essential activities without disrupting the financial transactions in the State Treasuries. As the States do not have the option of mobilizing short-term loans like ATBs/ Cash Management Bills (CMBs), it is essential that the WMA limit shall be in tune with the current budgetary trends. On account of unique problems faced by the North Eastern States such as limited fiscal capacity and comparatively higher expenditure needs due to inhospitable climate, topographical conditions and remote location, the committee may recommend a higher WMA limit for this region to tide over any temporary mismatches. Basis for calculation of WMA Limit and adoption of latest data The same formula used by the Bezbaruah Committee shall be continued for computation of WMA limits. But the data adopted by the previous Committee was relatively old as last three years accounts data were adopted. Instead, while adopting the same formula, data for preceding three years comprising Accounts, Accounts and Revised Estimates may be considered. Fixing Rolling Normal WMA Limit for each year In view of seasonality in flow of revenues and pattern of expenditure, there is need to consider two sets of WMA limits, i.e., one for the first half of the financial year and the second for the second half of the financial year. Since, capital expenditure is supposed to be taken care of through borrowings, a function of total revenue receipt and revenue expenditure may be taken into consideration for revision of WMA. In this connection, it needs to be mentioned that during period of high revenue deficit and fiscal deficit the State experienced frequent cash imbalance and high degree of dependence on WMA/ OD. The annual WMA limit shall be revised on the 1st April every year, based on the data for the preceding three years to cope with the increasing public spending/ budget size. The WMA limit for the State should be computed in a manner similar to Cash Credit because the States have to face unexpected and large expenditure like disaster, natural calamities, pay commission pay outs, pension disputes, etc. OD Scheme Small States like North Eastern States, majority of the source of revenue comes from the Centre and only at the beginning of the month. Therefore, the time limit for OD may be increased from 14 days to 30 days with the rate of interest at Repo rate + 1% for OD within admissible time limit and Repo rate + 2% for OD beyond the admissible limit. Creating additional avenues for Investment of Surplus Cash Balance As the States have not achieved fiscal surplus, the cash balances of the States do not represent the surplus cash but the liabilities under the Public Account. The accretions under the Public Account is kept within the governmental system whereby it can be used by States for sanction of WMA to State owned entities/ time-being utilization by States/ keeping the float with Centre. If allowed, the deposits will go to the market players who will lend the same at higher rates to the Government institutions. Therefore, additional avenues for investment of the Public Account accruals of the States may be created, like Repo to market participants within LAF framework as in the case of Centre, considering the implementation of the recommendations of the Working Group of State Finance Secretaries on Investment of the Surplus Cash Balances of State Governments (2006), keep in fixed deposit with Gol for a suitable longer tenor say 6 months or one year fetching interest at G-Sec rates, etc. Return on 14 day ITBs The return on ITBs is at 5 per cent only and that too realized on full maturity of 14 days. When the Bezbaruah Committee had changed the bench mark interest rate on WMA/ OD from the Bank rate to Repo rate, the return on States’ investment in ITBs should also have been linked ideally to the Repo rate. As per Gol notification dated March 31, 1997, the discount rate had been made equivalent to the interest rate on WMA chargeable to GoI. Subsequently, in terms of RBI communication dated May 8, 2003, the discount rate on ITBs had been fixed with the criterion “Rate of Interest on WMA less 100 basis points” (at that point the rate of interest on WMA was linked to Bank Rate). Therefore, when the bench mark rate of WMA/ OD had been linked to Repo rate w.e.f. April 1, 2006, the return on ITBs should also have been with reference to Repo rate only (i.e., rate of interest on WMA less 100 basis points). But this had not been done. In view of the position explained above, the present Committee should take into consideration the differences in the interest chargeable on WMA and the rate of return on the surplus cash balances for the State Governments. Ideally, either it must be aligned to a single benchmark rate as in the case of interest on WMA or a separate overnight instrument as recommended by the SFS Committee should be introduced or as in the case of Gol, a portion of the States’ surpluses shall also be allowed to be repoed in the market so as to create a level playing field/ fetch decent return on the States’ resources. Better Cash Management Technique State Governments may be imparted better cash management techniques including adoption of exchequer control based Cash Management System adopted by the GoI for the Ministries in order to reverse the trend of back loading of expenditure to the last quarter of the financial year, integration of Cash and Debt Management as well as flow of revenue receipts. Adoption of electronic receipt and payment system will also minimise the float with the banking system at the cost of the State Government. In order to take care of periodic imbalances between receipts and payments arising out of committed liabilities like payment of salaries, pension, interest payment, repayment of loans by fixed dates, the State Government ought to have a surplus cash balance in hand. The Committee may deliberate upon and prescribe an indicative/optimum surplus cash balance to be maintained by the State Government over and above the minimum balance. Centrally Sponsored Scheme – Float with Implementing Agencies The float available with the implementing agencies of the Centrally Sponsored Scheme (CSS) can be minimised by integrating their bank accounts and transactions with the State Treasury systems so that fund flow to these agencies can be ensured ‘just in time’. The Public Financial Management System (PFMS) needs to be rolled out for all the GoI and State Government schemes through an interface provided by the State Treasury Portal so that the fund flow for CSS as well as State Government schemes can be made with minimum float in the transmission system. This will go a long way in improving the cash management system of both the GoI and State Governments. Under the CSS, the GoI transfers large amount to the States for implementation of these schemes. State Governments find it very difficult to obtain the authentic information on availability of Central assistance from a single source in the absence of which proper estimate of the availability of resources for each CSS in shape of grant and also the matching State share is not possible. Moreover, in the absence of any indication about receipt of Central Assistance for CSS from the beginning of the financial year, the States are not in a position to properly plan for spending the Central assistance and required State share. Although the State Government release funds for CSS on receipt of Central Assistance, at times in order to continue the programme delivery, the State Government are required to provide both Central Assistance and matching State share in advance. Accelerated Irrigation Benefit Programme, National Rural Employment Guarantee Act, Integrated Child Development Services (Special Nutrition Component) are the schemes under which such instances are frequent. This largely contributes to periodic cash imbalance in the State Government account. It is suggested that, in order to impart greater predictability in fund flow for CSS, the annual allocation for each State and the sharing pattern need to be provided in a single platform and make it accessible to all States. This would ensure transparency in allocation of funds to States under CSS which was hitherto considered as discretionary and there would be predictability in fund flow for all CSS and at the same time the States would be in a better position to utilize the CSS funds with advance planning for funds to be made available for spending from the beginning of the financial year. For externally aided projects, the States are required to first undertake the expenditure and thereafter claim reimbursement from the donor agencies through the MoF, GoI. There is considerable time lag between actual expenditure and receipt of additional Central Assistance for Externally Aided Projects. This restricts the maneuverability of the States to provide funds in advance for expenditure. SDF Account Head The nomenclature of Special WMA was changed to SDF in order to shed the stigma attached to SWMA which is granted against the State Government’s holdings in GoI dated Security and investment in ATBs. However, receipt from SDF and repayment thereof is still accounted for as WMA under the Minor Head of Account ‘110-WMA from RBI below the Major Head ‘6003-Internal Debt of the State Government’. It is, therefore, suggested that Controller General of Accounts in the MoF, GoI may be moved to provide a separate Minor Head for classification of SDF. Periodical Capacity Building Programme To keep pace with changes, the capacity of officials of the State Finance Department needs to be strengthened vis-a-vis change in transaction systems and other banking systems so as to enable the State Finance Department officials in dealing with banking transactions, contra credit, periodical bank statements, etc. The RBI may plan to conduct periodical capacity building and orientation programmes for the officials of State Finance Departments.
ANNEX 9: OFFICIALS ATTENDED THE ADVISORY COMMITTEE MEETINGS The first meeting of the Advisory Committee was held on December 23, 2014 at RBI, Mumbai. The following officials participated in the meeting: Chairman & Members 1. Shri Sumit Bose, Chairman. 2. Dr. Rathin Roy, Director, NIPFP. 3. Shri Shrikant Deshpande, Secretary (Expenditure), FD, Govt of Maharashtra. 4. Shri T. Udhayachandran, Secretary, FD, Govt of Tamil Nadu. 5. Shri Kekhwezo Kepfo, Senior RO, FD, Govt of Nagaland. Ministry of Finance, GoI 6. Shri S. Mohan, Director, MoF, GoI. Reserve Bank of India 7. Shri P. Vijaya Bhaskar, Executive Director. 8. Smt. Rekha G. Warriar, CGM, IDMD. 9. Smt. R. Kausaliya, Director, IDMD. 10. Shri A. K. Mitra, Director, MPD. 11. Shri L. Lakshmanan, Asst. Adviser, IDMD. The second meeting of the Advisory Committee was held on April 21, 2015 at RBI, Kolkata. In addition to members of the Committee, special invitees from the Finance Department of North-Eastern and Eastern States were also invited for the meeting. Accordingly, the following officials participated in the meeting: Chairman & Members 1. Shri Sumit Bose, Chairman. 2. Dr. Rathin Roy, Director, NIPFP. 3. Smt Vini Mahajan, Principal Finance Secretary, Govt of Punjab. 4. Shri T. Udhayachandran, Secretary (Expenditure), FD, Govt of Tamil Nadu. 5. Shri Temjen Toy, Principal Finance Secretary, Govt of Nagaland. 6. Shri S. Mohan, Adviser (PF-I), MoF, GoI. Invitees from State Governments 7. Shri Ganesh Koyu, Dev. Commissioner & Secretary, Govt of Arunachal Pradesh. 8. Shri Rameshwar Singh, PFS, Govt of Bihar. 9. Shri Puneet Agarwal, Secretary (Finance), Govt of Tripura. 10. Shri R.K. Bujarbaruah, Consultant, Govt of Assam. 11. Shri S.P. Sarmah, Director, Govt of Assam. 12. Shri Anurag Srivastava, Joint Secretary, Govt of West Bengal. Reserve Bank of India 13. Smt. R. Kausaliya, Director, IDMD. 14. Shri L. Lakshmanan, Asst Adviser, IDMD. 15. Shri Brijesh Pazhayathodi, Asst Adviser, DEPR. Discussion with Reserve Bank Officials on August 31, 2015 The Chairman along with Dr. Rathin Roy had discussions with the following officials of the IDMD on August 31, 2015 and lunch-on discussion with Shri H.R. Khan, Deputy Governor and Shri P. Vijaya Bhaskar, Executive Director of the Reserve Bank. 1. Smt. R. Kausaliya, Director, IDMD. 2. Shri Rajendra Kumar, GM, IDMD. 3. Shri L. Lakshmanan, Asst. Adviser, IDMD. 4. Shri A. K. Mitra, Director, MPD. 5. Shri I. Bhattacharya, Director, DEPR. The third meeting of the Advisory Committee held on November 20, 2015 at RBI, New Delhi and the following officials participated in the meeting: Chairman & Members 1. Shri Sumit Bose, Chairman. 2. Dr. Rathin Roy, Director, NIPFP. 3. Shri K. Shanmugam, Pr. Finance Secretary, Govt of Tamil Nadu. 4. Shri D.P. Reddy, Principal Fin Secretary, Govt of Punjab. 5. Shri Temjen Toy, Pr. Sec & Finance Commissioner, Govt of Nagaland. 6. Smt L.N. Tochhawng, Finance Commissioner & Secretary, Govt of Mizoram. 7. Shri N.K. Chaudhary, Pr. Fin Secretary, Govt of Jammu & Kashmir. 8. Shri G.C. Murmu, Addl. Secretary, PF-I, MoF, GoI. Invitees from GoI and States 9. Shri S. Mohan, Adviser (PF-I), MoF, GoI. 10. Shri N. Venkatesh, Dy Secretary, Finance Department, Govt of Tamil Nadu. 11. Shri Manmohan Sachdeva, Director, PF-I, MoF, GoI. Reserve Bank of India 12. Smt. R. Kausaliya, Director, IDMD. 13. Shri L. Lakshmanan, Asst. Adviser, IDMD. 14. Shri A. K. Mitra, Director, MPD.
| Annex Table 1: Trends in Select Interest Rates | | (Per cent) | | Item | 2010-11 | 2011-12 | 2012-13 | 2013-14 | 2014-15 | 2015-16 | | Q1 | Q2 | Q3 | Q4 | Q1 | Q2 | Q3 | Q4 | Q1 | Q2 | Q3 | Q4 | Q1 | Q2 | Q3 | Q4 | Q1 | Q2 | Q3 | Q4 | Q1 | Q2 | Repo Rate
(end of the Quarter) | 5.25 | 6.00 | 6.25 | 6.75 | 7.50 | 8.25 | 8.50 | 8.50 | 8.00 | 8.00 | 8.00 | 7.50 | 7.25 | 7.50 | 7.75 | 8.00 | 8.00 | 8.00 | 8.00 | 7.50 | 7.25 | 6.75 | Bank Rate
(end of the Quarter) | 6.00 | 6.00 | 6.00 | 6.00 | 6.00 | 6.00 | 6.00 | 9.50 | 9.00 | 9.00 | 9.00 | 8.50 | 8.25 | 9.50 | 8.75 | 9.00 | 9.00 | 9.00 | 9.00 | 8.50 | 8.25 | 7.75 | Treasury Bills
(Weighted Average) | | | | | | | | | | | | | | | | | | | | | | | | 91- Days | 4.41 | 6.00 | 6.85 | 7.19 | 7.98 | 8.34 | 8.63 | 8.87 | 8.41 | 8.20 | 8.15 | 8.04 | 7.49 | 10.33 | 8.82 | 8.99 | 8.73 | 8.60 | 8.36 | 8.30 | 7.82 | 7.45 | | 182- Days | 4.82 | 6.22 | 7.04 | 7.47 | 7.98 | 8.37 | 8.68 | 8.62 | 8.38 | 8.20 | 8.13 | 8.00 | 7.49 | 10.18 | 8.83 | 8.98 | 8.79 | 8.68 | 8.44 | 8.23 | 7.86 | 7.53 | | 364- Days | 5.08 | 6.24 | 7.14 | 7.63 | 8.13 | 8.33 | 8.55 | 8.42 | 8.19 | 8.06 | 8.05 | 7.86 | 7.46 | 9.53 | 8.83 | 8.92 | 8.84 | 8.69 | 8.40 | 8.01 | 7.82 | 7.56 | Weighted Average GoI dated Securities
(Primary Auctions) | 8.34 | 8.44 | 8.87 | 8.38 | 8.58 | 8.33 | 8.25 | 7.93 | 7.56 | 8.55 | 8.88 | 9.03 | 8.91 | 8.67 | 8.28 | 7.78 | 8.91 | 8.67 | 8.28 | 7.78 | 7.91 | 7.95 | Average of 10 Year Bechmark GoI securities
(Secondary Market) | 7.72 | 7.86 | 8.04 | 8.09 | 8.20 | 8.34 | 8.69 | 8.32 | 8.48 | 8.16 | 8.16 | 7.88 | 7.55 | 8.32 | 8.81 | 8.80 | 8.80 | 8.58 | 8.19 | 7.79 | 7.84 | 7.78 | | 14-Day ITBs | 5.00 | 5.00 | 5.00 | 5.00 | 5.00 | 5.00 | 5.00 | 5.00 | 5.00 | 5.00 | 5.00 | 5.00 | 5.00 | 5.00 | 5.00 | 5.00 | 5.00 | 5.00 | 5.00 | 5.00 | 5.00 | 5.00 | | Weighted Average SDLs | 8.31 | 8.32 | 8.44 | 8.47 | 8.55 | 8.61 | 9.01 | 8.85 | 9.09 | 8.89 | 8.87 | 8.63 | 7.91 | 9.33 | 9.38 | 9.52 | 9.22 | 8.98 | 8.48 | 8.08 | 8.17 | 8.26 |
|