Policy induced easy liquidity and financing conditions in response to the COVID-19 pandemic enabled improvement in lending rates, profitability and capital adequacy of banks with some moderation in balance sheet stress; however, bank credit has remained subdued. Macro stress tests indicate a deterioration in SCBs’ asset quality and capital buffers as regulatory forbearances get wound down. Contagion risks have receded with the shrinking of the inter-bank market. In the non-bank space, dominant positions occupied by mutual funds and insurance companies as fund providers continued, with Non-banking Financial Companies (NBFCs) and Housing Finance Companies (HFCs) turning out to be the largest borrowers. Introduction 2.1 The functioning of financial markets in the recent months has been characterised by the economic impact of the COVID-19 pandemic, with financial institutions largely cushioned by abundant liquidity in the banking system, lowering of the cost of funds, and regulatory forbearance in asset classification of specified loans. Resultantly, despite subdued credit offtake, banks reported better than anticipated results. The fuller impact of the deterioration in the macroeconomic environment on banks’ asset quality, capital adequacy and profitability may unfold gradually. 2.2 Nevertheless, a shock of such large dimensions is likely to place pressure on the balance sheets of banks going forward. The pre-pandemic vulnerabilities of some relatively weaker institutions may get accentuated. The pandemic is a common risk for a significant share of credit exposures in an interconnected financial market. An assessment of financial stability aspects through performance parameters and level of interconnectedness of Indian financial institutions, supplemented by macro stress tests, including bottom-up stress tests is useful to disband this complex aggregation. 2.3 Against this backdrop, this chapter sets out to evaluate the soundness and resilience of banks, NBFCs and scheduled primary (urban) cooperative banks (SUCBs) by examining their recent performance as reflected in audited balance sheets and offsite returns. The results of stress tests carried out on each category of financial intermediaries are presented in Sections II.1, II.2 and II.3. The chapter concludes with Section II.4 in which a detailed analysis of the network structure and connectivity of the Indian financial system is presented along with the results of contagion analysis under adverse scenarios. II.1 Scheduled Commercial Banks (SCBs)1 2 2.4 Credit growth (y-o-y) of SCBs, which had declined to 5.7 per cent by March 2020, slid further to 5.0 per cent by September 2020. For public sector banks (PSBs), credit growth picked up from 3.0 per cent in March 2020 to 4.6 per cent in September 2020, while for private sector banks (PVBs) it eased to 7.1 per cent from 10.4 per cent in March 2020. Foreign banks reported a decline of (-)5.4 per cent as against 7.2 per cent growth in March 2020 (Chart 2.1a). Loans disbursed through new accounts declined by almost one-fourth in Q1:2020-21 on an annual basis but subsequently, there has been some recovery. In Q2:2020-21 growth in new loans was witnessed primarily in the agriculture sector and in the personal loans segment (Table 2.1). 2.5 By contrast, deposit growth of SCBs remained robust at 10.3 per cent (y-o-y), driven by precautionary savings. PSBs recorded a growth of 9.6 per cent, among the highest in the last five years (Chart 2.1 a). 2.6 On the earnings front, SCBs’ net interest income (NII) grew at a much higher clip of 16.2 per cent in September 2020 (13.0 per cent in March 2020). Net interest margin (NIM) edged up across all banking groups in September 2020 (Chart 2.1 c). However, growth in other operating income (OOI) plummeted to 1.2 per cent from 29.2 per cent in March 2020. Earnings before provisions and taxes (EBPT) grew by 17.6 per cent (Chart 2.1 b). Return on assets (RoA) and return on equity (RoE) improved substantially across all bank groups, with the recovery in RoE of PSBs being particularly noteworthy after languishing at sub-zero and near zero levels for the past four years (Chart 2.1 d and Chart 2.1 e). Falling interest rates led to cost of funds declining across bank groups, with FBs recording a pronounced 130 bps decline since March 2020 (Chart 2.1 f). Concomitantly, yields on assets for SCBs edged downwards by 60 bps in September 2020, after remaining almost constant before the onset of the COVID-19 pandemic (Chart 2.1 g). | Table 2.1:Sector-wise New Loans by SCBs* | | (y-o-y, per cent) | | Sector | Share in March 2020 (%) | Q4:2019-20 Growth | Q1:2020-21 Growth | Q2:2020-21 Growth | | Agriculture | 9.1 | -2.0 | -22.3 | 18.0 | | Industry | 35.4 | 19.3 | -20.2 | -15.4 | | Services | 38.2 | 14.3 | -12.3 | -9.8 | | Personal Loans | 14.1 | 11.3 | -59.1 | 4.2 | | Others | 3.2 | -32.0 | -41.8 | -22.1 | | All Loans | 100.0 | 11.4 | -24.6 | -7.4 | Note : * excluding regional rural banks (RRBs).
Source: Basic Statistical Returns -1, RBI. |
II.1.1 Asset Quality and Capital Adequacy 2.7 SCBs’ gross non-performing assets (GNPA) and net NPA (NNPA) ratios continued to decline and stood at 7.5 per cent and 2.1 per cent, respectively, in September 2020 (Charts 2.2 a, b and c). The slippage ratio, defined as new accretion to NPAs in the quarter as a ratio to the standard advances at the beginning of the quarter, contracted sharply for consecutive half-years to 0.15 per cent in September 2020 (Chart 2.2 e), with the decline spread across all bank groups. The improvement was aided significantly by the regulatory dispensations extended in response to the COVID-19 pandemic.3 SCBs’ NPA provisions recorded marginal decline of 0.2 per cent (y-o-y), with PSBs and FBs decreasing their provisioning and PVBs increasing them (Chart 2.2 d). The provision coverage ratio (PCR) of SCBs taken together improved across all bank groups and rose from 66.2 per cent in March 2020 to 72.4 per cent in September 2020 (Chart 2.2 f). 2.8 The capital to risk-weighted assets ratio (CRAR) of SCBs improved considerably by 110 bps to 15.8 per cent in September 2020 over March 2020 (14.7 per cent). While PSBs recorded an increase of 60 bps, the improvement was more substantial for PVBs and FBs by 170 bps and 100 bps, respectively (Chart 2.2 g). In case of SCBs, Tier I leverage ratio also increased by 30 bps between March 2020 and September 2020, PVBs and FBs being the main contributors, having improved their ratio by 80 bps and 120 bps respectively, while the PSBs’ ratio remained flat (Chart 2.2 h). However, the actual capital cushion available with banks could be overstated in view of the regulatory forbearance.
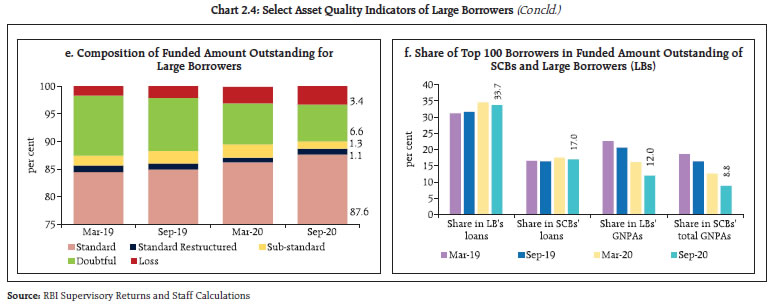
II.1.2 Sectoral Asset Quality 2.9 Among the broad sectors, asset quality improved noticeably in the case of industry, agriculture and services in September 2020 over March 2020, with a decline in GNPA and stressed advances ratios. In the case of retail advances, however, the GNPA ratio declined only marginally and stressed advances remained flat (Chart 2.3 a). A broad-based decline in GNPA ratio was visible across all major sub-sectors within industry (Chart 2.3 b). In view of the regulatory forbearance, however, there are implications for asset quality for the ensuing reporting periods. II.1.3 Credit Quality of Large Borrowers 2.10 The share of large borrowers7 in the aggregate loan portfolios and GNPAs of SCBs sustained its downward trajectory, declining to 50.5 per cent and 73.5 per cent respectively in the quarter ending September 2020 (Chart 2.4 a). However, foreign banks recorded a marginal increase in the GNPA ratio of large borrowers (Chart 2.4 b). The share of restructured standard advances increased, indicating that large borrowers have commenced availing restructuring benefits extended for COVID-19 stressed borrowers. The proportion of substandard and doubtful advances contracted while that of loss assets increased, reflecting ageing of the NPA portfolio (Chart 2.4 e). The top 100 large borrowers accounted for 17 per cent and 33.7 per cent of SCBs’ gross advances and large borrower loans, respectively. Although this represented a decline vis-à-vis March 2020, the share continued to remain above pre-COVID levels, indicating persisting credit concentration. However, the share of the top 100 borrowers’ in SCBs’ GNPA pool declined to 8.8 per cent (Chart 2.4 f). Large advances in the SMA-0 category registered a quantum jump (155.6 per cent) over the previous quarter and 245.6 per cent over March 2020 levels, portending slippages in the ensuing quarters (Chart 2.4 c). SMA-2 ratios of large borrowers increased for PVBs and FBs, while declining for PSBs (Chart 2.4 d). 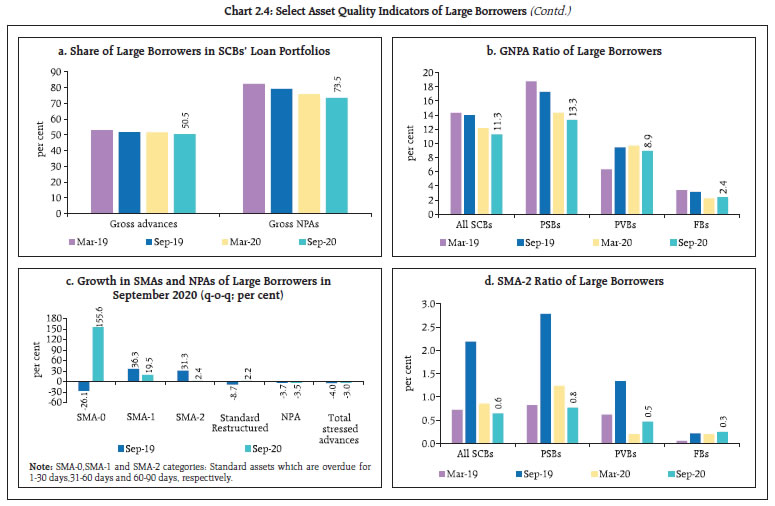
 II.1.4 Resilience – Macro Stress Tests 2.11 Macro-stress tests were performed to assess the resilience of SCBs’ balance sheets to unforeseen shocks emanating from the macroeconomic environment. Drawing on the results of the exercise, capital and impairment ratios are projected over a one-year horizon under a baseline and two adverse – medium and severe – scenarios. In the last Financial Stability Report, a one-time additional scenario of ‘very severe stress’ was introduced in view of the high uncertainty around the evolution of the COVID-19 pandemic, its economic costs and delay in the data gathering process. With better appraisal of the pandemic’s impact on economic conditions, it is assessed that the worst is behind us, though the recovery path remains uncertain. Accordingly, stress tests have reverted to the regular 3-scenario analysis in this issue. The baseline is derived from the steady state forecasted values of key macroeconomic variables8 and indicates the central path. By design, the adverse scenarios used in the macro stress tests are stringent conservative assessments under hypothetical adverse economic conditions. It is emphasised that model outcomes do not amount to forecasts. The medium and severe adverse scenarios have been obtained by applying 0.25 to one standard deviation (SD) shocks; and 1.25 to two SD shocks, respectively, to each of the macroeconomic variables, increasing the shocks by 25 basis points in each projection quarter (Chart 2.5). 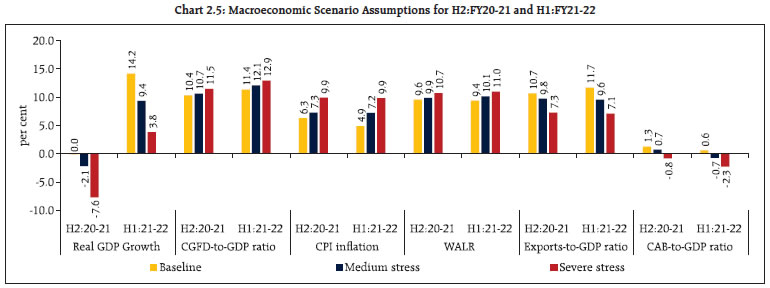 2.12 Generally, stress tests are carried out on the basis of SCBs’ balance sheet positions, including slippage of loans into NPA, profitability, capital and other relevant data reported by banks. In view of the regulatory forbearances such as the moratorium, the standstill on asset classification and restructuring allowed in the context of the COVID-19 pandemic, the data on fresh loan impairments reported by banks may not be reflective of the true underlying state of banks’ portfolios. This, in turn, can underestimate the impact of stress tests, given that the slippage ratios of the latest quarter for which data is available are the basic building blocks of the macro-stress testing framework. To tide over this limitation, it is necessary to arrive at reliable estimates of slippage ratios for the last three quarters, while controlling for the impact of regulatory forbearances. 2.13 A two-stage estimation procedure is adopted. First, for SCBs, data for December 2019 can be considered as the latest available data unaffected by the regulatory reliefs and are hence used as the starting point for the stress testing simulations to which realised values of the key macroeconomic variables are applied to obtain estimates of slippage ratios and GNPA ratios for the quarters ending March 2020, June 2020 and September 2020. In the second stage, the ratios estimated for September 2020 are taken as the base for projecting GNPA and capital ratios for September 2021. Contemporaneous cross-country experience in stress testing is captured in Box 2.1. Box 2.1: Stress testing in Pandemic Times: Some Country Experiences Stress tests gauge the adequacy of capital and liquidity buffers with financial institutions to withstand severe but plausible macroeconomic and financial conditions. In the face of a black swan event such as the COVID-19 pandemic, it is necessary to tweak regular stress testing frameworks to accommodate the features of the pandemic. In this regard the experience of other central banks is instructive. In its stress test in March 2020, the Reserve Bank of New Zealand (RBNZ) adopted two severe but plausible scenarios for the profitability and capital of the nine largest banks in the country. A pessimistic baseline scenario was characterised by a one-in-50 to one-in-75-year event, with the unemployment rate rising to 13.4 per cent (4.1 per cent in December 2019) and property prices falling by 37 per cent (4.6 per cent y-o-y growth in December 2019). In the very severe scenario, a one-in-200-year event was simulated in which a fall in house prices by 50 per cent akin to Ireland’s experience during the global financial crisis (GFC), and unemployment rate of 17.7 per cent were assumed. The US Federal Reserve Board (US-Fed) performed an additional round of stress tests in December 2020, apart from the stress tests conducted in June 2020. The first round assumed three scenarios: (i) a rapid V-shaped recovery; (ii) a slower U-shaped recovery; and (iii) a W-shaped, double-dip recession and recovery. A large fiscal stimulus was absent in the three scenarios. The unemployment rate was assumed to peak between 15.6 per cent and 19.5 per cent, which was much more stringent than any of the US-Fed’s pre-pandemic stress test scenarios and also higher than during the Great Recession. The December 2020 round of stress tests also featured severe global downturns with substantial stress in financial markets. They also included a global market shock component to be applied to banks with large trading operations, incorporating a default of the largest counterparty. These scenarios were significantly more severe than the current baseline projections for the path of the U.S. economy. The European Central Bank (ECB) performed a stress test during April-July 2020 to assess the impact of COVID-19 on 86 Euro area banks, featuring three scenarios: (i) a baseline scenario defined before the pandemic outbreak; (ii)a COVID-19 central scenario, reflecting the ECB’s projections which are the most likely to materialise; and (iii) a COVID-19 severe scenario, which assumed a deep recession and a slower economic recovery. The stress test methodology of the European Banking Authority (EBA) was used as a starting point after tailoring it to the needs of the vulnerability analysis. The methodology as well as the central and severe scenarios incorporated the impact of the unprecedented monetary, supervisory and fiscal COVID-19 relief measures. Bank of England (BoE) cancelled the 2020 annual stress test to help lenders focus on meeting the credit provisions of UK households and businesses. Instead, the Financial Policy Committee (FPC) of the BoE carried out a desktop stress test of the major UK banks and building societies in May 2020 using the scenarios outlined in BoE’s May 2020 Monetary Policy Report (MPR). In order to further examine the sufficiency of usable buffers to absorb losses, the bank also conducted a ‘reverse stress test’ in August 2020 to assess how severe an economic shock would need to be in order to deplete regulatory capital buffers by as much as in the 2019 stress test. References Bank of England (2020): “Interim Financial Stability Report”, May. Bank of England (2020): “Financial Stability Report”, December. Board of Governors of US Federal Reserve (2020): “Assessment of Bank Capital during the Recent Coronavirus Event”, June. Board of Governors of US Federal Reserve (2020): “December 2020 Stress Test Results”, December. European Central Bank (2020): “COVID-19 Vulnerability Analysis Results overview”, July. Knowles, J., Nicholls, K., & Bloor, C. (2020): “Outcomes from a COVID-19 stress test of New Zealand banks”, Reserve Bank of New Zealand Bulletin, 83(3), 1-12. | 2.14 The stress tests indicate that the GNPA ratio of all SCBs may increase from 7.5 per cent in September 2020 to 13.5 per cent by September 2021 under the baseline scenario (Chart 2.6). If the macroeconomic environment worsens into a severe stress scenario, the ratio may escalate to 14.8 per cent. Among the bank groups, PSBs’ GNPA ratio of 9.7 per cent in September 2020 may increase to 16.2 per cent by September 2021 under the baseline scenario; the GNPA ratio of PVBs and FBs may increase from 4.6 per cent and 2.5 per cent to 7.9 per cent and 5.4 per cent, respectively, over the same period. In the severe stress scenario, the GNPA ratios of PSBs, PVBs and FBs may rise to 17.6 per cent, 8.8 per cent and 6.5 per cent, respectively, by September 2021. 2.15 These GNPA projections are indicative of the possible economic impairment latent in banks’ portfolios, with implications for capital planning. A caveat is in order, though: considering the uncertainty regarding the unfolding economic outlook, and the extent to which regulatory dispensation under restructuring is utilised, the projected ratios are susceptible to change in a non-linear fashion. 2.16 The system level CRAR is projected to drop from 15.6 per cent in September 2020 to 14.0 per cent in September 2021 under the baseline scenario and to 12.5 per cent under the severe stress scenario (Chart 2.7 a). The stress test results indicate that four banks may fail to meet the minimum capital level by September 2021 under the baseline scenario, without factoring in any capital infusion by stakeholders. In the severe stress scenario, the number of banks failing to meet the minimum capital level may rise to nine (Chart 2.7 b). 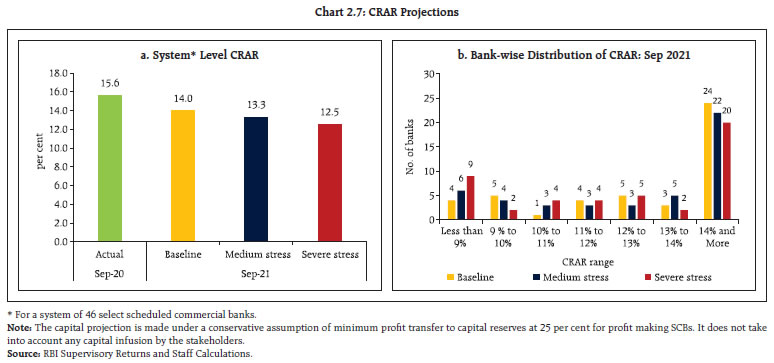 2.17 The common equity Tier I (CET 1) capital ratio of SCBs may decline from 12.4 per cent in September 2020 to 10.8 per cent under the baseline scenario and to 9.7 per cent under the severe stress scenario in September 2021 (Chart 2.8 a). Furthermore, under these conditions, two banks may fail to meet the minimum regulatory CET 1 capital ratio of 5.5 per cent by September 2021 under the baseline scenario; this number may rise to five in the severe stress scenario (Chart 2.8 b). 2.18 At the aggregate level, SCBs have sufficient capital cushions, even in the severe stress scenario facilitated by capital raising from the market and, in case of PSBs, infusion by the Government. At the individual level, however, the capital buffers of several banks may deplete below the regulatory minimum. Hence going forward, mitigating actions such as phase-wise capital infusions or other strategic actions would become relevant for these banks from a micro-prudential perspective. II.1.5 Sensitivity Analysis9 2.19 As part of a top-down10 sensitivity analysis, the vulnerabilities of SCBs were assessed under various scenarios11 by administering a number of single-factor shocks12 to data for September 2020 to simulate credit, interest rate, equity price and liquidity risks. a. Credit Risk 2.20 A severe shock of 2 SD13 to the system level GNPA (i.e., the GNPA ratio of 46 select SCBs moves up from 7.6 per cent to 13.6 per cent under the impact of the shock) would result in the system-level CRAR declining from 15.6 per cent to 11.6 per cent. The Tier-1 capital ratio declines from 13.3 per cent to 9.3 per cent. The system level capital impairment could thus be about 27.8 per cent (Chart 2.9 a). The results of reverse stress tests show that it requires a shock of 4.1 SD to bring down the system-level CRAR to 9 per cent. 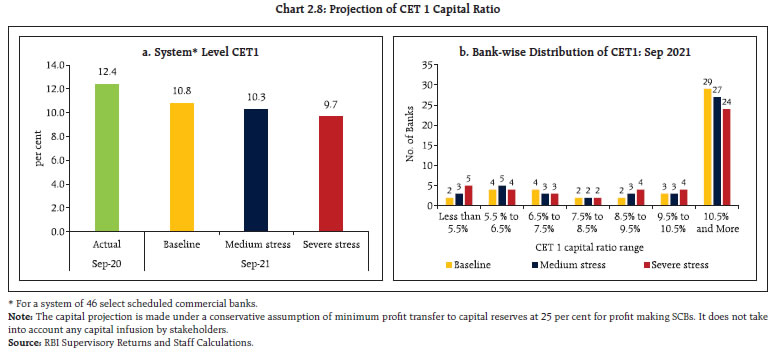 2.21 Bank-level stress test results show that if a 2 SD shock is applied to the GNPA ratio, 14 banks with a share of 41.1 per cent in SCBs’ total assets may fail to maintain the required CRAR (Chart 2.9 b). The CRAR would fall below 7 per cent for as many as 11 banks (Chart 2.9 c). When 1 SD and 2 SD shocks are applied, 2 and 11 banks, respectively, would record a decline of over six percentage points in the CRAR. Comparatively, PVBs and FBs would experience lower erosion in CRAR than PSBs under a 2 SD shock scenario (Chart 2.9 d). b. Credit Concentration Risk 2.22 Stress tests on banks’ credit concentration - considering top individual borrowers according to their standard exposures - showed that in the extreme scenario of the top three individual borrowers of respective banks failing to repay14, the CRAR of one bank will fall below 9 per cent (Chart 2.10 a) and 34 banks would experience a decline of more than one percentage point in their CRAR (Chart 2.10 b).
2.23 Under the scenarios of top three group borrowers of banks under consideration failing to repay15, the CRAR of one bank would fall below 9 per cent (Chart 2.11 a) and 38 banks would experience a decline of more than one percentage point in their CRAR (Chart 2.11 b). 2.24 Stress tests on banks’ credit concentration with respect to their top individual stressed borrowers showed that in the extreme scenario of the top three individual borrowers of respective banks failing to repay16, the CRARs of two banks would fall below nine per cent and the majority of the banks would experience a reduction of only 10 to 20 bps in their CRAR on account of low level of stressed assets as of September 2020 (Chart 2.12).
c. Sectoral Credit Risk 2.25 Sensitivity analysis of bank-wise vulnerabilities due to exposure to sub-sectors within industry (shocks based on sub-sector wise historical SDs of the GNPA ratio) reveals varying magnitudes of increases in the GNPAs of banks in different sub-sectors. A 2 SD shock to the basic metals and metal products and infrastructure-energy segment, would reduce the system level CRAR by 19 bps and 18 bps, respectively (Table 2.2). | Table 2.2: Decline in System Level CRAR | | (basis points, in descending order for top 10 most sensitive sectors) | | Sector | 1 SD | 2 SD | | Basic Metal and Metal Products (98%) | 10 | 19 | | Infrastructure - Energy (62%) | 9 | 18 | | Infrastructure - Transport (29%) | 3 | 6 | | All Engineering (38%) | 3 | 5 | | Textiles (33%) | 2 | 4 | | Construction (29%) | 2 | 3 | | Food Processing (26%) | 1 | 3 | | Vehicles, Vehicle Parts and Transport Equipments (79%) | 2 | 3 | | Infrastructure - Communication (56%) | 1 | 2 | | Cement and Cement Products (61%) | 1 | 1 | Note: For a system of select 46 banks.
Note: Numbers in parentheses represent the growth in GNPAs of that sub-sector due to 1 SD shock to the sub-sector’s GNPA ratio.
Source: RBI Supervisory Returns and Staff Calculations. | d. Interest Rate Risk 2.26 The market value of the investment portfolio subject to fair value for these sample SCBs stood at ₹20.9 lakh crore as on end-September 2020, the highest quarterly balance since March 2017 (Chart 2.13). About 95 per cent of the investments subjected to fair valuation were classified as available for sale (AFS). 2.27 The sensitivity (PV0117) of the AFS portfolio increased vis-a-vis the June 2020 position at an aggregate level, with FBs registering a 61.7 per cent increase in PV01 in the quarter. Some positioning in the greater than 10-year segment in FBs were, however, bonds held as cover for hedging derivatives and as such they may not be active contributors to PV01 risk. In terms of PV01 curve positioning, the tenor-wise distribution in PSBs indicates a steepening bias, with a slight increase in PV01 of 1-5 year maturity bucket and paring in the greater than 10-year segment, while the PVBs’ view appeared unchanged. FBs were seen to be having significant exposure in the long end of the curve (Table 2.3). 2.28 Robust profit booking across all bank groups was observed in the quarter ended September 2020, although on a lower scale compared to the June 2020 quarter, possibly due to the rising yield curve movements across tenors (Table 2.4 and Chart 2.14). With a significant concentration of interest rate positions in the sub five-year tenor across bank groups, and volatility being highest in the shorter tenor buckets, there is a need to be cautious about the prospects of contribution of the trading book to profits, going forward.
| Table 2.3: Tenor-wise PV01 Distribution of AFS Portfolio | | (in per cent) | | Sector | Total (in ₹ crore) | < 1 year | 1 year-5 year | 5 year-10 year | > 10 years | | PSBs | 254.7 (270.7) | 7.0 (7.3) | 37.8 (32.4) | 41.3 (42.3) | 13.9 (18.0) | | PVBs | 72.1 (72.3) | 18.7 (15.3) | 52.7 (51.3) | 26.2 (28.8) | 2.3 (4.6) | | FBs | 90.9 (56.2) | 4.7 (5.6) | 41.4 (45.3) | 12.2 (15.7) | 41.7 (33.4) | Note: Values in the brackets indicate June 2020 figures.
Source: Individual bank submissions and staff calculations. |
| Table 2.4: OOI - Profit/(loss) on Securities Trading | | (in ₹ crore) | | | Mar-20 | Jun-20 | Sep-20 | | Public Sector Banks | 8,271.07 | 10,081.93 | 6,843.91 | | Private Sector Banks | 4,185.46 | 9,882.76 | 4,520.88 | | Foreign Bank Group | 228.34 | 1,730.87 | 620.66 | | Source: RBI Supervisory Returns. |
| Table 2.5: Tenor-wise PV01 Distribution of HFT Portfolio | | (in per cent) | | | Total (in ₹ crore) | < 1 year | 1 year-5 year | 5 year-10 year | > 10 years | | PSBs | 1.7 (2.0) | 1.5 (0.5) | 9.2 (3.2) | 73.8 (31.6) | 15.7 (64.8) | | PVBs | 11.7 (55.6) | 10.2 (74.5) | 59.9 (16.3) | 17.3 (7.1) | 12.6 (2.0) | | FBs | 15.7 (11.5) | 5.4 (0.5) | 30.4 (40.3) | 51.3 (48.0) | 12.9 (11.3) | Note: Values in the brackets indicate June 2020 figures.
Source: Individual bank submissions and staff calculations. | 2.29 PVBs and FBs had significant interest rate exposure in their held for trading (HFT) portfolios relative to their AFS books, although PVBs had reduced their PV01 exposure significantly. The tenor-wise PV01 distribution for PVBs shows a pronounced shift to exposures in the 1-5 year tenor from the less than 1-year tenor, while FBs have increased PV01 sensitivity at both ends of the curve (Table 2.5). 2.30 Any hardening of interest rates would depress investment gains under the AFS and HFT categories (direct impact). A parallel upward shift of 2.5 percentage points in the yield curve will lower the system level capital and CRAR by 7.0 per cent and 93 basis points, respectively (Table 2.6). 2.31 An analysis of held-to-maturity (HTM) positions as of September 2020 across bank groups reveals that unrealised gains of PSBs are almost evenly spread across SDLs and G-Secs while those of PVBs are concentrated in G-Secs (Chart 2.15). The recent decision to conduct Open Market Operations (OMOs) in SDLs will provide an additional window for PSBs to crystallise their SDL gains. 2.32 The Reserve Bank vide its notification dated October 12, 2020 has allowed banks to hold SLR securities acquired between September 1, 2020 and March 31, 2021 under the HTM category up to an overall limit of 22 per cent of NDTL, untill March 31, 2022. As of September 30, 2020, PSBs’ holding of SLR-eligible securities in the HTM category amounted to 19.2 per cent of their NDTL, while for PVBs and FBs it stood at 19 per cent and 0.5 per cent, respectively. | Table 2.6: Interest Rate Risk – Bank-groups - Shocks and Impacts | | (under shock of 250 basis points parallel upward shift of the INR yield curve) | | | Public Sector Banks | Private Sector Banks | Foreign Banks | All SCBs | | AFS | HFT | AFS | HFT | AFS | HFT | AFS | HFT | | Modified Duration | 2.2 | 2.5 | 1.5 | 2.3 | 2.7 | 2.9 | 2.1 | 2.6 | | Reduction in CRAR (bps) | 103 | 46 | 239 | 93 | | Source: Individual bank submissions and staff calculations. |
e. Equity Price Risk 2.33 An analysis of the impact of a fall in equity prices on bank capital and profits indicates that the system-level CRAR would decline by 54 basis points in an extreme scenario of a 55 per cent drop in equity prices (Chart 2.16). The impact for the overall system is limited due to banks’ low capital market exposures arising from regulatory limits. f. Liquidity Risk 2.34 The liquidity risk analysis aims to capture the impact of a run on deposits and an increase in demand for unutilised portions of sanctioned / committed / guaranteed credit lines. Banks, in general, may be in a position to withstand liquidity shocks with their high-quality liquid assets (HQLAs)18. 2.35 Under the assumed scenarios, there would be increased withdrawals of un-insured deposits19 and a simultaneous increase in usage of the unutilised portions of sanctioned working capital limits as well as utilisation of credit commitments and guarantees extended by banks to their customers. Using their HQLAs required for meeting day-to-day liquidity requirements, 45 out of the 46 banks in the sample will remain resilient in a scenario of sudden and unexpected withdrawals of around 15 per cent of deposits, along with the utilisation of 75 per cent of their committed credit lines (Chart 2.17). II.1.6 Bottom-up Stress Tests: Derivatives Portfolio 2.36 A series of bottom-up stress tests (sensitivity analyses) on derivative portfolios were conducted for select banks20 with the reference date as September 30, 2020. The banks in the sample reported the results of four separate shocks on interest and foreign exchange rates. The shocks on interest rates ranged from 100 to 250 basis points, while 20 per cent appreciation/depreciation shocks were assumed for foreign exchange rates. The stress tests were carried out for individual shocks on a stand-alone basis.
2.37 The results reveal that while some FBs showed significant negative net mark-to-market (MTM) impacts as a proportion to CET 1 capital, the impact was largely muted in case of PSBs and PVBs (Chart 2.18). However, since risks can only be transferred and not eliminated, they could be residing in corporate balance sheets. Going forward, an assessment of the hedging profile of corporates as given in the disclosures would help understand the true extent of risks. 2.38 The stress test results showed that the average net impact of interest rate shocks and exchange rate shocks are in the range of 2.5 per cent of the total capital funds (Chart 2.19). In the interest rate segment, derivatives’ exposure remains short i.e., they gain from an interest rate rise, which is similar to their positioning in March 2020. As regards exposures to forex derivatives, the pay-off profile is consistent with a small short USD positioning. II.2 Scheduled Primary (Urban) Cooperative Banks 2.39 The performance of scheduled primary (urban) cooperative banks (SUCBs) deteriorated between March 2020 and September 2020. At the system level, their GNPA ratio deteriorated from 9.89 per cent in March 2020 to 10.36 per cent in September 2020 while their provision coverage ratio21 improved from 61.88 per cent to 65.13 per cent over this period. The CRAR at the system level22, stood at 9.24 per cent in September 202023, down from 9.70 per cent reported in March 2020. SUCBs’ liquidity ratio24 increased from 33.95 per cent to 34.35 per cent during the period.
II.2.1 Stress Test – Credit Risk 2.40 The impact of credit risk shocks on CRARs of SUCBs was simulated under four different scenarios25. Four SUCBs had CRARs below the regulatory minimum requirement of 9 per cent even before the shock. The results show that (i) under a 1 SD shock to sub-standard assets, the system level CRAR would decline to 9.08 per cent and one SUCB would fail to achieve the minimum CRAR requirement (in addition to four SUCBs which had CRAR below 9 per cent even before the shock); (ii) under a 2 SD shock to sub-standard assets, CRAR would decline to 8.90 per cent and two more SUCBs (seven in all) would fail to achieve the minimum CRAR requirement; (iii) under a 1 SD shock to loss advances, system level CRAR declines to 8.52 per cent and four more SUCBs (in addition to four which already had CRAR below 9 per cent) would fail to maintain the minimum CRAR requirement; and (iv) under a 2 SD shock to loss advances, the system level CRAR declines to 7.51 per cent and two more SUCBs (ten in all) would fail to maintain the minimum CRAR requirement. II.2.2 Stress Test - Liquidity Risks 2.41 Stress tests on liquidity carried out under two scenarios viz., increase in cash outflows in the 1 to 28 days’ time bucket by i) 50 per cent, and ii) 100 per cent, with cash inflows remaining unchanged, indicated that 18 and 30 SUCBs, respectively, would face liquidity stress26. II.3 Non-banking Financial Companies 2.42 Non-banking financial companies (NBFCs) saw a decline in growth in 2019-20, largely due to isolated credit events in a few large NBFCs, challenges in accessing funds and the overall economic slowdown, with the pandemic’s impact adding to the stress in the later period. During 2019-20, credit extended by NBFCs grew by 4.4 per cent as compared with 22 per cent in 2018-19. Gross NPAs of NBFCs increased from 5.3 per cent of total advances as on March 2019 to 6.3 per cent as on March 2020. Asset quality is expected to deteriorate further due to disruption of business operations caused by the pandemic, especially in the industry sector, one of the major recipients of NBFC credit. II.3.1 Stress Test - Credit Risk 2.43 System level stress tests for the NBFC sector’s credit risk were conducted for a sample of 200 NBFCs27 with asset size of more than ₹1000 crore as on March 2020. 2.44 System level stress tests for the NBFC sector’s aggregate credit risk were carried out under the three scenarios of baseline, medium and high risk. The baseline scenario presents the capital adequacy position of the NBFC sector as on March 2020 and medium and high risk scenarios present the capital adequacy position of the sector under 1 SD and 2 SD increases in GNPA. Under a high risk shock of 2 SD increase in the system level GNPA (GNPA of the sector increases from 6.8 per cent to 8.4 per cent), it is observed that the capital adequacy of NBFCs remained above 15 per cent, i.e., at 24.5 per cent, 24.1 per cent and 23.7 per cent, respectively, for baseline, medium and high risk scenarios of credit risk (Chart 2.20). 2.45 Stress tests at the individual NBFC level indicated that under the baseline, medium and high risk scenarios, CRAR of 3.3 per cent, 9.7 per cent and 10.3 per cent of NBFCs would fall below the minimum regulatory requirements. II.4 Interconnectedness II.4.1 Network of the Financial System28 29 2.46 A financial system can be visualised as a network with financial institutions as nodes and bilateral exposures as links joining these nodes. While these links enable efficiency gains and risk diversification, they can become conduits of risk transmission in case of a crisis. Understanding the nuances in propagation of risk through networks is useful for devising appropriate policy responses for safeguarding financial and macroeconomic stability. 2.47 The total outstanding bilateral exposures30 among the entities in the financial system increased marginally after witnessing a sharp fall in June 2020, largely on account of reduced borrowing of PVBs from the financial system (Chart 2.21 a). 2.48 SCBs continued to have the largest bilateral exposures in the Indian financial system in September 2020, though their share declined in the first half of 2020-21. SCBs’ lending to and borrowing from other entities (including other SCBs) stood at 42.2 per cent of total lending and borrowings in the system (Chart 2.21 b). Among bank groups, PSBs had a net receivable position vis-à-vis the entire financial sector, which increased during the last one year. On the other hand, PVBs had a net payable position, which declined y-o-y. FBs were evenly balanced (Charts 2.22 and 2.23). 2.49 After a sizable decline during 2019-20 when their AUM reduced, the share of AMC-MFs remained stable in H1:2020-21. During the same period, the shares of NBFCs, HFCs, insurance companies and pension funds increased to 15.3 per cent, 9.7 per cent, 9.6 per cent, and 1.8 per cent, respectively (Chart 2.21 b). The share of AIFIs, on the other hand, reduced to 9.0 per cent. 2.50 In terms of inter-sectoral31 exposures, AMC-MFs were the biggest fund providers in the system, followed by insurance companies, while NBFCs were the biggest receiver of funds, followed by HFCs. Among the entities which received funds from the financial system, PVBs recorded nearly 40 per cent decline (y-o-y), while payables of NBFCs and HFCs increased by 10.7 per cent and 1.8 per cent, respectively (Chart 2.23). 2.51 AMC-MFs recorded a significant decline in their receivables from the financial system during the last one year, while the same increased for PSBs and insurance companies, who were the other major fund providers (Chart 2.23). a. Inter-bank Market 2.52 The inter-bank market continued to shrink, in keeping with the trend over recent years. The share of fund-based32 inter-bank exposures in the total assets of the banking system declined during the first half of 2020-21, in keeping with past trends, due to excess liquidity in the banking system (Chart 2.24). Non-fund-based inter-bank exposures declined marginally.
2.53 PSBs remained the dominant players in the inter-bank market, although their share continued to decline and stood below 50 per cent during H1:2020-21 while that of PVBs and FBs grew (Chart 2.25). 2.54 The inter-bank market was dominated by short term (ST) exposures to the extent of about 71 per cent, with ST deposits accounting for the highest share, followed by ST loans. In case of long term (LT) fund based inter-bank exposure, 58.2 per cent comprised of LT loans (Chart 2.26).
b. Inter-bank Market: Network Structure and Connectivity 2.55 The inter-bank market typically has a core-periphery network structure33 34. At end-September 2020, there were five banks in the inner-most core and eight banks in the mid-core circle. This is in line with the pattern seen during the last six years, with the number of banks in the inner-most core ranging between two and five and comprising the biggest PSBs or PVBs. Most foreign banks and almost all old private banks continue to figure in the outermost periphery, making them the least connected banks in the system. The remaining PSBs and PVBs, along with a few major FBs, made up the mid and outer core. The merger of some PSBs with effect from April 2020 has impacted the mid-core and outer core (Chart 2.27). 2.56 A noteworthy point is that the most connected (and consequently in the inner-most core) entities could be either net lenders or net borrowers but their net receivables/payables could be smaller in absolute terms to those entities which are not as connected. 2.57 The degree of interconnectedness in the banking system (SCBs), as measured by the connectivity ratio35, has edged up in September 2020 after gradual decline over the last few years. The cluster coefficient36, which depicts local interconnectedness (i.e., tendency to cluster), has declined marginally over the last five years (Chart 2.28). c. Exposure of AMC-MFs 2.58 AMC-MFs remained the largest net providers of funds to the financial system. Their gross receivables were ₹7.74 lakh crore (29 per cent of their average AUM) whereas their gross payables were ₹0.67 lakh crore as at end-September 2020. 2.59 The top recipients of their funding were SCBs, followed by NBFCs, HFCs and AIFIs. Their receivables from SCBs declined in 2019-20 and also in H1:2020-21. In absolute terms, while SCBs have seen a decline in their payables to AMC-MFs in H1:2020-21, they increased for NBFCs and HFCs albeit in varying degrees. In contrast, AIFIs’ reliance on AMC-MFs, which has been increasing in earlier years, witnessed moderation during H1:2020-21 (Chart 2.29 a). 2.60 Instrument-wise, AMC-MFs’ receivables saw a sharp increase in the share of equity funding during H1:2020-21. In the case of debt funding, AMC-MFs have shown a marked preference for long term debt over short term debt, which is reflected in the movement of their relative shares. While equity exposures to financial system participants by mutual funds do not amount to contractual claims, simultaneous holdings in debt and equity exposures of financial system participants by balanced mutual funds allow transmission of risk from equity market sell-off to the debt markets and vice versa. Given the interconnected nature, such sell-offs can potentially transmit asset market shocks across the financial system (Chart 2.29 b).
d. Exposure of Insurance Companies 2.61 Insurance companies are the second largest net providers of funds to the financial system (gross receivables were ₹6.21 lakh crore and gross payables were ₹0.29 lakh crore in September 2020). 2.62 SCBs were the top recipients of their funds, followed by NBFCs and HFCs. LT debt and equity accounted for almost all the receivables of insurance companies, which had limited exposure to short-term instruments. LT debt of these companies mostly comprised of subscription to debt instruments issued by NBFCs and HFCs (Chart 2.30 a and b). e. Exposure to AIFIs 2.63 AIFIs were net borrowers of funds from the financial system and their gross payables increased to ₹3.36 lakh crore in H1:2020-21, whereas the gross receivables contracted to ₹2.83 lakh crore as at end-September 2020. The top fund providers to AIFIs were SCBs (primarily PVBs), followed by AMC-MFs and Insurance companies (Chart 2.31 a). These funds were provided mostly by the way of LT debt, LT deposits and CDs (Chart 2.31 b). The share of LT deposits declined for two successive quarters after its peak in March 2020.
f. Exposure to NBFCs 2.64 NBFCs were the largest net borrowers of funds from the financial system, with gross payables of ₹9.37 lakh crore and gross receivables of ₹0.93 lakh crore as at end-September 2020. They obtained more than half of their funding from SCBs, followed by AMC-MFs and insurance companies (Chart 2.32 a). During H1:2020-21, the choice of instruments in the NBFC funding mix reflects an increasing preference for LT debt from SCBs which, inter alia, reflects the support through Targeted Long-term Repo Operations (TLTRO) (Chart 2.32 b). g. Exposure to HFCs 2.65 HFCs were the second largest borrowers of funds from the financial system, with gross payables of around ₹6.20 lakh crore and gross receivables of ₹0.53 lakh crore as at end-September 2020. HFCs’ borrowing profile was largely similar to that of NBFCs, except that AIFIs played a significant role in providing funds to HFCs. The share of AMC-MFs in funding HFCs declined marginally in H1:2020-21 after the sharp decline in 2019-20. In contrast, the share of SCBs moderated after growing in the previous year (Chart 2.33 a). 2.66 As is the case of NBFCs, LT debt and LT loans were the top two instruments through which HFCs raised funds from the financial system, with an increasing share of LT debt (by PVBs). Resource mobilisation through CPs (subscribed to by AMC-MFs and, to a lesser extent, by SCBs), which had been on a consistent decline post the IL&FS episode, picked up marginally in the first half of 2020-21 (Chart 2.33 b). II.4.2 Contagion Analysis37 2.67 Contagion analysis uses network technology to estimate the systemic importance of different banks. The failure of a bank which is systemically important leads to greater solvency and liquidity losses for the banking system which, in turn, depend on the initial capital and liquidity position of banks along with the number, nature (whether it is a lender or a borrower) and magnitude of the interconnections that the failing bank has with the rest of the banking system. a. Joint Solvency38-Liquidity39 Contagion Losses for SCBs due to Bank Failure 2.68 The impact of discrete shocks on the banking system in this analysis is seen in terms of the number of bank failures that take place and the amount of solvency and liquidity losses that are incurred. 2.69 A contagion analysis of the banking network based on the end-September 2020 position indicates that if the bank with the maximum capacity to cause contagion losses fails, it will cause a solvency loss of 2.5 per cent of total Tier 1 capital of SCBs and liquidity loss of 0.5 per cent of total HQLA of the banking system. In comparing these estimates with a similar exercise undertaken six months ago when solvency and liquidity losses were estimated at 4.3 per cent and 0.3 per cent, respectively, no comfort can be drawn, given that the extent of vulnerability, as the impact of COVID-19 on banks’ balance sheet is yet to be reflected in full measure (Table 2.7). b. Solvency Contagion Losses for SCBs due to NBFC/ HFC Failure 2.70 NBFCs and HFCs are the largest borrowers of funds from the financial system. A substantial part of funding comes from banks. Therefore, failure of any NBFC40 or HFC will act as a solvency shock to their lenders, which can further spread by contagion. | Table 2.7: Contagion Losses due to Bank Failure – September 2020 | | Trigger Code | % of Tier 1 capital of the Banking System | % of HQLA | Number of Bank defaulting due to solvency | Number of Bank defaulting due to liquidity | | Bank 1 | 2.50 | 0.50 | 2 | 0 | | Bank 2 | 2.46 | 0.02 | 0 | 0 | | Bank 3 | 2.39 | 0.11 | 0 | 0 | | Bank 4 | 2.07 | 1.72 | 0 | 0 | | Bank 5 | 1.73 | 1.07 | 0 | 2 | Note: Top five ‘Trigger banks’ have been selected on the basis of solvency losses caused to the banking system.
Source: RBI Supervisory Returns and staff calculations. | 2.71 An analysis of the possible solvency contagion losses to the banking system caused by idiosyncratic failure of a NBFC indicates that, as at end-September 2020, the failure of the NBFC with the maximum capacity to cause solvency losses to the banking system can knock off 2.26 per cent of the latter’s total Tier 1 capital but it would not lead to failure of any bank. Failure of the HFC with the maximum capacity to cause solvency losses to the banking system will knock off 5.92 per cent of the latter’s total Tier 1 capital but no bank would fail in such an event (Tables 2.8 and 2.9). 2.72 The losses on account of idiosyncratic failure may have been understated due to non-reflection of the impact of COVID-19 on banks’ balance sheets. c. Solvency Contagion Impact41 after Macroeconomic Shocks to SCBs 2.73 The contagion impact of the failure of an institution is likely to be magnified if macroeconomic shocks result in distress in the banking system in a generalised downturn in the economy. Such shocks may affect solvency of some SCBs which, in turn, would act as a trigger for further solvency losses. In the previous iteration, the shock was applied to the entity that could cause the maximum solvency contagion losses, whereas the initial impact of macroeconomic shocks on individual bank’s capital is factored in from the macro-stress tests, in which a baseline and two (medium and severe) adverse scenarios have been considered for September 202142. 2.74 Initial capital loss due to macroeconomic shocks stood at 8.36 per cent, 12.39 per cent, and 17.25 per cent of Tier 1 capital for baseline, medium and severe stress scenarios, respectively. The number of banks that fail to maintain Tier I adequacy ratio of 7 per cent in the face of shocks ranged between three in the baseline and five in the medium stress scenario to eight in severe stress scenario. These banks had low Tier 1 capital in September 2020 (either already below 7 per cent or marginally higher). | Table 2.8: Contagion Losses due to NBFC Failure – September 2020 | | Trigger Code | Solvency Losses as % of Tier -1 Capital of the Banking System | Number of Defaulting banks due to Solvency | | NBFC 1 | 2.26 | 0 | | NBFC 2 | 2.21 | 0 | | NBFC 3 | 1.86 | 0 | | NBFC 4 | 1.30 | 1 | | NBFC 5 | 1.24 | 0 | Note: Top five ‘Trigger NBFCs’ have been selected on the basis of solvency losses caused to the banking system.
Source: RBI Supervisory Returns and staff calculations. |
| Table 2.9: Contagion Losses due to HFC Failure – September 2020 | | Trigger Code | Solvency Losses as % of Tier -1 Capital of the Banking System | Number of Banks Defaulting due to solvency | | HFC 1 | 5.92 | 0 | | HFC 2 | 3.70 | 0 | | HFC 3 | 1.97 | 1 | | HFC 4 | 1.92 | 1 | | HFC 5 | 1.34 | 0 | Note: Top five ‘Trigger HFCs’ have been selected on the basis of solvency losses caused to the banking system.
Source: RBI Supervisory Returns and staff calculations. | 2.75 Additional solvency losses to the banking system due to contagion (over and above the initial loss of capital due to the macro shocks), in terms of Tier 1 capital of the banking system amounted to 0.35 per cent for the baseline, 0.60 per cent for medium stress and 3.36 per cent for severe stress scenario. Under such conditions, one additional bank may fail due to contagion in the baseline and severe stress scenario (Chart 2.34). 2.76 The shrinking size of the inter-bank market and improved capital adequacy has limited contagion risk in the banking system under various scenarios. Nevertheless, as COVID-19 induced stress plays out going forward, capital adequacy across bank groups could come under pressure and contagion losses due to macro shocks under adverse scenarios could get exacerbated, unless the capital position of banks is shored up substantively. Summary and Outlook 2.77 In sum, the growing convergence of the Indian banking system with post-GFC regulatory and prudential standards, created capital and liquidity buffers which provided resilience in the current pandemic. Going forward, these cushions in banks’ balance sheets will have to contend with the rollback of regulatory forbearances announced in the wake of the pandemic. Capital and asset quality ratios of SCBs will be tested as the true economic value of portfolios of banks and other financial intermediaries is impacted by the disruption caused by the pandemic. 2.78 Macro-stress tests for credit risk show that GNPA ratio of SCBs may worsen under various stress scenarios and capital ratios may be eroded, highlighting the need for proactive provisioning and building up adequate capital to withstand the imminent asset quality deterioration. The direction to banks not to make any dividend payment on equity shares from the profits pertaining to the financial year ended March 31, 2020 is intended to strengthen balance sheets so that they can step forward to support lending to the real economy as recovery gains traction. 2.79 In the non-bank space, the dominant positions occupied by mutual funds and insurance companies needs to be assessed against the fact that non-banking financial companies and housing finance companies remain the largest borrowers, with systemic implications. Meanwhile, shrinking of the inter-bank market has reduced the risk of bank failure due to contagion effects. On its part, the Reserve Bank has stepped up close and continuous monitoring of all regulated entities and markets with the goal of maintaining and preserving financial stability at all times.
|