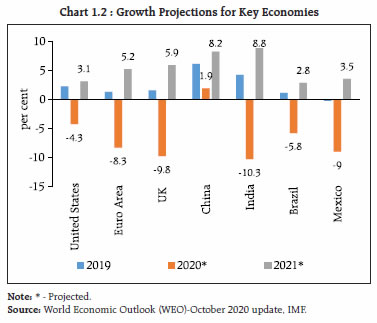
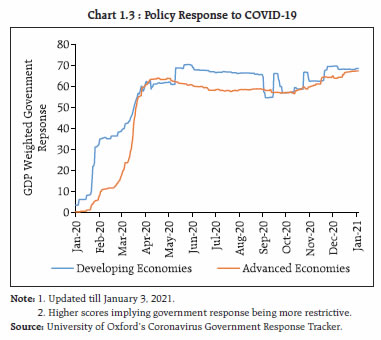
Economic activity has begun making a hesitant and uneven recovery from the unprecedented steep decline in the wake of the COVID-19 pandemic. Active intervention by central banks and fiscal authorities has been able to stabilise financial markets but there are risks of spillovers, with macrofinancial implications from the disconnect between certain segments of financial markets and real sector activity. In a period of continued uncertainty, this has implications for the banking sector as its balance sheet is linked with corporate and household sector vulnerabilities. Introduction 1.1 As global economic activity makes a hesitant and uneven recovery from the unprecedented COVID-19 pandemic on the back of extraordinary policy responses by monetary, fiscal and regulatory authorities, the focus is shifting to developing policies and strategies to nurse deleteriously affected sectors back to health and normalcy. The trade-off that will inevitably confront authorities and get sharper going forward is between cliff effects of terminating exceptional measures and risk a deterioration of the repair and healing that has been achieved so far, and ramp effects that involve more graduated withdrawal of policy support but also the moral hazard of making various economic agents more reliant on policy stimuli and for longer, eventually locking in authorities into forbearance and liquidity traps. 1.2 By all counts, policy authorities have been able to restrain the immediate risks from the destructive macrofinancial feedback loops of the pandemic, but incipiently pre-pandemic vulnerabilities have intensified and pose headwinds to a fuller recovery. Also, as stated earlier, support measures may have unintended consequences as reflected, for instance, in the soaring equity valuations disconnected from economic performance. These deviations from fundamentals, if they persist, pose risks to financial stability, especially if recovery is delayed. 1.3 Against this backdrop, this chapter begins with an overview of global and domestic macroeconomic and financial market developments. Section I.1 adresses global macrofinancial developments and the outlook. Section I.2 deals with domestic macrofinancial developments, emerging fiscal and corporate sector risks, and the evolving dynamics of bank and non-bank financial intermediation. The chapter concludes by drawing on the responses to the Reserve Bank’s half-yearly systemic risk survey. I.1 Global Backdrop I.1.1 Macrofinancial Developments and Outlook 1.4 Global economic activity remained besieged by the COVID-19 pandemic, more recently by the second wave that has forced re-clamping of lockdowns across Europe and a resurgence of infections in the US. This is casting a shadow on the strong rebound of economic activity in Q3:2020. The International Monetary Fund (IMF) placed global growth in 2020 at (-)4.4 per cent, followed by a recovery in 2021 to 5.2 per cent which is, nonetheless, insufficient to lift output above the 2019 level in most advanced and emerging market and developing economies (EMDEs), excluding China (Table 1.1 and Chart 1.1). Optimism about global growth in 2021 (Chart 1.2), on the back of vaccine roll-out, is now tempered by the realisation that production and distribution constraints will allow only a gradual move towards mass vaccination. | Table 1.1: Growth Projections for 2020 and 2021 | | (in per cent) | | Release period | Advanced Economies | EMDEs | World | | 2020 | 2021 | 2020 | 2021 | 2020 | 2021 | | January 2020 | 1.6 | 1.6 | 4.4 | 4.6 | 3.3 | 3.4 | | April 2020 | -6.1 | 4.5 | -1.0 | 6.6 | -3.0 | 5.8 | | June 2020 | -8.0 | 4.8 | -3.0 | 5.9 | -4.9 | 5.4 | | October 2020 | -5.8 | 3.9 | -3.3 | 6.0 | -4.4 | 5.2 | | Source: World Economic Outlook, IMF. | 1.5 The response of public authorities to the pandemic has varied across advanced economies (AEs) and emerging market and developing economies (EMDEs) (Chart 1.3). Since July 2020, policy measures have shifted to fine-tuning and extending strategies to nurse severely affected sectors back to health. Given the substantial risk of a looming solvency crisis eroding the strength of the business sector, authorities have turned to providing fiscal support to rebuild businesses. The European Union (EU), through its long-term budget and other initiatives, has designed a fiscal package of Euro 1.8 trillion, the largest stimulus package ever to be funded through the budget. In Japan, fiscal authorities have introduced a fresh stimulus package of about Yen 73.6 trillion, of which about Yen 40 trillion is dedicated to fiscal spending on loans, investments and other measures. The US has approved a US$ 2.3 trillion coronavirus relief and government spending package in the wake of a second resurgence of the pandemic and slowing employment numbers in November 2020. 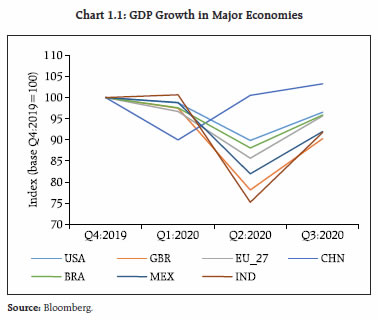
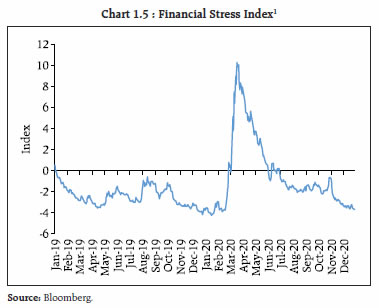
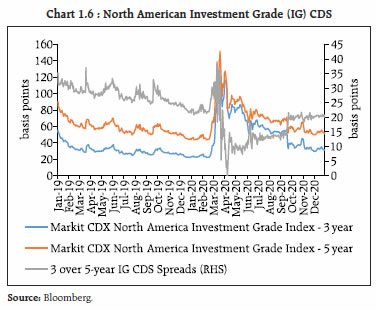
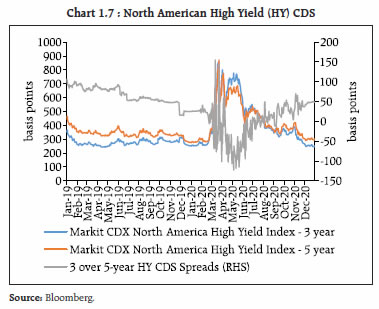
 1.6 Given the unprecedented nature of the crisis, central bank interventions spanned interest rate reductions, funding liquidity and market liquidity expansion, asset purchases, credit easing, macroprudential policies and swap lines. They have persisted with and in some jurisdictions intensified these measures since July 2020. Illustratively, in a series of measures, the European Central Bank (ECB) has ramped up its corpus for purchase of sovereign bonds (including principal repaid), extended the horizon of such purchases and recalibrated the conditions of targeted longer-term refinancing operations. As a result, policy rates have touched historic lows and have even descended to negative territory and balance sheets have expanded to levels hitherto unobserved (Chart 1.4). 1.7 These actions have eased financial conditions across the globe back to pre-COVID levels. The Office of Financial Research’s Financial Stress Index1 (OFR FSI) moved further into negative territory since July 2020, indicating below average stress levels (Chart 1.5). Easing financial conditions have also directly impacted insurance on corporate credit, with high-grade and high-yield credit default swaps (CDS) in the US back at their pre-COVID levels and the 3-year over 5-year CDS spread changing course after the COVID-19 induced inversion (Charts 1.6 & 1.7). European CDSs were similar, approaching pre-COVID levels. While easier financial conditions do support growth prospects in the short run, the longer-term impact in terms of encouraging leverage and inflating asset prices may give rise to financial stability concerns. 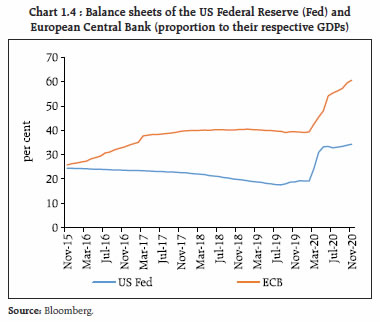
 1.8 The massive infusion of central bank liquidity in the wake of the pandemic has led to a sharp decline in term rates (Chart 1.8), which has brought down borrowing costs substantially, but has also compressed net interest rate margins of banks, driving down their profitability2. Even as deposit yields have fallen, assets under Money Market Mutual Funds (MMMFs) have grown, indicative of a search for yield (Chart 1.9). Such risk taking among institutional investors, specifically in illiquid investments to earn targeted returns, may lead to build-up of financial vulnerabilities, with adverse implications for financial stability.
| Table 1.2: Fiscal Deficit as per cent of GDP – Key Regions | | | 2019 | 2020* | | Advanced economies | -3.01 | -14.39 | | Emerging and Middle-Income Asia | -6.00 | -11.40 | | Emerging and Middle-Income Europe | -0.65 | -7.18 | | Emerging and Middle-Income Latin America | -4.00 | -11.09 | | Emerging Market and Middle-Income Economies | -4.83 | -10.72 | Note: * - Projected.
Source: IMF Fiscal Monitor; | 1.9 Other fault lines have also emerged in the wake of the COVID-19 pandemic-induced economic disruptions. For one, the pandemic has severely affected government revenue receipts which, in turn, has inflated sovereign borrowing to fund sharp increases in fiscal deficits across all geographies, especially in the advanced economies (Table 1.2). This has aggravated global debt vulnerabilities. 1.10 Second, it has exposed vulnerabilities in treasury markets. Following the onset of the pandemic, the 3-month overnight indexed swap (OIS)-US Treasury Bill (T-Bill) spread turned negative persistently, pointing to unprecedented illiquidity in US money markets which, in turn, had a cascading influence on global risk appetite, affecting borrowing rates and flows (Charts 1.10 & 1.11). The unsecured rate’s spread over the OIS rate, also widened sharply. While these spreads have reverted to positive territory more recently, the developments brought into sharp relief the implications for emerging markets (EMs), should the frailties of the US treasury market give rise to US dollar shortages in non-US markets. 1.11 Third, COVID-19 has accentuated the credit risk of firms and households, which is impacting short term corporate earnings. Yet, strong growth expectations remain firmly embedded in equity prices (Charts 1.12 & 1.13). Developments that lead to re-evaluation of corporate earnings prospects will have significant implications for global flows, going forward.
1.12 The policy endeavour is moving from mitigating stress to repair and recovery. Accordingly, a policy shift is underway from broad-based liquidity support to more targeted measures to support households and firms and to maintain the health of the financial system (Box 1.1). 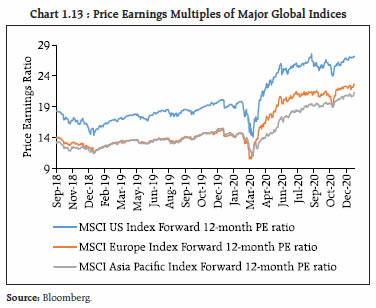
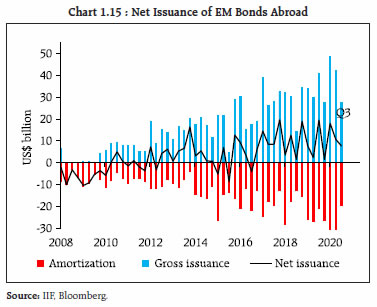
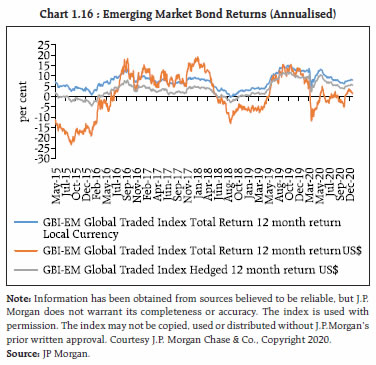
Box 1.1: Reviving and Restructuring the Corporate Sector Policymakers around the world took quick and bold measures through injection of liquidity, reduction in cost of funds, regulatory forbearance, consumption supporting stimulus packages and other measures to contain the immediate adverse effects of the COVID-19 pandemic. The pandemic has ushered in several structural changes in consumption patterns and business operations, the impact of which is still unfolding. For some businesses, solvency concerns have become acute. Accordingly, authorities need to be in readiness to alter their responses with new tools and processes to further support the corporate sector. In this context, the Group of Thirty (G30)3, has set out key universal principles on reviving and restructuring the corporate sector post-COVID in its mid-December 2020 report. They include (a) the productive use of scarce resources; (b) encouraging necessary or desirable business transformations; (c) harnessing private sector expertise; and (d) appropriately timing the interventions. It primarily focusses on using targeted credit programs, encouraging infusion of equity/equity-like investments into viable companies and enabling restructuring of balance sheets rapidly and inexpensively through suitable bankruptcy and workout procedures. Insurance for corporates generally revolves around protection against business interruption, but virtually always excludes coverage of losses from a pandemic as quantification and pricing of unpredictable risks is difficult. The report examines government-backed business interruption insurance, either directly or via reinsurance, where fiscal capacity acts as a limiting factor. In jurisdictions with strong private financial institutions and deep capital markets, prioritising financial restructuring through mobilising various mechanisms may be feasible. In some emerging economies with relatively weaker institutional frameworks, however, the focus is likely to be on extending sovereign borrowing capacity for government-backed support. Emerging economies also face constraints in the form of large employment-intensive unorganised sectors affected by the pandemic and the embedded risks of adverse selection in designing the support schemes. Also, any restructuring of corporate credit obligations would possibly require conversion of some credit claims to equity, where selection of projects eligible for such conversion is critical. Hence, while the “optimal response” may vary by jurisdiction, the report stresses the urgency to act before the underlying strength of the business sector is completely eroded. References Group of Thirty (2020): Reviving and Restructuring the Corporate Sector Post-Covid: Designing Public Policy Interventions. Working Group on Corporate Sector Revitalisation. Special Report (December 15). International Monetary Fund (2020). Global Financial Stability Report. October. | I.1.2 Capital Flows and Exchange Rate Volatility 1.13 After the unprecedented outflows in the earlier part of the year following the outbreak of the pandemic, a hesitant recovery in capital flows to emerging markets (EMs) began in June 2020 and picked up strongly following positive news on COVID-19 vaccines (Chart 1.14). The response of foreign investors to primary issuances from EMs has been ebullient (Chart 1.15). Anticipating the COVID-19 vaccine induced economic boost, US yields of intermediate tenors (2– and 5-year) have started edging higher4. This could have implications for future portfolio flows to EMs. 1.14 EM local currency bond portfolio returns in US$ terms have been lower than local currency as well as hedged returns since early 2020 as emerging market currencies have softened against the US$ (Chart 1.16). This has led to sluggishness in EM local currency bond flows even as global bond markets have been pricing in a prolonged economic slowdown and benign inflationary conditions in Europe and US. In this scenario, any significant reassessment of either growth or inflation prospects, particularly for the US, can be potentially destabilising for EM local currency bond flows and exchange rates. I.1.3 COVID-19 and Bank Capital 1.15 The world faced the COVID-19 crisis with much better capitalised banks than was the case during the global financial crisis of 2008; the latter actually provided an impetus for stronger capital buffers. The COVID-19 crisis has significantly altered capital costs of banks and has posed challenges for both banks and prudential authorities. Bank stock prices plummeted as the crisis unfolded (BIS, 20205) and their subsequent recovery was subdued as they generally remained well below other global stock prices and also below their own pre-crisis levels. Similarly, price-to-book ratios fell, plateauing at around unity, on average, for banks outside Europe. Less profitable banks in Europe and Japan had ratios below unity pre-crisis and they deteriorated even further thereafter. Although US and European banks’ Contingent Convertible (CoCo) bonds have recovered sharply from COVID-19 induced lows (Chart 1.18), funding costs for such instruments are still recovering and are high relative to their pre-COVID levels (BIS, op.cit). 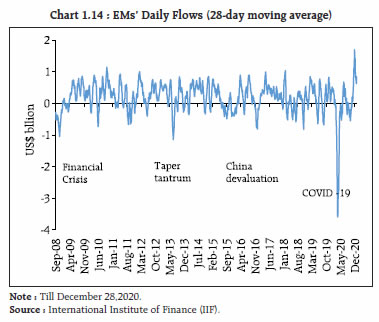
 1.16 While globally regulators have encouraged banks in their jurisdictions to dip into their buffers to support the local economy, this has not yielded desired results uniformly. An analysis of key balance sheet parameters of banks across regulatory jurisdictions through the pandemic throws up interesting contrasts. While the growth in bank loans in Asia remained robust (largely driven by a sharp recovery in China), US banks have been aggressive in loan loss provisioning and UK and European banks lead in common equity tier-1 (CET-1) capital augmentation (Charts 1.19 to 1.21).
I.1.4 Commodity Market Spillovers 1.17 There was considerable excitement in the energy markets at the news of an effective vaccine candidate against COVID-19. Oil prices initially surged and the Brent front month futures price bounced back to over US$ 45/barrel (bbl) (Chart 1.22), a level not seen since the beginning of September. However, the International Energy Agency (IEA), in its November monthly report, did not anticipate a significant impact of the vaccine in the first half of 2021. The surging caseloads, particularly in Europe and the US and the consequent recent announcements of lockdowns and other containment measures in many countries, have led to lower estimates for global oil demand. The IEA estimates global oil demand to average 91.3 million barrels /day (mb/d) in 2020, which is 8.8 per cent lower than in 2019. In 2021, demand is expected to recover to 97.1 mb/d which would still be about 3 per cent below the pre-COVID level in 2019. 1.18 The recent news on vaccine development has kindled hopes of a recovery of demand outside of China in 2021 which will support metal prices, although the likely pull back in demand both in Europe and the US due to the second pandemic induced lockdown constitutes a near term risk to that outlook. The expectation that, going forward, a moderation in China’s demand will be offset by improvements in the rest of the world, is supporting base metal prices, which have registered a sharp recovery in Q3:2020 from pandemic induced lows (Chart 1.23). 1.19 Volatility in commodity prices has a large impact on commodity exporting countries 91 per cent of which are categorised as low income. A significant commodity price downswing spanning mineral, energy and agricultural products over 2013-17 has severely stretched the fiscal balance of such countries (UNCTAD 2019) (Table 1.3). As a result, their fiscal support in response to the pandemic has been minimal. A continued slump in commodity prices is likely to have severe implications for fiscal sustainability of the low-income countries, which are also among the most indebted.
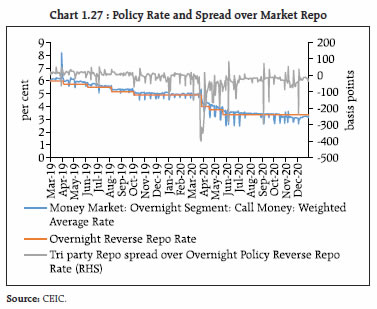
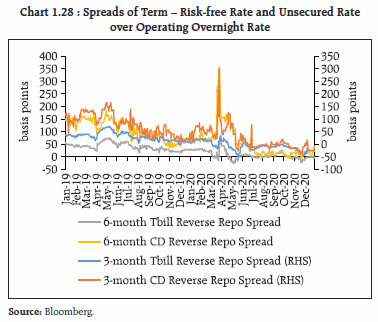
| Table 1.3: Fiscal Deficit as per cent of GDP of Low Income Regions | | | 2015 | 2016 | 2017 | 2018 | 2019 | 2020* | 2021* | | Low-Income Developing Asia | -4.22 | -3.26 | -2.72 | -3.89 | -4.11 | -6.32 | -5.67 | | Low-Income Developing Latin America | -1.33 | -0.72 | -0.64 | -1.15 | -0.51 | -3.93 | -3.10 | | Low-Income Developing Sub-Saharan Africa | -3.76 | -4.28 | -4.51 | -3.98 | -4.09 | -6.26 | -4.86 | | Source: IMF Fiscal Monitor; * = Projected | 1.20 Global food commodity prices, as tracked by the FAO Food Price Index6 (FFPI), rose sharply in November 2020, continuing the reversal since May 2020 (Chart 1.24). All sub-indices of the FFPI registered gains in November, with the vegetable oil sub-index rising the most, followed by those of sugar, cereals, dairy and meat. I.2 Domestic Macrofinancial Developments 1.21 The large disruption in economic activity in the wake of the pandemic has resulted in fiscal strains, corporate sector stresses and weakening of demand conditions. Rapid and bold responses of the Reserve Bank, other financial sector regulators and the Government have contained risks to financial stability for now. Inward capital flows have been supported by surplus global liquidity in search of yields. The full impact of the pandemic on the domestic economy is still unfolding and the outlook would depend on the pace of the recovery, especially for more vulnerable cohorts of small and medium enterprises. 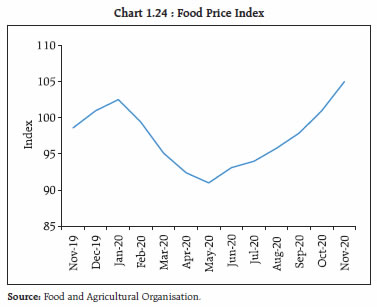 1.22 In the wake of a sequential 8-quarter slowdown in domestic activity, the outbreak of COVID-19 turned out to be a once-in-a-century black swan event that took the Indian economy down into one of the deepest contractions among peer economies in April-June 2020. As per the advance estimates, GDP is expected to shrink by 7.7 per cent in 2020-21. Since then, however, an uneven, multi-speed recovery is gradually taking hold. As a result, contractions in several sectors are easing, and green shoots are visible in some others. Surges of capital flows are being experienced, with the return of risk appetite and a renewed search for yield. Financial markets and asset prices have been lifted by this resurgence of foreign portfolio investment to India. Alongside a growing optimism on the brightening of India’s prospects, consumer and business confidence is turning upbeat with the progressive unlocking and normalisation of supply disruptions. Nevertheless, global developments, elevated domestic inflation pressures and the incipient festering of financial stress under the camouflage of moratorium, asset recognition standstill and the one-time restructuring, slant the balance of risks to the downside. I.2.1 Recent Macroeconomic Developments 1.23 Government finances are likely to deteriorate in 2020-21, with revenues badly hit by COVID-19 related disruptions even as expenditure pressure remains high on account of the fiscal stimulus. 1.24 The pandemic-led economic contraction has resulted in revenue shortfall for the Government. During April-November, total receipts of the union government contracted by 17.9 per cent in relation to the previous year. However, revenue collections seem to have turned the corner, as indicated by monthly GST revenues (centre + states) which recorded positive y-o-y growth of 10.2 per cent, 1.4 per cent and 11.6 per cent in the months of October,November and December, respectively. Despite the sizeable fiscal stimulus, total expenditure recorded a modest growth of 4.7 per cent during April-November 2020-21, with revenue expenditure growing at 3.7 per cent and capital expenditure by 12.8 per cent, as part of the additional expenditure requirement has been met by re-allocation of funds from other heads of expenditure. 1.25 For states, lower own revenue receipts, coupled with the additional burden of lower federal transfers, may accentuate downside risks to the outlook in 2020-21. During April-October, total receipts of state governments contracted by 13.7 per cent, which induced a contraction in total expenditure by 4.1 per cent over previous year. The revenue expenditure of states has also not witnessed any sharp upturn during April-October 2020-21 as compared with previous years, despite the fact that states have been at the forefront in the fight against the pandemic. This is primarily attributable to re-prioritisation of expenditure through means such as Dearness Allowance (DA) freeze, deferment of part or full salary, and rationalisation of travel and vehicle expenses (RBI, 2020). Growth in capital expenditure of state governments in October 2020, however, witnessed a positive growth after eight months of consecutive contraction. 1.26 The large gap between receipts and expenditure has been met primarily through additional market borrowings, as reflected in the revised borrowing calendar announced by the Centre and higher market borrowing limits given to states (Chart 1.25). Pressures from the spillover of increased government borrowings to the bond markets have so far been contained by the liquidity support measures of the Reserve Bank, besides increase in the limits of ways and means advances, as also relaxation of rules governing withdrawals from the Consolidated Sinking Fund (CSF) to ease the redemption pressure on states. 1.27 With the weakening of domestic demand in H1:2020-21, the current account surplus increased to 3.1 per cent of GDP (0.1 per cent in Q4:2019-20). India’s merchandise exports contracted by 21.2 per cent in H1:2020-21 due to demand and supply disruptions caused by the COVID-19 pandemic. Imports shrank even more sharply – by 39.7 per cent. Subsequently, exports have shown some signs of revival as the rate of contraction moderated to 4.8 per cent in Q3:2020-21, with non-oil exports expanding by 2.6 per cent during the quarter. With the gradual unlocking of the economy, the decline in imports has also moderated to 5.6 per cent during Q3: 2020-21 (Chart 1.26). Based on provisional data, there was a sharp rebound in imports by 7.6 per cent in December 2020. The turnaround in imports was broad-based as 20 out of 30 major commodities registered an expansion led by gold, electronic goods, chemicals, pearls and precious stones, machinery and vegetable oils. There has been a narrowing of the trade deficit to US$ 24.1 billion in H1 from US$ 88.9 billion a year ago; during Q3:2020-21, the trade deficit at US$ 34.3 billion was lower than US$ 37.1 billion in the same quarter last year. India’s trade outlook may improve in line with the gradual pick up in global trade activity as projected by the World Trade Organisation (WTO), though downside risks remain. 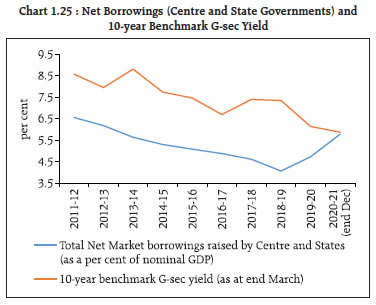 1.28 The Reserve Bank’s balance sheet expanded considerably in its efforts to deal with the economic consequences of the pandemic. The unprecedented infusion of liquidity has affected the near-end term curve. Since March 2019, the overnight secured funding rate for market transactions, which was 10-15 bps lower than the LAF reverse repo rate, has fallen sharply from late October 2020 (Chart 1.27). The unsecured overnight call rate, which was generally in the reverse repo-MSF corridor has also fallen below the reverse repo rate from around the same time. Consequently, the risk-free money market term structure, specifically at the short end of the curve, has consistently touched negative spreads over the reverse repo rate (Chart 1.28). The state of the term curve largely reflects the surplus liquidity conditions. 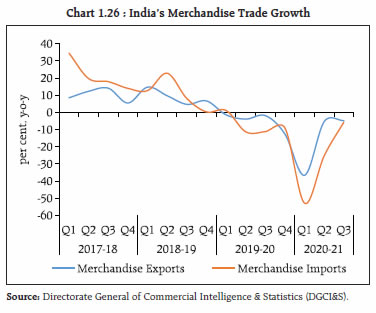
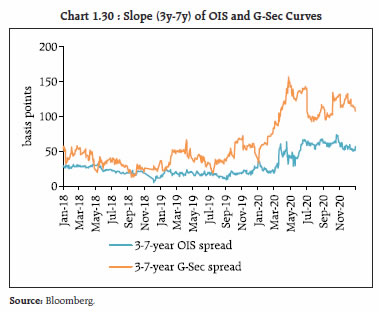
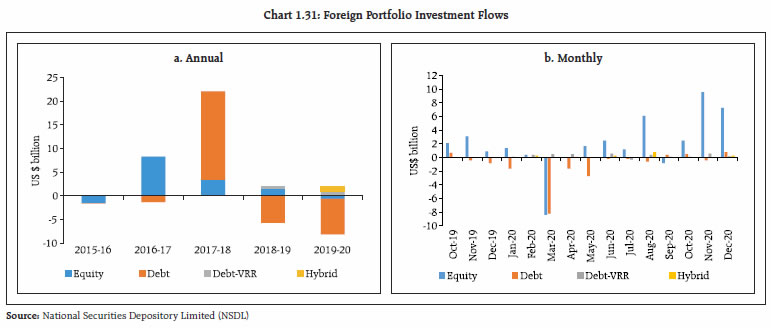
 1.29 Since January 2019, the overnight market repo rate (weighted average) has softened from 6.37 per cent to 3.03 per cent while the 3-month T-bill-3-year G-Sec spread has widened from 43 bps to 133 bps, implying that the softening of 3-month T-bill rates has been the main driver of the steeper yield curve up to the 3-year tenor (Chart 1.29). 1.30 A comparison of the slopes of the overnight indexed swap (OIS) curve relative to the G-Sec curve over the 3-year and 7-year tenors reveals considerable churn in the underlying G-Sec curve, although it has generally been steeper relative to the OIS curve in the wake of the pandemic (Chart 1.30). Most of the advanced economies also witnessed significant rise in spreads in the wake of the pandemic. 1.31 With the onset of the COVID-19 pandemic, global financial conditions had tightened sharply in March 2020, precipitating a selloff by portfolio investors which was unprecedented both in scale and pace. Foreign portfolio investment (FPI) flows have, however, rebounded since June 2020 propelled by risk-on sentiments, weakening of the US dollar and increased global monetary and fiscal stimulus (Chart 1.31). Net FPI inflows were at an all-time monthly high of US$ 9.8 billion in November 2020. During April-December 2020, net FPI inflow in equities was US$ 30.0 billion as compared with inflow of US$ 6.0 billion a year ago – in the debt segment (general route), there were outflows of US$ 2.7 billion as compared with inflows of US$ 2.9 billion a year ago while under the voluntary retention route (VRR), there were net inflows of US$ 2.3 billion during the same period. 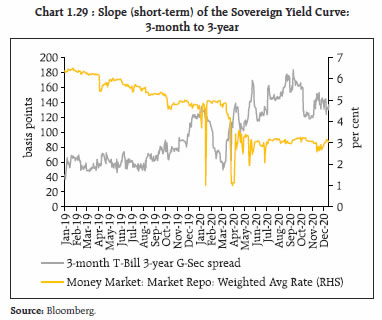
 1.32 During March to December 2020, domestic institutional investors (DIIs), particularly the mutual funds and the insurance sector, counter-balanced the actions of FPIs in the equity cash segment (Chart 1.32a and b). 1.33 The Indian rupee has appreciated since end-June 2020 due to weakening of the US dollar and robust capital inflows. The appreciation of the rupee, however, was modest as compared with emerging market (EM) peers (Chart 1.33 a). It has traded with an appreciating bias against the US dollar and underlying realised volatility has moderated since mid-October 2020 (Chart 1.33 b).
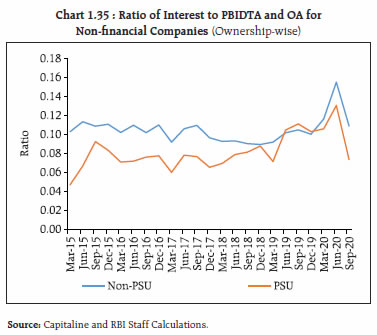
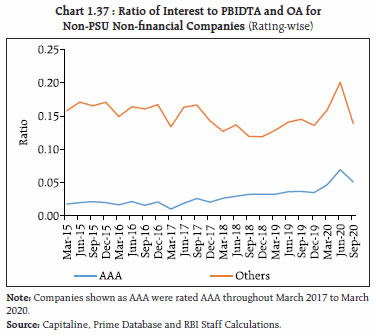
1.34 The MIFOR-OIS spread of 1 and 3-year tenors has, however, widened comparable to pre-COVID levels, in the positive territory (Chart 1.34). While comparing an interbank funding curve derived out of foreign exchange premia and USD LIBOR (MIFOR) with the evolution of the risk-free policy rate (OIS) may appear incongruous, it conveys implications for funding (basis swaps), especially as OIS linked rates are more susceptible to domestic inflation linked volatility. In addition, a higher MIFOR level renders hedging of short USD exposures expensive. I.2.2 Corporate Sector 1.35 The private corporate business sector had been experiencing a deterioration in performance even before the pandemic. This became accentuated with the outbreak of COVID-19. The brunt of the pandemic’s impact was concentrated in Q1:2020-21. Signs of recovery became visible in Q2:2020-21. The contraction in sales at (-) 4.3 per cent was a significant improvement from the precipitous decline of 41.1 per cent in the preceding quarter for listed private manufacturing companies. Enabled by cost cutting as reflected in a larger reduction in expenses relative to sales, the manufacturing sector posted improvements in operating profits and in debt servicing, the latter being reflected in the improvement in their interest coverage ratio (ICR). Sales growth of the IT sector, on the other hand, remained resilient through H1:2020- 21. Although profit margins improved across sectors, manufacturing companies reduced leverage7 during H1:2020-21 vis-à-vis the previous half-year and built up precautionary cash positions, as reflected in the unaudited balance sheets of 1,249 listed private manufacturing companies. Further, their investment in fixed assets remained subdued. 1.36 An analysis of a sample of 2,788 listed non-financial entities {54 public sector undertakings (PSUs) and 2,734 non-PSU companies} from March 2015 to September 2020 shows significant worsening of the ratio of interest to PBIDTA & OA 8 in the wake of the pandemic followed by noticeable improvement in Q2:2020:21 (Chart 1.35). A disaggregated analysis of listed non-PSU non-financial companies, based on the size of total debt (as per latest balance sheet data), however, indicates interest to PBIDTA & OA ratios still above pre-COVID levels for the large borrowers (Chart 1.36). Rating wise analysis of a constant sample of 1,195 listed non-PSU non-financial companies shows a more severe impact as also sharper recovery for lower rating grades (Chart 1.37). 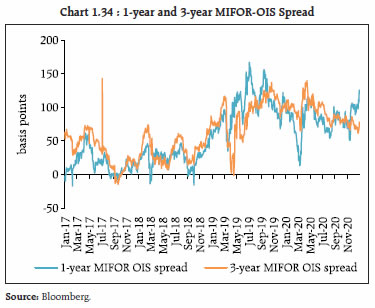
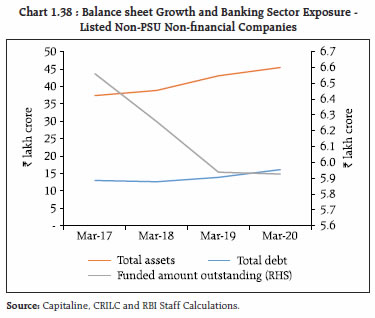
 1.37 An analysis of a smaller common set of 1,700 listed non-PSU non-financial companies reflects the increasing role of non-banks in funding their balance sheet expansion during the period 2017-2020. The on-balance sheet debt as also total assets of the companies have grown, even as banking sector exposure to this cohort has declined significantly (Chart 1.38). As demand for bank credit by the non-financial corporate sector has moderated, scheduled commercial banks’ (SCBs) asset portfolio has grown on the back of demand for retail loans. Going forward, resurgence in economic activity may lead to higher loan demand from the non-financial corporations for their operational and investment needs. 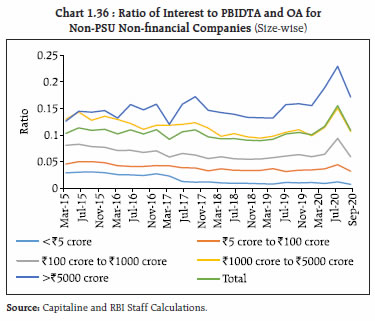
 1.38 The long-term rating momentum (quarterly upgrades versus downgrades), which has been consistently declining since Q3:2018-19, showed a reversal in Q2:2020-21 even though the rating downgrades continue to outnumber upgrades (Chart 1.39). The ratings migration, however, also reflects the temporary discretion given by the SEBI to credit rating agencies in recognition of default / treatment of rescheduling, in the wake of the pandemic9. I.2.3 Banking System – Liquidity Profile 1.39 In view of the comfortable liquidity situation in the system, it is useful to evaluate the adequacy of unencumbered high-quality liquid assets (HQLA) for meeting short term liquidity under a significantly severe liquidity stress scenario. This is reflected in the movement of the liquidity coverage ratio (LCR) across bank groups, while recognising that the negative carry engendered by deployment of available deposits in HQLA can potentially strain the future profitability of banks (Table 1.4). | Table 1.4: LCR Profiles across Bank Groups | | (Per cent) | | Bank Group Name | Liquidity Coverage Ratio (LCR) | | 31-Mar-20 | 30-Jun-20 | 30-Sep-20 | | Public Sector Banks | 148.64 | 162.34 | 181.83 | | Private Sector Banks | Aggregate | 130.65 | 144.42 | 148.35 | | Old Private Sector Banks | 218.1 | 231.89 | 261.05 | | New Private Sector Banks | 123.18 | 136.64 | 139.15 | | Foreign Bank Group | 175.17 | 179.32 | 201.32 | | Source: RBI Supervisory Returns. |
I.2.4 Banking System – Wholesale Credit 1.40 The profile of wholesale credit in H1:2020-21 and in Q3:2020-21 (upto November) reflects a subdued credit situation across bank groups, pointing to risk aversion and muted demand weighing on the outlook (Table 1.5). With the onset of COVID-19, retail credit growth (y-o-y) has suffered, while wholesale credit growth has held up though at low levels (Chart 1.40). With stress tests pointing to a deterioration in asset quality of banks, early identification of impairment and aggressive capitalisation is imperative for supporting credit growth across various sectors alongside pre-emptive strategies for dealing with potential NPAs. Table 1.5: Growth in Wholesale Credit
(q-o-q unless specified otherwise, per cent) | | | Sep-19 | Dec-19 | Mar-20 | Jun-20 | Sep-20 | Nov-20* | | PSBs | -0.53 | -1.08 | 7.26 | -1.51 | -2.54 | -2.40 | | PVBs | 3.38 | 0.92 | 1.27 | -0.68 | 0.94 | -1.28 | | All SCBs | 0.67 | -0.53 | 5.85 | -0.97 | -1.67 | -1.36 | Note:*Growth over September 2020.
Source: CRILC and RBI staff calculations. | 1.41 For the purpose of wholesale credit analysis in paras 1.41-1.44, funded amount outstanding of companies (which account for about 88 per cent of the total funded amount outstanding to wholesale obligors) has been considered as opposed to other organisational forms such as cooperatives, partnerships, trusts and societies. Credit growth in respect of public sector undertakings (PSUs) was comparatively resilient during the pandemic, although the aggregate PSU credit exposure declined between March-September, 2020. The market capitalisation of central public sector enterprises (CPSEs) has, however, fallen in an otherwise bullish equity market, implying muted market expectations about value creation through the PSU channel (Table 1.6 and Chart 1.41). 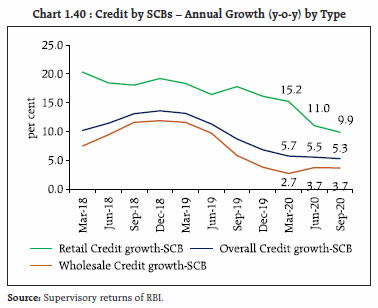
| Table 1.6: Disaggregated Wholesale Credit Growth based on Ownership (q-o-q, unless mentioned otherwise) | | (per cent) | | | Non-PSU | PSU | | Dec-19 | Mar-20 | Jun-20 | Sep-20 | Nov-20 * | Dec-19 | Mar-20 | Jun-20 | Sep-20 | Nov-20 * | | PSBs | -2.5 | 1.0 | -1.7 | -2.4 | -1.5 | 1.6 | 21.5 | -2.4 | -3.7 | -1.7 | | PVBs | -0.7 | -0.9 | -3.0 | -1.5 | -3.7 | 14.0 | 29.4 | 16.2 | 13.5 | 2.6 | | PSBs+PVBs | -1.8 | 0.2 | -2.2 | -2.0 | -2.4 | 2.9 | 22.3 | -0.3 | -1.4 | -1.0 | Note: *Growth over September 2020.
Source: CRILC and RBI staff calculations. |
| Table 1.7: Disaggregated Wholesale Credit Growth in Non-PSU obligors (q-o-q) | | (per cent) | | | PVBs | PSBs | | Dec-19 | Mar-20 | Jun-20 | Sep-20 | Nov-20 * | Dec-19 | Mar-20 | Jun-20 | Sep-20 | Nov-20 * | | AA and above | -0.43 | 5.21 | -2.55 | -5.86 | -7.48 | 0.19 | 7.68 | -5.22 | -6.70 | 0.05 | | Other Investment Grade | 0.16 | -5.00 | -4.26 | -1.66 | -4.03 | 1.42 | -0.03 | 3.07 | -1.15 | -6.47 | | Below Investment Grade | -2.13 | 2.34 | -1.49 | 3.83 | -0.30 | -7.42 | -5.00 | -0.74 | 2.90 | 0.02 | | Unrated/NA | -1.22 | -4.80 | -2.88 | 0.88 | -1.18 | -3.51 | -0.11 | -2.45 | -3.40 | -0.10 | Note: *Growth over September 2020.
Source: CRILC, Prime Database and RBI staff calculations. | 1.42 An analysis of wholesale credit flows, based on rating grades of non-PSU obligors, reveals sharp deleveraging (q-o-q) at rating grades ‘AA and above’ during 2020-21, across both PSBs and PVBs. This reflects a reversal from the position in March 2020 when a rush to access credit was observed in the early phase of the pandemic breakout (Table 1.7). 1.43 A size-wise disaggregation of wholesale credit growth points to deleveraging by large wholesale borrowers even as relatively smaller borrowers (loans size: ₹5 - ₹100 crore) continued to record sustained credit appetite (Chart 1.42). 1.44 An examination of the transition of a constant sample of non-PSU non-financial wholesale performing exposures to SMA status10 between August and November 2020 reveals accumulation of outstanding in SMA-0/1/2 categories, although the aggregate outstanding has remained flat (Table-1.8-1.9). A similar accumulation of exposure is seen when gross outstanding at every SMA cohort is compared between August and November 2020 (Chart 1.43). Admittedly, the asset classification standstill inhibits the true underlying economic categorisation of assets, although the incipient tilt is towards worsening as indicated by the growth in balances in the next worse categories for each cohort.
1.45 An analysis of sectoral credit growth11, specifically to those that are critical in terms of gross value added (GVA), shows resilient flows to sectors such as construction, trade and hospitality, while bank credit remained muted to the manufacturing sector (Table 1.10).
| Table 1.8: SMA Transition Matrix for Wholesale Portfolio of a Constant Sample of Non-PSU Non-financial Obligors between August and September 2020 | | (in per cent) | | | Outstanding as on August 31, 2020
(₹ crore) | Growth in exposure over August 2020 | September 30, 2020 | | Proportion of assets in various cohorts | | 0 dpd | SMA-0 | SMA-1 | SMA-2 | NPA | | Standard (0 dpd) | 20,58,349.02 | 1.02 | 87.3 | 10.1 | 2.3 | 0.2 | 0.1 | | SMA-0 | 85,385.41 | -0.34 | 45.4 | 38.9 | 14.7 | 1.0 | 0.0 | | SMA-1 | 54,707.60 | -0.36 | 24.5 | 34.3 | 23.1 | 18.1 | 0.0 | | SMA-2 | 40,862.33 | 0.60 | 21.9 | 14.7 | 3.6 | 57.7 | 2.1 | | Total | 22,39,304.36 | 0.93 | 83.1 | 11.8 | 3.3 | 1.7 | 0.1 | Note: Data as on November 2020 is provisional and not audited.
Source: CRILC and RBI staff calculations. |
| Table 1.9: SMA Transition Matrix for Wholesale Portfolio of a Constant Sample of Non-PSU Non-financial Obligors between August and November 2020 | | (in per cent) | | Status as on August 31, 2020 | Growth in exposure over September 2020 | November 30, 2020 | | Proportion of assets in various cohorts | | 0 dpd | SMA-0 | SMA-1 | SMA-2 | NPA | | Standard (0 dpd) | -2.55 | 85.7 | 6.5 | 2.9 | 4.8 | 0.1 | | SMA-0 | 0.76 | 59.2 | 22.9 | 6.3 | 11.5 | 0.2 | | SMA-1 | -1.37 | 24.9 | 21.1 | 10.0 | 43.9 | 0.1 | | SMA-2 | 0.46 | 17.0 | 6.0 | 5.9 | 65.0 | 6.2 | | Total | -2.34 | 81.9 | 7.5 | 3.3 | 7.2 | 0.2 | Note: Data as on August 2020 and November 2020 is provisional and not audited.
Source: CRILC and RBI staff calculations. |
| Table 1.10: Sectoral Credit Growth | | Economic Sector * | Share in Gross Value Added (GVA)
(per cent) | Credit growth (y-o-y) (per cent) | | Mar-20 | Jun-20 | Aug-20 | Sep-20 | Oct-20 | | Agriculture, forestry and fishing | 15.8 | 4.2 | 2.4 | 4.9 | 5.9 | 7.4 | | Mining and quarrying | 3.2 | 5.2 | 4.3 | 1.2 | 0 | 4.3 | | Manufacturing | 19.1 | 0.9 | 0.8 | -0.8 | -1.0 | -2.0 | | Electricity, gas, water supply & other utility services | 2.3 | -1.6 | 0.9 | -1.8 | -0.9 | -1.3 | | Construction | 8.5 | 4.8 | 5.6 | 8.1 | 4.5 | 5.1 | | Trade, repair, hotels and restaurants | 13.4 | 5.5 | 6.9 | 12.9 | 12.1 | 13.9 | | Transport, storage, communication & services related to broadcasting | 6.9 | 1.9 | 6.8 | 5.8 | 3.5 | -0.8 | | Financial Services # | 6.4 | 25.9 | 25.7 | 17.1 | 12.5 | 9.2 | | Real estate, ownership of dwelling & professional services | 16.8 | 13.8 | 11.4 | 9.7 | 7.4 | 7.3 | | Other Services | 7.7 | -8.1 | 1.6 | -2.0 | 7.0 | 10.5 | Note: 1. * Covering the sectors in national accounts other than ‘public administration and defence’.
2. # Represents bank credit to the non-bank financial sector.
Source: National Accounts Statistics, MoSPI and RBI Supervisory Returns. | I.2.5 Consumer Credit12 1.46 Consumer credit has shown significant growth in recent years, especially for PVBs. In these banks, a surge in the consumer credit portfolio has contributed to increasing their share in the credit market. The overall demand for consumer credit as reflected in inquiry volumes13, however, remains depressed since the onset of the pandemic. PSBs’ activity in the sector has increased considerably (Table 1.11). The approval rates were low during Q1:2020-21 but they have improved subsequently, especially for PSBs (Chart 1.44). Inquiry volumes by risk tier also show a distinct improvement in favour of better rated consumers (Chart 1.45). Nevertheless, the growth in overall loan balances has moderated considerably after March 2020 (Table-1.12). The 90 days past due (90+ DPD) position has remained stable but may not reflect the real vulnerability of the portfolio, in view of the regulatory reliefs granted following the pandemic. Table 1.11: Growth in Inquiry volume
(y-o-y, per cent) | | | Dec-19 | Mar-20 | Jun-20 | Sep-20 | Dec-20 | | Overall | 36 | -4 | -34 | -21 | -14 | | PSBs | 20 | -8 | 37 | 20 | 5 | | PVBs | 26 | -21 | -45 | -13 | -10 | | NBFCs/HFCs | 47 | 6 | -42 | -37 | -25 | | Source: TransUnion CIBIL |
I.2.6 Bank Credit to MSME Sector 1.47 In sharp contrast to consumer credit, the MSME14 sector reflected robust growth in inquiry volumes except during Q1:2020-21 but the growth (y-o-y) in balances remained sluggish (Tables 1.13 and 1.14), with pullback in terms of balances outstanding seen in cases of PSBs and NBFCs. Further, over 90 days past due balances indicate much higher overdue levels than in the retail sector, even with the camouflages of regulatory reliefs. Table 1.12: Growth in Consumer Credit
(y-o-y, per cent) | | | Sep-19 | Dec-19 | Mar-20 | Jun-20 | Sep-20 | | Growth in Balances | 16.5 | 17.3 | 13.5 | 7.1 | 5.1 | | Growth in Origination Volumes | 46.9 | 48.5 | -5.4 | -28.0 | -9.9 | | Balance level 90+ DPD % | 3.2 | 3.3 | 3.2 | 3.4 | 3.5 | Note: It is a composite consumer credit number aggregated across PSBs. PVBs,NBFCs/HFCs and Fin-Tech.
Source: TransUnion CIBIL. |
Table 1.13: Volume of Inquiries for MSME Credit
(y-o-y, per cent) | | | Nov-19 | Feb-20 | May-20 | Aug-20 | Nov-20 | | Overall | 26.4 | 21.6 | -43.1 | 12.3 | 2.8 | | PSB | 49.8 | 26.3 | -1.6 | 24.7 | -2.0 | | PVB | 36.3 | 18.2 | -55.8 | 0.5 | 14.0 | | NBFC & FinTech | 47.8 | 31.0 | -85.4 | 18.0 | -20.2 | Note: MSME exposure aggregated across PSBs, PVBs, NBFCs/HFCs and FinTech.
Source: TransUnion CIBIL. |
Table 1.14: Activity in MSME sector
(y-o-y, per cent) | | | Sep-19 | Dec-19 | Mar-20 | Jun-20 | Sep-20 | | Growth in Balances | 5.6 | 4.3 | 0.7 | 0.4 | -2.3 | | Balance level 90+ DPD % | 11.8 | 11.8 | 11.7 | 12.5 | 12.0 | | Source: TransUnion CIBIL. | I.2.7 Banking Stability Indicator 1.48 By September 2020, the banking stability indicator (BSI)15 showed improvement in all its five dimensions (viz., asset quality; profitability; liquidity; efficiency; and soundness) that are considered for assessing the changes in underlying financial conditions and risks relative to their position in March 2020 (Chart 1.46). This improvement reflects the regulatory reliefs and standstills in asset classification mentioned earlier and hence may not reflect the true underlying configuration of risks in various dimensions. I.2.8 Developments in Non-banking Financial Intermediation 1.49 During the period April – November 2020, mutual fund schemes witnessed net inflows of ₹2.73 lakh crore and assets under management (AUM) grew at 17.73 per cent in the same period. As alluded to in the July 2020 Financial Stability Report (FSR), due to lack of liquidity in debt markets, mutual funds (MFs) as key financial intermediaries in the non-banking space have faced heightened redemption pressures during Q1:2020-21 (Table 1.15). The Reserve Bank’s special liquidity window for MFs provided a large measure of relief and eased liquidity stress for the sector. Thereafter, strong rallies in equity markets coupled with favourable liquidity conditions have renewed optimism in the investor outlook for MFs. The normalised debt fund net asset values (NAVs) of various categories, which showed a sharp dip in March-April, 2020 in the wake of redemption pressure from debt funds have also normalised reflecting restoration of orderly market conditions (Chart 1.47). 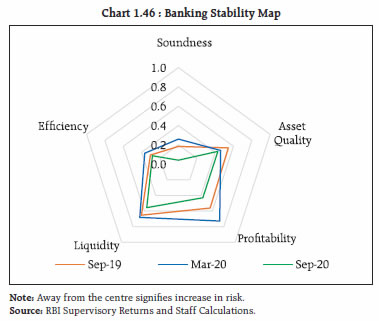
| Table 1.15: Trends in Resource Mobilisation by Mutual Funds | | (₹ crore) | | | Q1:2020-21 | Q2:2020-21 | Oct-20 | Nov-20 | | Gross Mobilisation | 26,47,640 | 19,33,575 | 6,43,237 | 5,66,379 | | Redemption | 25,23,561 | 19,10,407 | 5,44,661 | 5,39,185 | | Net Inflow/ Outflow | 1,24,079 | 23,168 | 98,576 | 27,194 | | Assets at the end of Period | 25,48,848 | 26,85,982 | 28,22,941 | 30,00,904 | | Source: SEBI. |
1.50 The average assets under management (AUM) of Money Market Mutual Funds (MMMFs) have expanded in line with system-level liquidity (Chart 1.48). Excess returns of MMMFs have started to normalise after turning negative in the previous quarter (Chart 1.49) reflecting increased proportion of liquid assets in their investment corpus. The share of liquid assets in debt mutual funds’ portfolios has surged since March 2020 and constitutes 39 per cent of the aggregate AUM by end-November 2020, reflecting precautionary allocations (Chart 1.50). 1.51 Liquidity support from Reserve Bank has ensured orderly functioning of both the commercial paper (CP) and non-convertible debenture (NCD) markets, with large issuances relative to a year ago and a substantial narrowing of spreads across rating categories. As a result, CP outstanding for non-PSU obligors has increased sizably (Charts 1.51 and 1.52).
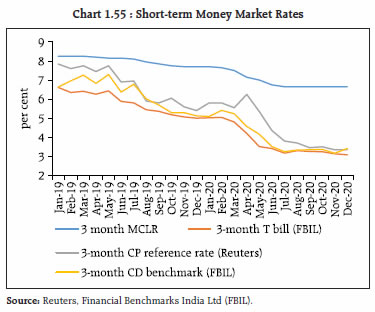
1.52 Ratings dispersion of CPs versus NCDs shows a more varied rating profiles. The relative share of NCD issuances by the ‘AAA’ rated cohort has sharply declined in H2:2020-21 (till November) (Charts 1.53 and 1.54). Near-term maturities in respect of CPs and NCDs show a wide dispersion across rating grades, although maturities in respect of higher ratings dominate (Table 1.16). 1.53 A sharp decline in money market rates specifically since April 2020, has opened up a significant wedge between the marginal cost of fund-based lending rate (MCLR) benchmark of banks17 and money market rates of corresponding tenor (Chart 1.55). Expensive bank finance may lead to more credit worthy borrowers with access to money markets shifting away from bank based working capital finance. Such disintermediation of better-quality borrowers from banking channels have implications for banking sector interest income and credit risk. 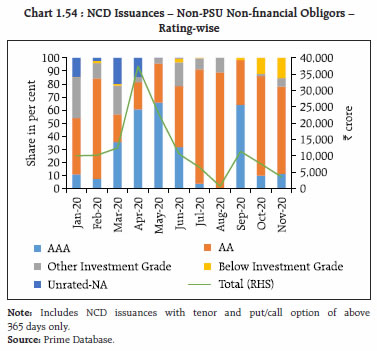
| Table 1.16: Issuances and Near-term Maturities of CPs and NCDs of Non-PSU Non-financial Obligors | | (₹ crore) | | | Issuances | Maturing | | Sep-20 | Oct-20 | Nov-20 | Dec-20 | Jan-21 | Feb-21 | Mar-21 | Apr-21 | May-21 | Jun-21 | | AAA | 16,450.0 | 10,300.0 | 24,155.0 | 23,769.1 | 12,858.0 | 10,008.0 | 10,081.6 | 1,004.4 | 1,000.0 | 6,531.7 | | AA | 24,545.1 | 26,756.0 | 13,385.0 | 20,059.7 | 8,214.4 | 8,018.0 | 8,642.3 | 10,350.0 | 1,739.1 | 7,260.0 | | Others | 2,689.0 | 2,493.3 | 2,767.3 | 8,111.6 | 1,486.5 | 5,477.0 | 3,403.4 | 7,460.7 | 3,900.0 | 4,711.2 | | Unrated/NA | 7,678.0 | 2,525.0 | 111.0 | 4,589.8 | 1,288.6 | 1,032.3 | 7,557.6 | 1,926.4 | 681.0 | 1,741.0 | | Total | 51,362.1 | 42,074.3 | 40,418.3 | 56,530.2 | 23,847.5 | 24,535.3 | 29,684.9 | 20,741.5 | 7,320.1 | 20,243.9 | Note: 1) Data on NCDs Includes private debt placements from April 2013 onwards with tenor and put/call option of above 365 days.
2) Rating for maturity profile reflects outstanding ratings as on November 2020.
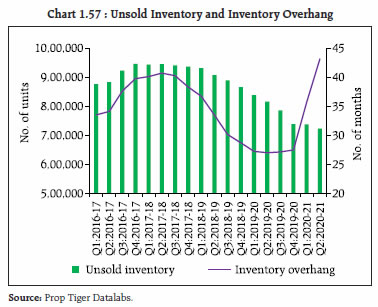
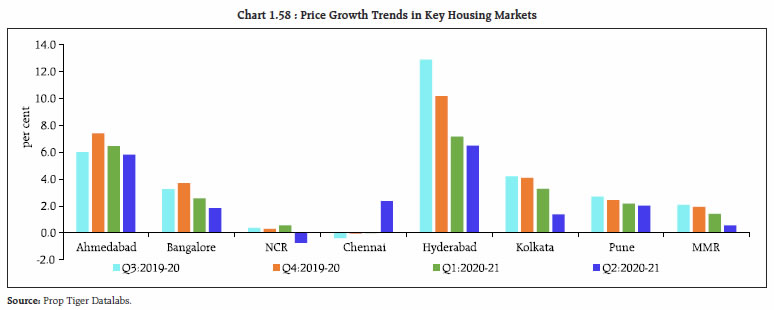
Source: Prime Database. | I.2.9 Housing Market 1.54 With the phased unlocking of the economy and various measures to aid revival, the Indian real estate market appears to be emerging from COVID-19-induced disruptions. The housing market is gradually rebalancing and recovering from the trough into which it had plunged in Q1: 2020-21. New units launched and residential units sold across the top eight cities reflected clear recoveries in Q2:2020-21 and in Q3 so far, relative to the previous quarter (Chart 1.56). 1.55 The uptick in sales in Q2:2020-21 resulted in a decline in unsold inventory, though the inventory overhang (i.e., average number of months required to sell unsold houses) increased sharply in the wake of the pandemic (Chart 1.57). Under-construction units constituted about 70 per cent of the sales in Q2:20-21 and 81 per cent of the unsold inventory. Sluggish sales have restrained developers from increasing prices in major cities (Chart 1.58). I.2.10 Systemic Risk Survey18 1.56 In the latest systemic risk survey (SRS) of October/November 2020, respondents rated select institutional risks as ‘high’ whereas global risks, macroeconomic risks and financial market risks were perceived as ‘medium’. This represented a clear shift from the previous round of the survey held during April/May 2020 in which all these groups were rated as ‘high’ risk. Also, unlike in the previous round of the survey, in which risks to economic growth (global and domestic) and to the fiscal deficit were assessed as ‘very high’, none of the risks were categorised ‘very high’ by the participants in the current round. The ‘high’ risk components among the risk groups other than the institutional risks include global growth, domestic growth, domestic inflation, fiscal deficit, corporate sector vulnerabilities, pace of infrastructure development and equity price volatility. 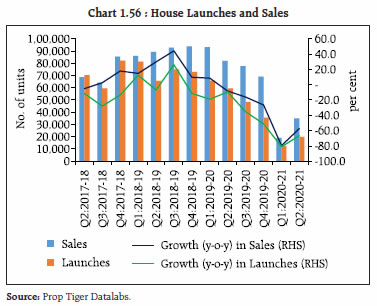
 1.57 Nearly one third of the respondents opined that the prospects of the Indian banking sector are going to ‘deteriorate marginally’ in the next one year as earnings of the banking industry may be negatively impacted due to slow recovery post lockdown, lower net interest margins, elevated asset quality concerns and a possible increase in provisioning requirements. On the other hand, about one fourth of the respondents felt that the prospects are going to improve marginally. 1.58 The overall responses indicate a positive turn to the outlook relative to the last round of the survey. Summary and Outlook 1.59 Since the publication of the Financial Stability Report (FSR) of July 2020, there is a much better assessment of the spread and depth of COVID-19 risks and their broader impact on global and domestic economic conditions. Although there has been rapid recovery in economic activity from the lows of March and April, major non-financial indicators remain below pre-pandemic levels. 1.60 The adverse impact on government revenue and the resultant increase in sovereign borrowing in a period when fiscal authorities are also required to provide stimulus to economic growth, is increasing sovereign debt to levels that have intensified concerns relating to sustainability with crowding out fears in respect of the private sector in terms of both volume of financing and costs thereof. 1.61 The growing disconnect between certain segments of financial markets and real sector activity, pointed out in the last FSR, has got further accentuated during the interregnum, with abundant liquidity spurring a reach for returns. Within the financial market spectrum too, the divergence in expectations in the equity market and in the debt market has grown, both globally and in India. 1.62 Domestically, corporate funding has been cushioned by policy measures and the loan moratorium announced in the face of the pandemic, but stresses would be visible with a lag. This has implications for the banking sector as corporate and banking sector vulnerabilities are interlinked. While the post-global financial crisis (GFC) prudential measures have ensured stronger capital buffers in the banking sector, which have stood banks in good stead in the face of the pandemic, the imminent crystallisation of financial stress may test their resilience, especially for individual banks which, in turn, can have systemic implications. Banks need to prepare for these adversities by augmenting their capital bases to support their own business plans and the broader economic recovery process in the post-COVID period. Moreover, while easy financial conditions are intended to support growth prospects they can have unintended consequences in terms of encouraging leverage, inflating asset prices and fuelling threats to financial stability. The pandemic has altered behaviour and business models fundamentally. Policy authorities are striving to stay ahead by designing suitable responses.
|