Global economic activity remained resilient during Q4:2024 amidst fragile confidence and rising protectionism. In India, the slack in speed observed in the second quarter of 2024-25 is behind us as private consumption is back to being the driver of domestic demand with festival spending lighting up real activity in Q3. Domestic financial markets are seeing corrections with relentless hardening of the US dollar and equities being under pressure from persistent portfolio outflows. The medium-term outlook remains bullish as the innate strength of the macro-fundamentals reasserts itself. Headline consumer price index (CPI) inflation rose above the upper tolerance band in October 2024 with a sharp surge in the momentum of food prices along with an increase in core inflation. Introduction As the world’s finance ministers and central bank governors converged to Washington D.C. for the annual meeting of the International Monetary Fund (IMF) and the World Bank in late October 2024, slowing inflation and the easing of cyclical imbalances have been clearing the path for a soft landing of the global economy. Economists believe that a steepening of the Phillips curve has allowed inflation to fall faster than expected while enabling the surprisingly strong performance of output. Recent high frequency indicators suggest that global economic activity moderated a little during the fourth quarter of 2024 so far within a broadly unchanged outlook. Purchasing managers’ indices (PMIs) of manufacturing activity contracted in several advanced economies (AEs), while services remained on a firmer footing. Among emerging market economies, PMIs are emitting mixed signals. For Asia, growth has gained strength relative to expectations, with a tech-driven uptick in exports. Despite this robust performance, the IMF assesses that risks to the Asian outlook have increased, mainly due to the weaker external environment and adverse demographics. Inflation has continued to decline and is projected to reach targets by 2025 in many jurisdictions. Headline inflation in EMEs has been broadly steady or retreating in Asia, but it remains above target in Latin America as services price increases have been persistently stronger than their pre-pandemic averages. Yet, soaring debt levels – public debt is set to reach US$ 100 trillion this year, driven by the two largest economies of the world – darken the outlook. The IMF expects that future debt levels could be higher than currently projected. In its view, the political discourse on fiscal issues has increasingly tilted toward higher government spending in recent decades. Fiscal policy uncertainty has increased, and political redlines on taxation have become more entrenched. Spending pressures to address green transitions, population aging, security concerns, and long-standing development challenges are mounting. Alongside the ticking time bomb of indebtedness, potential spillovers and widening wars are shifting the fault lines of the global economy. As a consequence, the level of uncertainty surrounding the outlook is elevated. Anxieties run high about the possibility of adverse swings in trade and fiscal policies. The return of financial market volatility has stirred up old fears about hidden vulnerabilities and widened sovereign borrowing spreads for some emerging market and developing economies. As discussed in Section II, global growth is expected to be stable but below par despite its resilience, with still high borrowing costs holding back private credit and investment. Fiscal consolidation, if embarked upon, will likely slow down growth in the initial years, but yield long term positive outcomes. Although world trade has remained steady so far and stability in freight markets is reviving logistics deal making, a more fragmented global trade landscape could reduce the resilience of global supply chains that have so far held up in the face of geopolitical tensions. Moreover, as protectionism grows, the flows of capital are stymied. Accordingly, an outlook of weak global growth extends into the medium-term, suggesting that potential output has been durably affected. Emerging and developing economies are showing more permanent scars. “The global economy is in danger of getting stuck on a low growth, high debt path. That means lower income and fewer jobs.”1 Near-term financial stability risks remain contained and global financial conditions are accommodative. Long-term government yields increased on stronger US economic data and the US dollar has appreciated from its recent low in September. Alongside buoyant equity markets barring pre-US election volatility, credit market conditions remain benign, and spreads have narrowed further to be very tight relative to pre-pandemic averages. Valuations are, however, elevated relative to earnings performance and the use of leverage, especially among nonbank financial intermediaries, has increased with the rising probability of volatility catching up with uncertainty. As the US elections moved to a clear outcome, major stock markets rallied around the world, US bond yields jumped, and the US dollar recorded its biggest one-day jump since 2020, going even higher in subsequent days of trading. Fears of fiercer trade wars hung over the outlook on tariff proposals and potential retaliation – the IMF cautioned in its World Economic Outlook that higher tariffs could wipe out 0.8 per cent of output in 2025 and 1.3 per cent in 2026. Wilting in the face of the surging US dollar, emerging market currencies from Asia to Latin America weakened to new lows, and they braced for a fresh round of stimulus from China after the US election results, but the announcements turned out to be underwhelming and hence more is being expected. After hitting record highs recently, including on account of pre-election sell-offs in US Treasuries, gold prices plunged under the pressure of a surging US dollar while copper prices yielded to steep losses in the Chinese yuan. The record-breaking rally in Bitcoin hinted at an imminent risk-on rotation across derivatives going forward. Will the euphoria outlive the Trump trade that has sent traders scrambling to redraw their expectations of the path of interest rates? The Fed’s second interest rate cut of the year was largely priced in – equities and the US dollar eased a bit, and bonds rose. Swap markets indicate that there is a significant possibility of the Fed holding rates unchanged in the remaining part of the year, especially with October’s US inflation print ticking up. Ahead of all these events, crude prices gained after OPEC plus pushed back the planned increase in production by a month, signalling caution amidst widespread concerns over weaker global demand even though the geopolitical risk premium has recently softened. Overall, a fragile confidence, and a possible lurch towards protectionism hinders a full-on global recovery. In India, it appears that the slack in speed observed in the second quarter of 2024-25 is behind us. Private investment is lacklustre as reflected in sequentially lower investment in fixed and non-current assets during July-September 2024 on account of subdued corporate earnings. Yet moderation in staff cost growth and rise in non-operating income boosted net profits even after excluding the moribund oil and gas sector and the high performing financial services sector. Private consumption is back to being the driver of domestic demand, although with mixed fortunes. Festival spending has lighted up real activity in the third quarter, as pointed out in Section III which tracks high-frequency indicators to generate nowcasts of real gross domestic product (GDP). Footfalls in malls may be low but e-commerce is burgeoning with a variety of marketing strategies and brand recall initiatives to catch the attention of generation Z. FMCG and auto companies have been stepping up ad spends to revive demand. Rural India is emerging as a gold mine for e-commerce companies in this festival season; this is expected to gather further momentum with the sharp increase in kharif output and optimism around rabi production emboldening a record foodgrains target for 2024-25. Direct-to-consumer (D2C) brands are scrambling for funds to expand their presence and increase sales through quick-commerce (q-com) platforms – an eco-system valued at over US$ 5 billion and projected to reach US$ 30 billion by 2029-30.2 Retailers are reporting a pick-up in sales growth relative to the second quarter. E-two wheelers sparkled this Diwali, although there is a distinct premiumisation that has gained further ground, as vividly evident in the luxury car segment. New cities are rising across the country with the urban population surging fourfold – by 2025, half of India’s population is expected to live in cities, boosting urban demand. All that is needed is get inflation down so that India reconnects with its potential.3 The October CPI inflation reading turned out to be a sticker shock after the wake-up call of September’s spike, reinforcing the RBI’s warnings on complacency due to sub-target outcomes for July and August. What is worrying is that apart from the sharp surge in the momentum of food prices, core inflation has edged up. There are early signs of second order effects or spill overs of high primary food prices - following the surge in prices of edible oils, inflation in respect of processed food prices is starting to see an uptick. The pick-up in price rises of household services like those of domestic helps/cooks also reflects higher cost of living pressures due to elevated food prices beginning to transmit to these specific wages.4 In this environment, the hardening of input costs across goods and services and their flow into selling prices needs to be watched carefully, as analysed in Section III. Inflation is already biting into urban consumption demand and corporates’ earnings and capex. If allowed to run unchecked, it can undermine the prospects of the real economy, especially industry and exports. The outlook for India’s exports is brightening, as Section III elaborates. Underneath the subdued growth profile of the past few months, India has been gaining share in global trade of key manufacturing items. In fact, India currently holds 13 per cent or a sixth of the global market share in petroleum products, attesting to rising refining capabilities and ability to meet international standards. It is the largest exporter of precious and semi-precious stones, the third largest exporter of insecticides, the eighth largest in rubber pneumatic tyres, and ninth in semiconductors. In the first half of 2024-25, Apple exported close to US $6 billion of India-made iPhones, while automobile exports expanded by 14.3 per cent, led by passenger vehicles and two-wheelers. Export restrictions on several items have been lifted. Efforts are being intensified to expand the number of geographical indication (GI) products to scale up overall exports and secure premium pricing in global markets. Already, more than 1100 GI products are registered under the one-district-one-product (ODOP) scheme, with 640 of them being exported out of a global total of close to 70,000 GI products.5 There is some urgency gathering around evolving a standardised approach to negotiating free trade agreements (FTAs) to address rules of origin and nontariff barriers. A panoply of bilateral agreements will enable India to capitalise on the ‘China plus one’ trend in global manufacturing. The key is to improve market access – over the last five years, it is estimated that India’s total imports from FTA partners (ASEAN, the UAE, SAFTA, Australia, South Korea, Japan, Mauritius) increased by 37.9 per cent while exports grew only 14.5 per cent.6 India is undergoing a quiet transformation in its logistics for maritime trade which accounts for 95 per cent of India’s trade by volume and 65 per cent by value. Port capacity has more than doubled over the past ten years from 745 million tonnes to over 1,600 million tonnes. Traffic at major ports has jumped by close to 50 per cent. Turnaround time has fallen from 127 hours in 2010 to 53 hours more recently, with only 21 hours in Jawaharlal Nehru Port Trust (JNPT) at Nhava Sheva. Over this period, India’s position in the World Bank’s logistics performance index has risen from 54th to 38th. India is planning a major transhipment hub at Galathea Bay in the Nicobar Islands which is located on one of the most important shipping routes. A new mega port is also planned at Vadhvan.7 Alongside quadrupling port capacity, India needs to aim at becoming a leading ship builder, develop world class connectivity with the hinterland and rationalise processes so that imports and exports sit less at docks. A step-up in air cargo is also warranted to take advantage of the surge amidst the Red Sea crisis. Domestic financial markets are seeing corrections. The relentless hardening of the US dollar has imposed downward pressures on all other currencies, with the Indian rupee also reflecting downside from both political and geopolitical developments, but the medium-term outlook remains bullish as global turbulence subsides and the innate strength of the macro-fundamentals reasserts itself. In the recent period, there has been some discussion on the exchange rate of the INR, especially some discontent on its relative stability historically and in relation to peers. As Box 2 explains, the level of the INR is determined by market forces of demand and supply which, in the ultimate analysis, reflect the state of the underlying macro-fundamentals of the Indian economy. Interventions in the forex market smooth undue volatility so that the market clears in an orderly manner. This is important in a time when global economic uncertainty is unprecedentedly high amidst persisting geopolitical tensions, divergent monetary policy pathways, geoeconomic fragmentation, and political spillovers, among other overlapping crises. Currency markets worldwide have become conduits for the propagation of these global shocks to domestic economic activity. By imparting stability to the INR, the economy remains relatively insulated from multiple global spillovers and attendant financial stability risks. Box 2 also describes how this approach of buffering the economy has enabled the innate strength of India’s fundamentals to be built up in a hostile and highly uncertain international environment. In the credit market, non-banking financial companies, including microfinance institutions have drawn regulatory attention on account of exorbitant interest rates charged on loans. Several private banks are reported to be experiencing stress in small ticket advances, credit cards and personal loans, with a rise in over-leveraged clients as well as in provisioning. More generally, banks have circumspectly reined in lending to retail and services. On the other hand, they have grown credit to industry – small, medium and large – strongly, reflecting the buoyancy in the underlying growth momentum of Indian industry. Overall, a better balance is emerging between deposit and credit growth, with the incremental credit-deposit ratio falling to more normal levels from stratospheric heights earlier. In spite of sustained selling by foreign institutional investors, equity markets are gearing up for a fresh rally on domestic support, especially for key mutual fund equity schemes. The rally in Indian mid-cap and small-cap indices thus far in 2024 is the best in the world, despite some corrections triggered by valuation concerns. Funding by private equity and venture capital has been picking up on a few large ticket deals, undeterred by the sell-off by foreign institutional investors. This October and the first half of November registered as the warmest on record in India, according to the India Meteorological Department. The likelihood of La Nina and the periodic cooling of sea surface temperature is now pushed out to the end of December, indicating a cooler winter. Nevertheless, efforts towards arresting climate change are showing up. There has been an ebullient growth in rooftop solar capacity, with the target of adding 30 giga watts by 2027, supported by the PM-Surya Ghar Muft Bijli Yojana. India has been re-elected as president of the International Solar Alliance in recognition of the progress made towards a cleaner and more sustainable path of growth. Despite challenges, India’s wind energy sector is expected to add 4.5-5.0 giga watts this year, with potential annual installations reaching 10 GW in 2026. 70-80 per cent of installed wind capacity is localised. Long-term power purchase contracts by discoms have de-risked investments by private developers in renewables. The need of the hour is to invest in storage. Set against this backdrop, the remainder of the article is structured into four sections. Section II covers the rapidly evolving developments in the global economy. An assessment of domestic macroeconomic conditions is set out in Section III. Section IV encapsulates financial conditions in India, while the last Section sets out concluding remarks. II. Global Setting The global economy remains resilient despite ongoing geopolitical uncertainty, albeit with a diverging growth outlook across geographies. Monetary policy normalisation is driving policy action in AEs even though the pace of disinflation remains uneven in many countries. In its October 2024 World Economic Outlook update, the IMF maintained its projection of global growth at 3.2 per cent for 2024, the same as in July (Chart II.1). The growth projection for 2025, however, was reduced by 10 basis points (bps) to 3.2 per cent due to downward revision in the outlook for emerging market and developing economies (EMDEs) as extreme weather events and supply disruptions are likely to take a toll on their output. Global headline inflation is projected to decline from an annual average of 6.7 per cent in 2023 to 5.8 per cent in 2024 and further to 4.3 per cent in 2025, with AEs expected to return inflation to targets sooner than EMDEs. Our model-based nowcast of global GDP indicates some slackening of momentum in Q3:2024 and Q4:2024, weighed down by heightened geopolitical risks (Chart II.2).
The global supply chain pressures index (GSCPI) eased for the second month in a row in October 2024, and dropped below its historical average (Chart II.3a). Supply disruptions have kept container shipping costs elevated, although they recorded some moderation during September-October 2024 (Chart II.3b). Geopolitical risks rose in October due to escalation of tensions in the Middle East, reversing the moderation observed since mid-July (Chart II.3c).
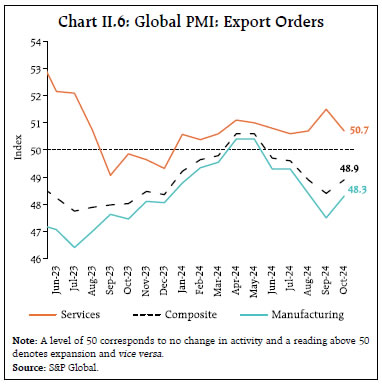
In October 2024, consumer confidence improved in the US, Euro area and India but worsened in the UK (Chart II.4a). Financial conditions eased in major AEs and EMEs (Chart II.4b). The global composite purchasing managers’ index (PMI) increased in October from an eight-month low recorded in September and remained in the expansionary zone for the twelfth consecutive month (Chart II.5). A robust revival in services acitivity with expansion in output across business, consumer and financial services offset the sluggish performance in manufacturing. The global manufacturing PMI remained below the neutral mark in October for the fourth month in a row due to contraction in new orders, employment growth and stocks of purchases. The composite PMI for export orders rose in October, but it has remained in contractionary zone since June 2024 as the decline in manufacturing exports more than offset the increase in services exports. On a sequential basis, however, manufacturing export orders witnssed a lower magnitude of contraction while services export orders decelerated (Chart II.6). Global commodity prices softened in October as the gains in energy prices were offset by declines in metal prices. The Bloomberg commodity index fell by 2.2 per cent (m-o-m) in October (Chart II.7a). The Food and Agriculture Organization’s (FAO’s) food price index recorded a 2.0 per cent (m-o-m) increase in October, with prices rising across all categories except meat; a particularly sharp uptick was observed in vegetable prices (Chart II.7b). Metal prices declined in October and early November as demand from China, the world’s largest consumer of base metals, decreased in response to stimulus measures failing to meet expectations. Gold prices increased by 4.6 per cent (m-o-m) in October, surpassing the US$ 2700 mark for the first time on account of safe-haven demand amidst uncertainties surrounding the US elections and conflicts in the Middle East. In the first fortnight of November, however, gold prices declined as rising yields and a strengthening US dollar increased the opportunity cost of holding gold (Chart II.7c). Brent crude oil prices increased in early October as markets were on edge following escalation of geopolitical tensions in the Middle East. Oil prices, however, declined towards the latter half of the month, tracking increased supply prospects in 2025 and partial easing of geopolitical tensions. Overall, prices increased by 2.3 per cent (m-o-m) in October. In the first half of November, crude oil prices declined due to a weaker demand outlook (Chart II.7d). 
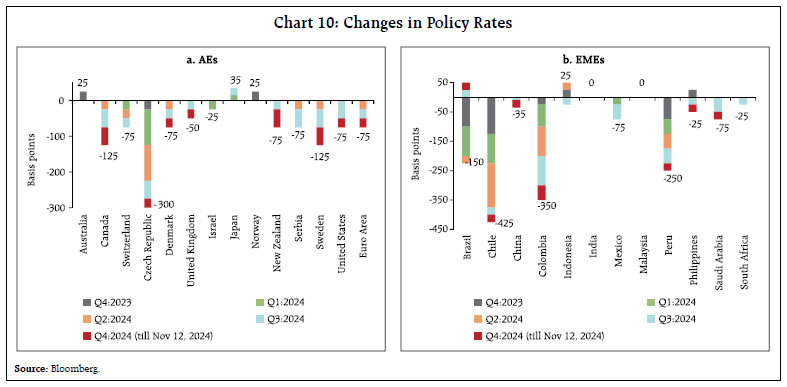
 Headline inflation continued to decelerate across major economies, albeit unevenly, even though services inflation continue to remain elevated, especially in AEs. In the US, CPI inflation increased to 2.6 per cent year-on-year (y-o-y) in October 2024 from 2.4 per cent in September. Inflation in terms of the personal consumption expenditure (PCE) deflator softened to 2.1 per cent in September from 2.3 per cent in August. Headline inflation in the Euro area edged up to 2.0 per cent in October from 1.7 per cent in September (Chart II.8a). Among EMEs, inflation increased in Brazil and Russia, but softened in China in October (Chart II.8b). Core and services inflation remained higher than the headline in most AEs (Chart II.8c and 8d). Global equity markets declined in October, tracking geopolitical uncertainties as well as election outcomes in the US and Japan. The Morgan Stanley Capital International (MSCI) world index recorded a 2.3 per cent (m-o-m) decline in October, with the emerging markets index declining by 4.4 per cent (Chart II.9a). The decline in EME equity markets was led by a retraction in China as markets pulled back from the sharp rise following the stimulus measures announced in September. Following the US election results (between November 5 and 12), equity markets rallied substantially, led by gains in advanced economies, with the MSCI world index rising by 1.6 per cent. 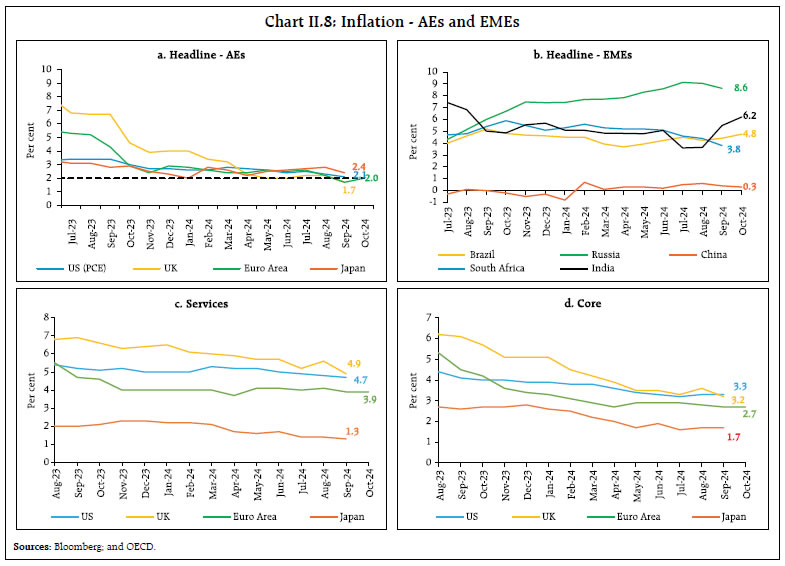 The US government securities yields on both 10-year and 2-year bonds hardened by 50 bps and 53 bps, respectively, in October as hopes of major rate cuts receded amidst various data releases, including US GDP indicating the underlying strength in the economy (Chart II.9b). Yields further strengthened in November as markets started to factor in higher budget deficits in the US following the election results. Both 10-year and 2-year yields increased by 16 bps and 17 bps, respectively since November 05 (up to November 12). In the currency markets, the US dollar strengthened by 3.2 per cent (m-o-m) in October, while the MSCI currency index for EMEs decreased by 1.6 per cent in October, mainly due to capital outflows in the equity segment. After the results, the US dollar index further strengthened by 2.5 per cent (Chart II.9c and II.9d). Among AE central banks, the US Federal Reserve Open Markets Committee (FOMC) decided to lower the target range for the federal funds rate by 25 basis points on November 07, 2024 and indicated that “inflation has made progress toward the Committee’s 2 per cent objective but remains somewhat elevated”.8 The United Kingdom cut its policy rates by 25 bps in November while Sweden and Canada cut their benchmark rates by 50 bps in November and October, respectively. Japan, Norway and Australia continued with a pause (Chart II.10a). Among EME central banks, Peru and Mexico have reduced their policy rates by 25 bps in November (Chart II.10b). As part of ongoing stimulus measures, China cut its one-year Loan Prime Rate (LPR) and five-year LPR by 25 bps to 3.10 per cent and 3.60 per cent, respectively. In contrast, Russia in October raised its policy rate by 200 bps to 21.0 per cent and and Brazil raised its rate by 50 bps in November to 11.25 per cent to combat inflationary pressures. 
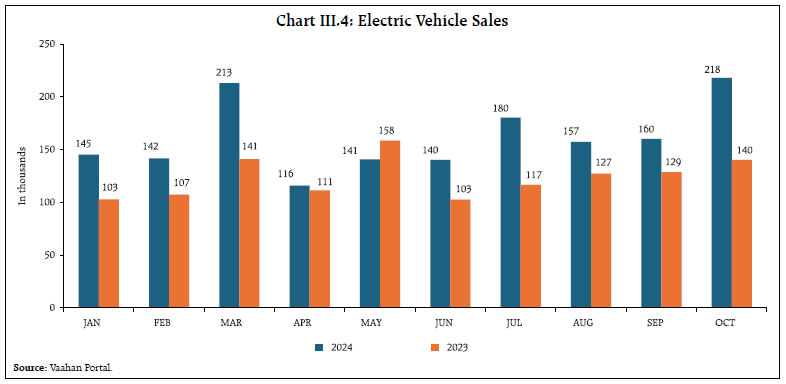
 III. Domestic Developments Despite heightened geopolitical risks, supply chain pressures facing India eased in October, falling below historical average levels (Chart III.1a). Our economic activity index (EAI)9, based on a range of high frequency indicators, projects real GDP growth at 6.7 per cent and 7.6 per cent in Q2 and Q3:2024-25, respectively. (Charts III.1b and III.1c). Aggregate Demand High-frequency indicators suggest that aggregate demand regained strength in October 2024, buoyed by festival season demand. E-way bills increased by 16.9 per cent y-o-y, reflecting higher supply chain activity (Chart III.2a). Toll collections increased by 10.4 per cent (y-o-y) in value terms and 7.9 per cent (y-o-y) in volume terms (Chart III.2b). Automobile sales increased by 11.7 per cent (y-o-y) as the festival season spending and discounts from automakers boosted demand (Chart III.3a). In particular, sales in the passenger vehicles segment and in two-wheelers drove overall growth. Domestic tractor sales also increased by 22.4 per cent, recording the highest sales since May 2011. (Chart III.3b). Vehicle registrations surged across both transport and non-transport segments (Chart III.3c). Petroleum consumption rebounded after two consecutive months of contraction, driven by increase in demand for aviation turbine fuel and motor spirit (petrol) [Chart III.3d]. October 2024 also witnessed the highest-ever sales of electric vehicles (EVs) with a y-o-y growth of 55.7 per cent (Chart III.4). The total EV sales during January-October 2024 have already surpassed the total EV sales in 2023. EV adoption is increasing strongly with policy support initiatives (Box 1). 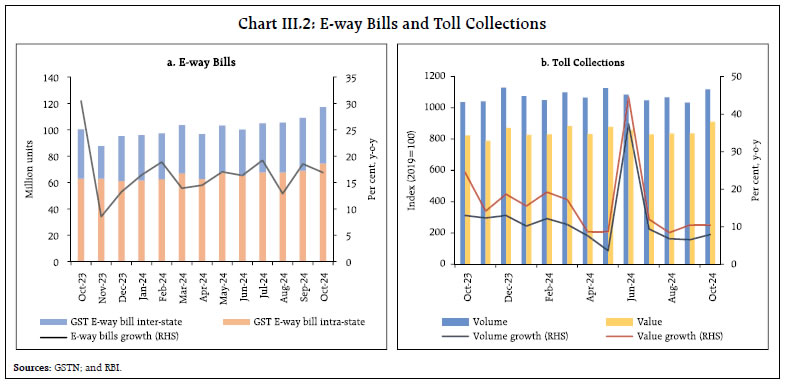

Box 1: Assessing the Impact of State-Level Policies on 2W-EV Adoption in India The evolution of the EV policy in India has been marked by a series of initiatives (incentives, subsidies, and infrastructure development plans) aimed at promoting electric mobility and reducing dependence on fossil fuels (Table 1A). Building on the Union government’s initiatives, most states have introduced their own EV policies.10 The recently announced electric drive revolution in innovative vehicle enhancement (PM E-DRIVE) scheme by the centre aims to further accelerate the adoption of EVs across India.11 Given high upfront costs, studies have shown that monetary incentives such as rebates, tax credits, and reduced registration fees enhance EV adoption by lowering the initial purchase cost for consumers (Jenn et al., 2018; and Sierzchula et al., 2014). To study the impact of state-level EV policies on the adoption of 2-wheeler EVs (2W-EVs), an adoption ratio (AR) was constructed as follows: A higher AR signifies a greater share of EV sales relative to non-EVs and hence a deeper market penetration. The implementation of supportive EV policies has positively impacted EV adoption, as evident from a significant increase in AR (Chart 1A). Quarterly data of 23 Indian states from March 2021 to December 2023 were considered. A variable for policy incentives was created for each state which takes a value of 1 for periods after the policy came into effect and 0 otherwise. The binary-level policy indicator encapsulates the diverse set of policy measures, including demand incentives, charging infrastructure development, R&D, and related aspects that indicate the impact of EV policy as a whole. Thereafter, the following regression equation was estimated: Where β1 measures the change in adoption ratio post policy adoption. | Table 1A: Evolution of EV Policy in India | | Policy | Goals | Incentives | | Alternate fuels for surface transportation (AFST) (2011) | Developing indigenous technology and encouraging domestic manufacturing. | Central Financial Assistance as a subsidy to direct end-users; Incentives for R&D and domestic manufacturing. | | National electric mobility mission plan (NEMMP) 2020 (Launched in 2013) | Achieve 6-7 million sales of electric and hybrid vehicles year on year from year 2020 onwards. | Tax incentives; support for charging infrastructure; Pilot projects; Market creation; and R&D support. | | Faster Adoption and Manufacturing of (Hybrid and) Electric Vehicles in India (FAME India) Scheme Phase I (2015) (Launched as part of NEMMP) | Four focus areas:
• Demand creation
• Technology platform
• Pilot projects
• Charging infrastructure. | Demand incentives for buyers of EVs in the form of an upfront-reduced purchase price, grants for specific projects under pilot projects, R&D/technology development, and public charging infrastructure. | | FAME India Scheme Phase-II (2019) (Extension of FAME India Scheme Phase-I) | Encourage faster adoption of EVs; Establishing necessary charging infrastructure for EVs; Carrying out various awareness activities. | Financial subsidies to buyers by offering upfront incentives on purchase; State-level incentives in addition to central subsidies; and R&D support. | | Electric drive revolution in innovative vehicle enhancement (PM E-DRIVE) [2024] | Promote electric mobility, reduce the environmental impact of transportation and improve air quality; Expedite adoption of EVs; Efficient, competitive, and resilient EV manufacturing. | Subsidies/Demand incentives for 2W-EVs, 3W-EVs, e-ambulances, e-trucks and other emerging EVs; Installation of EV public charging stations in selected cities with high EV penetration and highways. | | Sources: PIB; BEE12; and Authors’ compilation. |
 A positive and significant value for the policy indicator indicates that the adoption of 2W-EVs in India accelerated in a supportive EV policy regime (Table 1B).13 | Table 1B: Panel Regression Results | | Dependent Variable: Adoption Ratio (state-wise for 23 States) | | | Period (March 2021- December 2023)
Sample Size = 276 | | Explanatory Variables | | | Policy Indicator | 3.1***(0.52) | Note: *, ** and *** indicate significance at 10, 5 and 1 per cent level. Figures in parentheses are standard errors.
Source: Authors’ estimates. | References: Jenn, A., Springel, K., and Gopal, A. R. (2018). Effectiveness of electric vehicle incentives in the United States. Energy Policy, 119, 349-356. Sierzchula, W., Bakker, S., Maat, K., and Van Wee, B. (2014). The influence of financial incentives and other socioeconomic factors on electric vehicle adoption. Energy Policy, 68, 183-194. Atal Singh, Satyam Kumar, Abhyuday Harsh and Tista Tiwari (2024). Impact of State-Level Policies on 2W-EV Adoption in India, Mimeo. | As per the latest Quarterly Urban Periodic Labour Force Survey (PLFS) report14, the unemployment rate (UR) in urban areas in India declined to 6.4 per cent in July-September 2024 quarter – the lowest in the PLFS series since its inception in June 2018 – from 6.6 per cent in the previous quarter (Chart III.5). There was a decline in UR for both male and female workers along with increases in both the labour force participation rate (LFPR) and the worker population ratio (WPR). The share of regular salaried workers in overall employment increased in the quarter while the share of self-employed workers and casual labour registered a decline from the previous quarter (Chart III.6a). Almost two thirds of the workers in urban areas in India are employed in services sector activities (Chart III.6b).  As per PMI employment indices, organised manufacturing employment recorded an acceleration in October and remained in the expansionary zone for the eighth consecutive month (Chart III.7). The rate of job creation in the services sector recorded the strongest growth in over two years. During 2024-25 so far, households’ demand for work under the Mahatma Gandhi National Rural Employment Guarantee Act (MGNREGA) has generally remained lower than most of the post-pandemic years (Chart III.8). Although a sequential uptick was observed in October, it has remained lower than the levels recorded a year ago, indicating increased availability of alternative employment opportunities.
India’s merchandise exports at US$ 39.2 billion grew by 17.2 per cent (y-o-y) in October 2024, driven by both a strong momentum and a favourable base effect (Chart III.9). Exports of 25 out of 30 major commodities (accounting for 72.8 per cent of the export basket) expanded on a y-o-y basis in October. Engineering goods, electronic goods, organic and inorganic chemicals, rice, and ready-made garments (RMG) of all textiles were the top drivers of export growth, while petroleum products, iron ore, and ceramic products and glassware contributed negatively (Chart III.10). During April-October 2024, India’s merchandise exports expanded by 3.2 per cent to US$ 252.3 billion, primarily led by engineering goods, electronic goods, drugs and pharmaceuticals, chemicals and RMG of all textiles, while petroleum products, gems and jewellery, iron ore, and marine products dragged down export growth.
Exports to 17 out of 20 major destinations grew in October on a y-o-y basis. During April-October 2024, exports to 13 out of 20 major destinations witnessed an expansion, with the US, the UAE and the Netherlands being the top three export destinations. Merchandise imports expanded for the seventh consecutive month in October and reached an all-time monthly high of US$ 66.3 billion, with a growth of 3.9 per cent (y-o-y) on account of a positive momentum which more than offset a negative base effect (Chart III.11). Out of 30 major commodities, 20 commodities (accounting for 68.4 per cent of import basket) registered an expansion on a y-o-y basis. Petroleum, crude and products, electronic goods, vegetable oil, non-ferrous metals, and machinery contributed positively, while silver, coal, coke and briquettes, pearl, precious and semi-precious stones, transport equipment, and gold contributed negatively to import growth in October (Chart III.12). During April-October 2024, India’s merchandise imports at US$ 416.9 billion increased by 5.8 per cent (y-o-y), mainly led by POL, electronic goods, gold, non-ferrous metals, and machinery. Pearls, precious and semi-precious stones, coal, coke and briquettes, chemical material and products, fertilisers, and dyeing, tanning and colouring materials contributed negatively.
Imports from 11 out of 20 major source countries expanded in October, while imports from 13 out of 20 major source countries increased during April-October 2024. The merchandise trade deficit at US$ 27.1 billion in October 2024 was lower than US$ 30.4 billion in October 2023, despite a sequential pick-up from the previous month. The oil deficit rose to US$ 13.7 billion in October from US$ 10.3 billion a year ago. Consequently, the share of the oil deficit in the merchandise trade deficit rose to 50.5 per cent in October from 33.7 per cent a year ago. The non-oil deficit contracted to US$ 13.4 billion in October from US$ 20.2 billion a year ago (Chart III.13).
During April-October 2024, India’s merchandise trade deficit widened to 164.7 billion from US$ 149.7 billion a year ago. Petroleum products were the largest source of the deficit, followed by electronic goods (Chart III.14). Services exports rose by 14.6 per cent (y-o-y) to US$ 32.6 billion while services imports grew by 13.2 per cent (y-o-y) to US$ 16.5 billion during September 2024 (Chart III.15). This led to an increase of 16.1 per cent (y-o-y) in net services export earnings to an eight-month high of US$ 16.1 billion during the month. During April-September 2024, India’s net services export earnings increased to US$ 84.4 billion from US$ 75.1 billion during the corresponding period a year ago. All major key deficit indicators of the Union government, viz., the gross fiscal deficit (GFD), the revenue deficit (RD), and the primary deficit (PD) recorded an improvement during H1: 2024-25 [both in absolute terms as well as per cent of budget estimates (BE)] relative to the corresponding period of the previous year (i.e., H1: 2023-24). The GFD stood at 29.4 per cent of BE in H1: 2024-25 as against 39.3 per cent in the corresponding period of the previous year (Chart III.16a and 16b). This improvement during H1: 2024-25 was registered on the back of a robust growth in revenue receipts. On the other hand, the total expenditure of the Union government (around ₹21.1 lakh crore) remained flat relative to the corresponding period of the previous year. 
 Revenue expenditure growth moderated to 4.2 per cent during H1: 2024-25, from a growth of 10.0 per cent recorded in H1: 2023-24 while capital expenditure contracted by 15.4 per cent on a y-o-y basis. The contraction in capital expenditure can be partly attributed to the imposition of the model code of conduct in the run up to the general elections during Q1: 2024-25 as well as due to the impact of heavy monsoon rains during the months of July and August. During Q2: 2024-25, however, capital expenditure rebounded, with a y-o-y growth of 10.3 per cent. The outgo on major subsidies (food, fertiliser and petroleum) increased by 4.0 per cent in H1: 2024-25 on a y-o-y basis, driven by 27.6 per cent growth in food subsidy outgo while fertiliser subsidy contracted by 18.8 per cent, partly owing to decline in international fertiliser prices. On the receipts side, gross tax revenues recorded a growth of 12.0 per cent during H1: 2024-25 vis-à-vis a growth of 16.3 per cent in the corresponding period of the previous year. This was primarily driven by robust growth in income tax (25.0 per cent) and goods and service tax (GST) [10.4 per cent]. Similarly, indirect taxes such as custom duties and excise collections also witnessed higher growth (Chart III.17a). Non-tax revenues posted a strong growth of 50.9 per cent on account of high surplus transfer of ₹2.1 lakh crore by the Reserve Bank (Chart III.17b). Non-debt capital receipts underwent a y-o-y contraction of 27.6 per cent owing to a decline in disinvestment receipts and recovery of loans. Overall, total receipts posted a growth of 15.5 per cent in H1: 2024-25 over the corresponding period of the previous year. Gross GST collections (Centre plus States) for the month of October 2024 amounted to ₹1.87 lakh crore (the second highest monthly collection after April 2024), registering a growth of 8.9 per cent on a y-o-y basis (Chart III.18). After accounting for refunds, net GST collections for September 2024 stood at ₹1.68 lakh crore, growing at 7.9 per cent on y-o-y basis. The cumulative gross GST collections for April-October 2024 stood at ₹12.7 lakh crore (with a growth of 9.4 per cent over April-October 2023). States’ GFD stood at 43.9 per cent of the budget estimates during H1: 2024-25, lower than last year’s level (Chart III.19).15 Revenue receipts increased by 7.5 per cent, driven by double digit growth in tax revenues, while non-tax revenues and grants from the Union government contracted (Chart III.20a). States’ revenue expenditure growth accelerated, while capital expenditure declined during this period (Chart III.20b). Capital expenditure, however, showed signs of recovery during Q2: 2024-25. Aggregate Supply As per the first advance estimates (AE) for 2024-25, the production of kharif foodgrains (rice, coarse cereals and pulses) is estimated at a record 164.7 million tonnes, 5.7 per cent higher than the final estimates of 2023-24, reflecting the positive impact of above normal rainfall activity during the southwest monsoon (SWM) season this year (Chart III.21). Among major kharif crops, the production of rice, maize and groundnut have also been estimated at record levels. 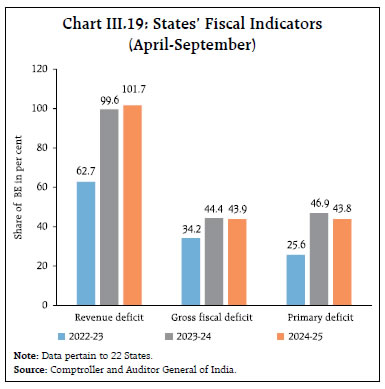
 The SWM withdrew from the entire country on October 15, 2024 which also marked the simultaneous commencement of northeast monsoon (NEM) rainfall activity in the southeast peninsular region. During October 01-November 17, the cumulative NEM rainfall was 10 per cent below its long period average (LPA) as compared with 27 per cent below LPA last year. As of November 07, 2024, the all-India average water storage (based on 155 major reservoirs) was at 86 per cent of the total capacity, which is 25.2 per cent and 16.0 per cent higher than last year and the decadal average, respectively (Chart III.22a). The prospects of rabi production appear to be bolstered by adequate rains and reservoir levels.
As on November 08, 2024 the total rabi sown area stood at 146.1 lakh hectares (23.0 per cent of full season normal area), lower than 157.7 lakh hectares sown during the corresponding week of the previous year (Chart III.22b). The rice procurement for the kharif marketing season (KMS) 2024-25 started on September 30, 2024. As of November 12, it stood at 133.2 lakh tonnes as compared with 151.4 lakh tonne during the corresponding period of the previous year (Chart III.23). The buffer stock of rice16 stood at 440.8 lakh tonnes (4.3 times the norm) as of November 01, 2024 whereas the wheat stock stood at 222.6 lakh tonne (1.1 times the norm).
India’s manufacturing PMI accelerated in October 2024 led by increase in orders, employment, and new output (Chart III.24a). The services PMI also moved to 58.5 in October 2024 from a 10-month low of 57.7 in September, driven by strong demand conditions (Chart III.24b). Business expectations in the manufacturing sector exhibited improvement, while future business activity moderated in services. India’s progress towards clean energy transition achieved a milestone in October 2024 with renewable generation capacity crossing 200 giga watts (GW), making up 46.3 per cent of total installed capacity (Chart III.25). As described in the Introductory section, led by the solar and wind capacity additions in the recent years, India stands fourth globally in renewable capacity. Four states, viz., Rajasthan, Gujarat, Tamil Nadu and Karnataka accounted for around half of the renewable capacity in India.
Port traffic contracted in October 2024, driven by petroleum, oil and, lubricants (Chart III.26). The construction sector picked up pace, with steel consumption expanding by 9 per cent (y-o-y) in October, and cement production increasing by 7.1 per cent in September 2024 (Chart III.27). Available high frequency indicators for the services sector reflect traction in economic activity in September/October 2024. Supported by the festive season and recession of SWM, logistics activity increased as reflected in e-way bills and toll collection. Construction also picked up pace as seen in steel consumption and cement demand (Table III.1)
Inflation Headline inflation, as measured by y-o-y changes in the all-India CPI17, increased to 6.2 per cent in October 2024 from 5.5 per cent in September 2024 (Chart III.28). The increase in inflation of around 70 basis points (bps) came from a positive momentum of around 135 bps, which was partially offset by a favourable base effect of 65 bps. CPI food and CPI core (i.e., CPI excluding food and fuel) groups recorded m-o-m increases of 2.2 per cent and 0.6 per cent, respectively, while the CPI fuel index remained unchanged. Food inflation increased y-o-y to 9.7 per cent in October from 8.4 per cent in September. In terms of sub-groups, vegetables and edible oils recorded significant increases, both on m-o-m and y-o-y basis (Chart III.29). Prices rises in respect of fruits, cereals and products, meat and fish, non-alcoholic beverages, and prepared meals increased while they moderated in pulses and products, eggs and sugar (Chart III.30). Inflation in milk and products remained unchanged, while deflation in spices deepened. Fuel and light deflation deepened to (-)1.6 per cent in October from (-)1.4 per cent in September, on higher rates of deflation in kerosene. Inflation in electricity, and firewood and chips prices, on the other hand, recorded an increase. LPG price inflation remained steady.
Core inflation increased to 3.8 per cent in October from 3.6 per cent in September. While inflation remained steady for sub-groups such as clothing and footwear, pan, tobacco and intoxicants, and transport and communication, it increased in respect of recreation and amusement, housing, household goods and services, education and personal care and effects. Inflation in the prices of the health sub-group recorded a moderation. In terms of regional distribution, inflation hardened in both rural and urban areas in October, with rural inflation at 6.7 per cent being higher than urban inflation at 5.6 per cent. Majority of the states registered inflation below 6 per cent (Chart III.31). High frequency food price data for November so far (up to 12th) show an increase in cereals (mainly driven by wheat and atta) and broad-based pressures in edible oil prices. Pulses prices also witnessed hardening (except tur). Among key vegetables, potato and onion prices increased, while tomato prices recorded a sharp moderation (Chart III.32).
Retail selling prices of petrol and diesel remained broadly unchanged in November thus far (up to 12th). While kerosene prices edged up after two months of softening, LPG prices were kept unchanged (Table III.2). The PMIs for October 2024 indicated a further increase in the rate of expansion in input costs across manufacturing and services firms. Selling price pressures also increased across manufacturing and services firms, following a slowdown in the rate of expansion over the previous two months (Chart III.33). | Table III.2: Petroleum Products Prices | | Item | Unit | Domestic Prices | Month-over-month (per cent) | | Nov-23 | Oct-24 | Nov-24^ | Oct-24 | Nov-24^ | | Petrol | ₹/litre | 102.92 | 100.97 | 100.99 | 0.0 | 0.0 | | Diesel | ₹/litre | 92.72 | 90.42 | 90.45 | 0.0 | 0.0 | | Kerosene (subsidised) | ₹/litre | 55.21 | 42.93 | 43.95 | -6.2 | 2.4 | | LPG (non-subsidised) | ₹/cylinder | 913.25 | 813.25 | 813.25 | 0.0 | 0.0 | ^: For the period November 1-12, 2024.
Note: Other than kerosene, prices represent the average Indian Oil Corporation Limited (IOCL) prices in four major metros (Delhi, Kolkata, Mumbai and Chennai). For kerosene, prices denote the average of the subsidised prices in Kolkata, Mumbai and Chennai.
Sources: IOCL; Petroleum Planning and Analysis Cell (PPAC); and RBI staff estimates. |
IV. Financial Conditions System liqudity moderated in the latter half of October with the build-up in government cash balances on account of higher GST collections18 and festival related expansion in currency in circulation. Government spending eased liquidity conditions in early November. Overall, system liquidity remained in surplus during the second half of October and early November, with the average daily net absorption under the liquidity adjustment facility (LAF) increasing to ₹1.72 lakh crore during October 16 to November 18, 2024 from ₹1.14 lakh crore during September 16 to October 15, 2024 (Chart IV.1). The Reserve Bank conducted three main and sixteen fine-tuning variable rate reverse repo (VRRR) operations during October 16 to November 19, 2024, with maturities ranging from overnight to 4-days, cumulatively absorbing ₹8.38 lakh crore from the banking system. To alleviate month-end liquidity tightness, however, a fine-tuning variable rate repo (VRR) operation of 6 days maturity was conducted on October 25. 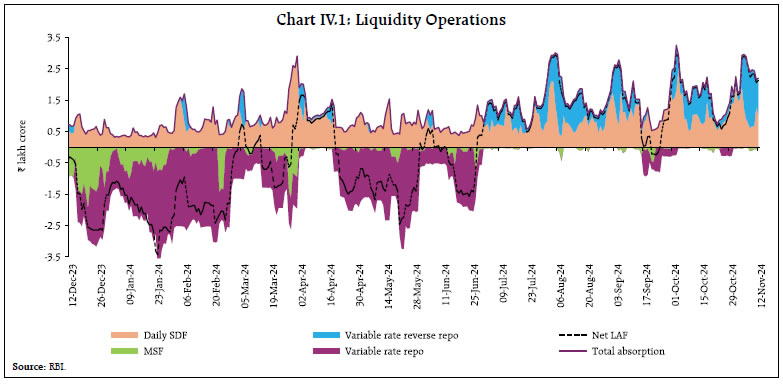 Of the average total absoption during October 16 to November 18, 2024, placement of funds under the standing deposit facility (SDF) accounted for about 61 per cent. As liquidity conditions eased, average daily borrowings under the marginal standing facility (MSF) fell to ₹0.05 lakh crore during October 16 to November 18, 2024 from ₹0.08 lakh crore during September 16 and October 15, 2024. In the overnight money market, the weighted average call rate (WACR) remained within the LAF corridor, averaging 6.48 per cent during October 16 and November 18, 2024, almost the same as during September 16 to October 15, 2024 (Chart IV.2a). The WACR, however, firmed up for a brief period (October 22-28) on account of relatively tight liquidity conditions, although it remained within the policy corridor. In the collateralised segment, the tri-party repo and the market repo rates averaged 15 bps and 13 bps, respectively, below the policy repo rate during the same period (Chart IV.2b). In the short-term money market segment, yields on 3-month treasury bills (T-bills) remained broadly stable during October 16 and November 18. Rates on 3-month certificates of deposit (CDs) and 3-month commercial paper (CP) issued by non-banking financial companies (NBFCs) eased (Chart IV.2b). The average risk premium in the money market (spread between 3-month CP and 91-day T-bill rates) declined by 4 bps. In the secondary market, the spread of 3-month CP (NBFC) and CD rates over the 91-day T-bill rate stood at 103 bps and 71 bps, respectively, during November 2024 (up to November 12) – higher than 85 bps and 36 bps a year ago (Chart IV.2c). Although the spreads tend to ease during periods of surplus liquidity, they have increased in recent months mainly due to a decline in 91-day T-Bill rates. The weighted average discount rate (WADR) of CPs stood at 7.44 per cent in November 2024 (up to November 12), lower than 7.70 per cent during the corresponding period of the previous year as NBFCs reduced issuances due to concerns on sustainability of high growth in their loan portfoilio and expectations of lower interest rates going forward (Chart IV.3). The weighted average effective interest rate (WAEIR) of CDs softened to 7.34 per cent (up to November 12) from 7.39 per cent a year ago as the gap between credit and deposit growth narrowed. In the primary market, CD issuances grew by 57 per cent (y-o-y) to ₹6.01 lakh crore during 2024-25 (up to November 1), significantly higher than ₹3.91 lakh crore in the corresponding period of the previous year to meet funding needs (Chart IV.4). CP issuances stood at ₹8.70 lakh crore during 2024-25 (up to October 31), higher than ₹7.84 lakh crore in the corresponding period of the previous year. With the Reserve Bank increasing the risk weight on bank loans to NBFCs, these entities have been relying on alternative market instruments to diversify funding. The 10-year G-sec yield hardened, tracking movements in US treasury yields and higher headline inflation prints (Chart IV.5a). During October 16 - November 18, the average term spread (10-year minus 91-day T-bills) rose to 36 bps from 29 bps during September 16 - October 15. The G-sec yield curve shifted upward in the short to middle tenor of the term structure, although it remained broadly stable at the very long end (Chart IV.5b).
The spread of 10-year Indian G-sec yield over 10-year US bonds fell to 240 bps as on November 12, 2024 from 310 bps in mid-September and 264 bps a year ago. The pick-up in US bond yields have been much sharper than Indian G-Sec yields. The volatility of yields in the Indian bond market has also been low relative to US treasuries (Chart IV.6). Corporate bond issuances rose to ₹1.30 lakh crore during September 2024 (the highest so far in the current financial year) as corporates took advantage of lower yields to diversify funding sources. Overall, corporate bond issuances during 2024-25 (up to September) were higher at ₹4.62 lakh crore compared to ₹3.92 lakh crore during the same period of the previous year. Corporate bond yields across the ratings and tenor spectrum exhibited mixed movement while the associated risk premia generally decreased (except for the 3-year BBB-category) during the second half of October to early November 2024 (Table IV.1). 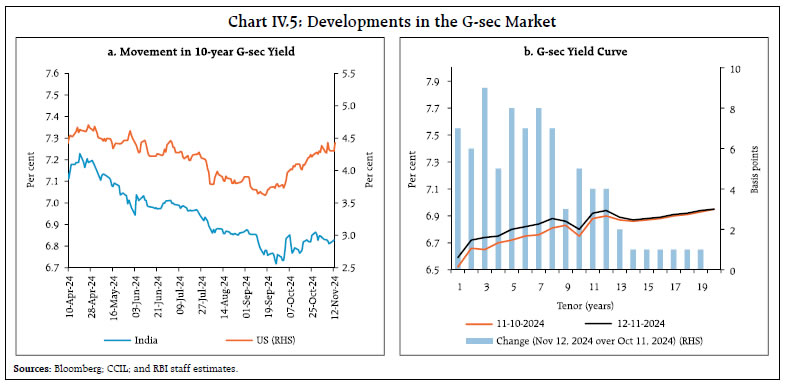
 Reserve money (RM), excluding the first-round impact of change in the cash reserve ratio (CRR) recorded a growth of 6.6 per cent (y-o-y) as on November 8, 2024 (7.0 per cent a year ago) [Chart IV.7]. The growth in currency in circulation (CiC), the largest component of RM was 6.1 per cent (y-o-y) as on November 8, 2024 up from 5.9 per cent as at end-September 2024, reflecting seasonal festival-related pickup in demand. On the sources side (assets), RM comprises net domestic assets (NDA) and net foreign assets (NFA) of the Reserve Bank. Foreign currency assets increased by 13.1 per cent (y-o-y) as on November 8, 2024 (Chart IV.8). Gold – a major component of NFA – grew by 50.8 per cent, mainly due to revaluation gains on gold prices, leading to steady rise in its share in NFA from 8.1 per cent as at end-October 2023 to 10.3 per cent as on November 8, 2024. | Table IV.1: Financial Markets - Rates and Spread | | Instrument | Interest Rates
(per cent) | Spread (bps) | | (Over Corresponding Risk-free Rate) | | Sep 16, 2024 – Oct 15, 2024 | Oct 16, 2024 – Nov 18, 2024 | Variation | Sep 16, 2024 – Oct 15, 2024 | Oct 16, 2024 – Nov 18, 2024 | Variation | | 1 | 2 | 3 | (4 = 3-2) | 5 | 6 | (7 = 6-5) | | Corporate Bonds | | | | | | | | (i) AAA (1-year) | 7.83 | 7.82 | -1 | 117 | 113 | -4 | | (ii) AAA (3-year) | 7.74 | 7.77 | 3 | 95 | 93 | -2 | | (iii) AAA (5-year) | 7.65 | 7.63 | -2 | 83 | 75 | -8 | | (iv) AA (3-year) | 8.49 | 8.52 | 3 | 170 | 169 | -3 | | (v) BBB- (3-year) | 12.07 | 12.17 | 10 | 528 | 533 | 5 | Note: Yields and spreads are computed as averages for the respective periods.
Sources: FIMMDA; and Bloomberg. |
 Money supply (M3) rose by 11.2 per cent (y-o-y) as on November 1, 2024 (11.0 per cent a year ago).19 Aggregate deposits with banks, accounting for around 86 per cent of M3, increased by 11.6 per cent (12.2 per cent a year ago). Scheduled commercial banks’ (SCBs’) credit growth moderated to 13.2 per cent as on November 01, 2024 (16.0 per cent a year ago) due to an unfavourable base effect (Chart IV.9). SCBs’ deposit growth (excluding the impact of the merger) increased from 11.3 per cent at end August 2024 to 12.2 per cent as on November 01, 2024, supported by robust momentum and a lower base effect (Chart IV.10).
SCBs’ incremental credit-deposit ratio declined from 95.8 as at end-March 2024 to 82.7 as on November 01, 2024 with incremental deposit outpacing incremental credit during August – October 2024 (Chart IV.11). With the statutory requirements for CRR and SLR at 4.5 per cent and 18 per cent, respectively, around 77 per cent of deposits were available to the banking system for credit expansion as on November 01, 2024. In response to the 250 basis points (bps) hike in the policy repo rate since May 2022, banks have revised upwards their repo-linked external benchmark-based lending rates (EBLRs) by a similar magnitude. The median 1-year marginal cost of funds-based lending rate (MCLR) of SCBs has increased by 170 bps during May 2022 to October 2024. Consequently, the weighted average lending rates (WALRs) on fresh and outstanding rupee loans have increased by 186 bps and 118 bps, respectively, during May 2022 to September 2024. On the deposit rates side, the weighted average domestic term deposit rates (WADTDRs) on fresh and outstanding rupee term deposits of SCBs increased by 251 bps and 192 bps, respectively, during the same period (Table IV.2). 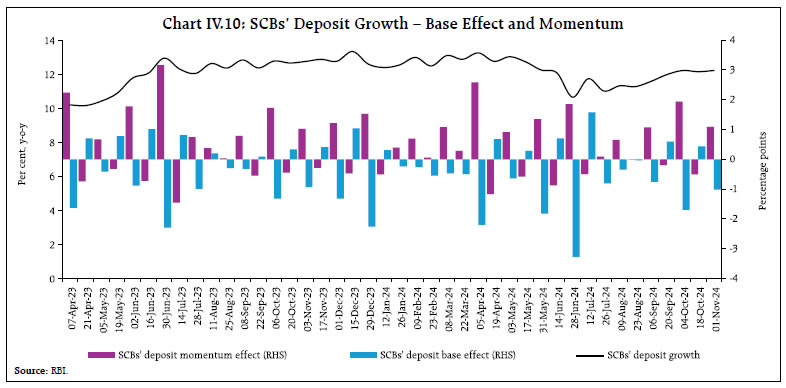
 Across bank groups, the increase in deposit rates was higher in the case of public sector banks vis-à-vis private banks; however, in case of outstanding rupee loans, transmission of policy rate increases was higher for private banks during the same period (Chart IV.12). The non-financial private corporates’ sales growth (y-o-y), i.e., of the early reporting listed non-government non-financial companies moderated to 5.2 per cent during Q2:2024-25 from 7.1 per cent in the previous quarter. Among major sectors, manufacturing companies’ sales growth decelerated to 3.3 per cent (6.3 per cent in the previous quarter) whereas it stood at 6.4 per cent and 11.3 per cent for IT and non-IT service companies, respectively (Chart IV.13a). | Table IV.2: Transmission to Banks’ Deposit and Lending Rates | | (Variation in basis points) | | | | Term Deposit Rates | Lending Rates | | Period | Repo Rate | WADTDR – Fresh Deposits | WADTDR- Outstanding Deposits | EBLR | 1-Yr. MCLR (Median) | WALR - Fresh Rupee Loans | WALR- Outstanding Rupee Loans | | Easing Phase Feb 2019 to Mar 2022 | -250 | -259 | -188 | -250 | -155 | -232 | -150 | | Tightening Period May 2022 to Sep* 2024 | +250 | 251 | 192 | 250 | 170 | 186 | 118 | Notes: Data on EBLR pertain to 32 domestic banks.
*: Data on EBLR and MCLR pertain to October 2024.
WALR: Weighted Average Lending Rate; WADTDR: Weighted Average Domestic Term Deposit Rate;
MCLR: Marginal Cost of Funds-based Lending Rate; EBLR: External Benchmark based Lending Rate.
Source: RBI. |
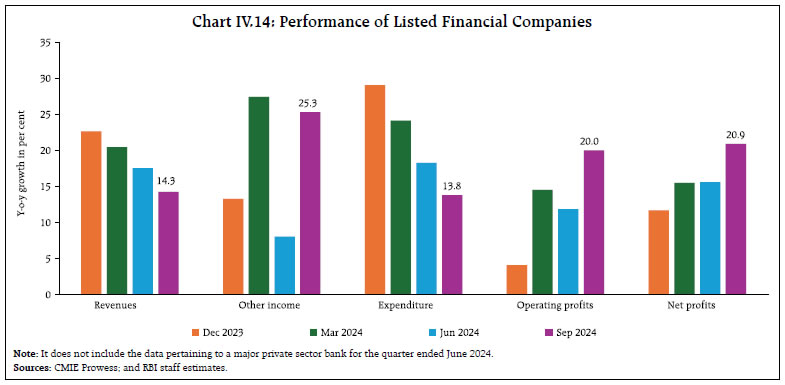
The profit margin of manufacturing companies moderated on both annual as well as sequential basis. Non-IT service companies also recorded lower profit margins but cost rationalisation helped IT companies in maintaining their operating profit margins (Chart IV.13b). Listed banks, NBFCs and other financial sector companies20 reported stable and healthy earnings despite some company-specific idiosyncrasies. Revenues, which primarily include interest income in the case of banks, recorded double digit growth, despite witnessing some sequential moderation. Other income, which includes income from fees/ commissions, profit and loss from sale of investments also registered double digit growth, pushing up total income. The growth in expenditure was slightly slower, resulting in an improved operating profits growth for the quarter. Provisioning costs increased sharply during the quarter; however, tax outgo increased moderately, resulting in strong double digit growth in net profits (after tax) of listed financial companies during the quarter (Chart IV.14). 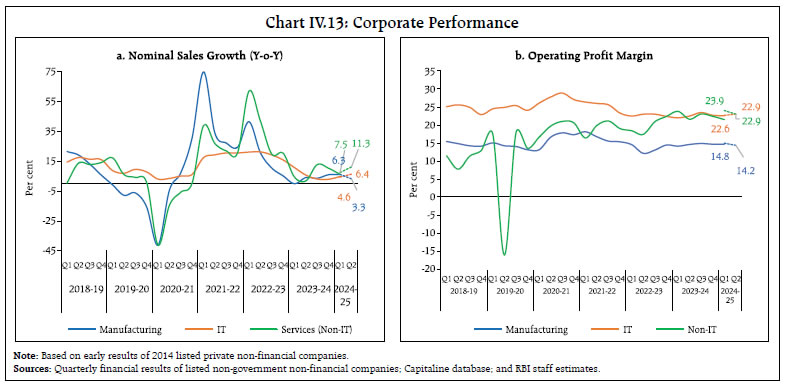
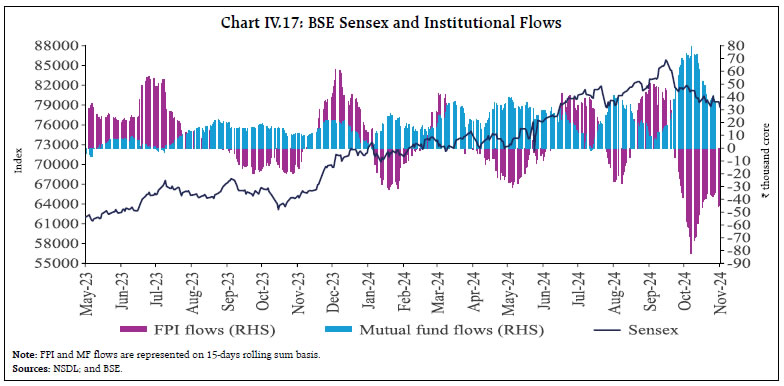
 The leverage of listed non-financial manufacturing companies, as reflected in their debt-to-equity ratio, continued to moderate21 during H1:2024-25, largely on account of higher capitalisation of profits. Petroleum, iron and steel, and cement industries led the rise in fixed assets of manufacturing companies, which rose by 7.8 per cent (y-o-y) with a share of about 47 per cent in total fixed assets (Chart IV.15). Retained earnings remained the major source of funds. Funds mobilised during the first half were mainly utilised in building up non-current investments22, fixed assets and trade recievables (Chart IV.16a and 16b). The Indian equity market continued to register losses in the second half of October 2024 and early November, amidst sustained FPI sell-offs (Chart IV.17). Geo-political uncertainty, high valuations and weaker than expected Q2:2024-25 earnings results dampened investors’ sentiments. Higher than expected domestic CPI inflation print for October 2024 also weighed on the sentiment. Overall, the BSE Sensex declined by 8 per cent since end-September to close at 77,580 on November 14, 2024. The recent equity market correction was an outcome of cumulative net outflows of around ₹1.2 lakh crore by FPIs from equities since late September till November 14, 2024 – the highest ever in absolute terms. On a relative basis, i.e., when FPI outflows are measured in relation to total market capitalisation, however, this episode of outflows remains modest so far in comparison with the sell-offs in previous episodes (Chart IV.18). Amidst the market correction, equity-oriented mutual funds witnessed the highest ever net inflows to the tune of ₹41,865 crore in the month of October 2024 as domestic investors sought to capitalise on market dips. 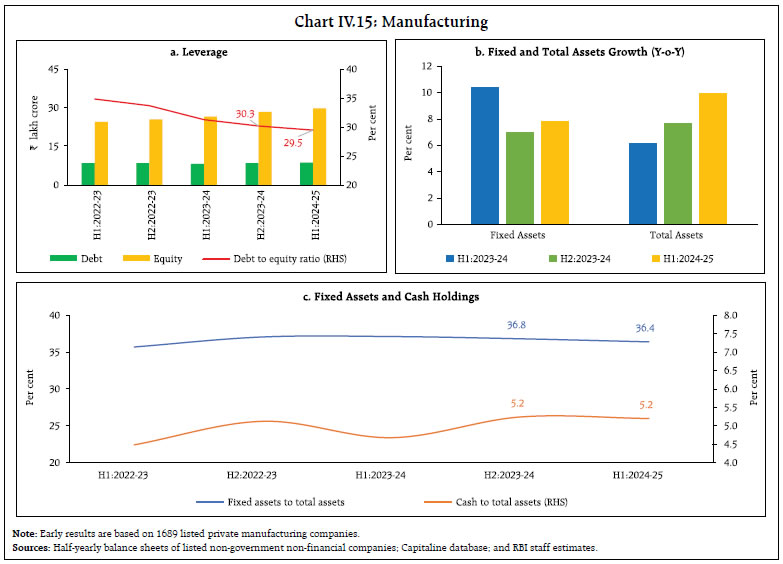

 Gross inward foreign direct investment (FDI) witnessed robust growth on a y-o-y basis as it increased to US$ 42.1 billion during April-September 2024 from US$ 33.5 billion a year ago. Net FDI moderated to US$ 3.6 billion during April-September 2024 from US$ 3.9 billion a year ago, primarily due to an increase in repatriation and outward FDI (Chart IV.19a). Manufacturing, financial services, electricity and other energy sectors, and communication services contributed for around two-thirds of the gross FDI inflows. Singapore, Mauritius, the Netherlands, the UAE, and the US were sources for about three-fourths of the flows. 
 With rising investments in AI start-ups worldwide, India is well-positioned to leverage its rapidly growing AI ecosystem to attract further investments and stimulate innovation (Chart IV.19b). Since 2023 (till H1:2024), India has positioned itself among the top six economies in the world in terms of investments in Generative AI startups.23 India has also ranked among the top ten nations in cumulative private AI investments during 2013-2023.24 Net foreign portfolio investment (FPI) flows turned negative in Indian capital markets in October 2024 after four months, impacted by escalating global uncertainty from geopolitical tensions and rebalancing by global portfolio managers in the wake of recent Chinese stimulus measures and election outcomes in the US. Net FPI outflows to the tune of US$ 11.0 billion in October 2024 rose to their highest level since the Covid-19 pandemic, primarily driven by substantial outflows in the equity segment (Chart IV.20a). The equity sell-offs appear widespread among emerging market economies (EMEs) as foreign investors shifted capital towards Chinese equities and away from other EMEs (Chart IV.18b). The debt segment witnessed a break in its five-month inflow streak during October 2024 although net outflows remained relatively contained. Among sectors, financial services, oil, gas and consumable fuels, and fast-moving consumer goods recorded the highest outflows during October. In November 2024 (up to November 14), net FPI outflows were to the tune of US$ 3.4 billion. Net inflows into non-resident deposits amounted to US$ 10.2 billion during April-September 2024, up from US$ 5.4 billion a year ago. Higher inflows were recorded in all three accounts, namely, Non-Resident (External) Rupee Accounts [NR(E)RA], Non-Resident Ordinary (NRO) and Foreign Currency Non-Resident [FCNR(B)] accounts. The total cost of projects sanctioned by banks and financial institutions (FIs) stood at ₹1,97,659 crore during H1:2024-25, signficantly higher than ₹1,75,217 crore in the previous year. Over 60 per cent of these investment are intended for the ‘power’ and ‘road and bridges’ sectors. Funds raised through external commercial borrowings (ECBs) and initial public offerings (IPOs) for capex stood at ₹26,308 crore during Q2:2024-25 over and above ₹36,489 crore in the previous quarter (Chart IV.21). New ECB loan registrations (US$ 14.3 billion) and disbursements (US$ 12.8 billion) were higher during Q2:2024-25 than in the previous quarter as well as in the corresponding period a year ago. Net inflows (US$ 7.9 billion) during H1:2024-25 stood higher vis-s-vis at US$ 6.8 billion than in the corresponding period last year (Chart IV.22a). Nearly half of the new ECBs registered during H1:2024-25 were intended for capex (including on-lending and sub-lending for capex) [Chart IV.22b].
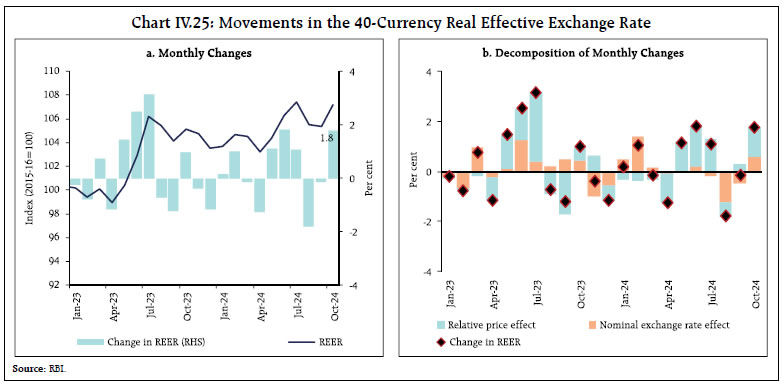
The recent easing of global benchmark interest rates such as the secured overnight financing rate (SOFR) resulted in a decline in the overall cost of ECBs raised during September 2024. The weighted average interest margin (WAIM) over the benchmark rates during H1:2024-25 was 5 bps higher than during H1:2023-24 (Chart IV.22c). Over three-fourths of registered ECBs during H1:2024-25 were effectively hedged in terms of explicit hedging, rupee-denominated loans and loans from foreign parents, which considerably offset the interest and exchange rate sensitivity of such exposures (Chart IV.23). The Indian rupee (INR) depreciated by 0.3 per cent (m-o-m) in October 2024 as most EMEs faced depreciating pressures due to a stronger US dollar. However, the INR held its position as the least volatile among major currencies during the month (Chart IV.24, Box 2). The INR appreciated by 1.8 per cent (m-o-m) in October 2024 in terms of the 40-currency real effective exchange rate (REER) due to the appreciation of INR in nominal effective terms alongside positive inflation differentials (Chart IV.25). Box 2: India’s Exchange Rate Regime Since March 1993, the exchange rate of the Indian rupee (INR) is market determined. The Reserve Bank of India (RBI) undertakes two-sided forex interventions (FXI) to contain excessive volatility and maintain orderly conditions in the foreign exchange market, without targeting any specific level of the exchange rate. This policy objective has remained unchanged since 1993. This approach has resulted in smoothening the effects of volatile capital flows, maintaining financial stability, and minimising spillovers to the real sector. In its Annual Report on Exchange Arrangements and Exchange Restrictions (AREAR) for the year 2023, the International Monetary Fund (IMF) has termed India’s exchange rate policy as a de facto ‘stabilized arrangement’ for the period December 2022-October 2023, while the de jure classification remains ‘floating’. By the IMF’s own admission, the reclassification methodology follows a backward-looking statistical approach and draws an inference based on a very short time horizon25. The IMF’s +/- 2 per cent fluctuation range to de facto classify an exchange rate regime as a stabilized arrangement is ad hoc, subjective, an overreach of its central purpose of surveillance of member countries’ policies and tantamount to labeling. Furthermore, the selection of the period (December 2022-October 2023) is discretionary and thus, not appropriate to make a judgement on reclassification. In fact, the IMF’s recent research paper on forex market intervention (FXI) concludes that the RBI has been intervening to cushion the impact of external shocks, smooth market volatility, preclude the emergence of disorderly market conditions, and opportunistically replenish its FX reserves26. In the recent period, there has been some commentary in the media on the INR’s exchange rate policy. It is worthwhile to address the issue brought out therein, but free of emotion, discontent or pre-committed theoretical positions that remain untested with actual facts. Since 2020, the world economy, including India, is grappling with a prolonged period of heightened uncertainty unlike previous crises, viz., the global financial crisis (2008) and the taper tantrum (2013) in which India was either a bystander or there was only ‘talk’. Notwithstanding the overlapping polycrises being experienced since 2020, reserve depletions, net of valuation losses, are actually comparable across all these events. Furthermore, forex market interventions (FXI) need to be adjusted for the economy’s size to draw a fair conclusion27. Following this principle, it is found that RBI’s net interventions to GDP averaged 1.6 per cent during February to October 2022, as against 1.5 per cent during the earlier crises, which were of much lower magnitude. The RBI’s interventions are intended to ensure that the market is liquid and deep, and functioning in an orderly manner. As a result, volatility of the INR – as extracted from options prices as well as GARCH28 estimates and 30 days rolling standard deviations – has been steadily declining (Chart 2A). This has had beneficial effects in terms of anchoring financial stability. It is worth noting that the INR depreciated by 7.8 per cent during 2022-23 and by 1.4 per cent for 2023-24. The INR’s lower order of depreciation in 2023-24 reflected the strengthening of India’s macro-fundamentals29. 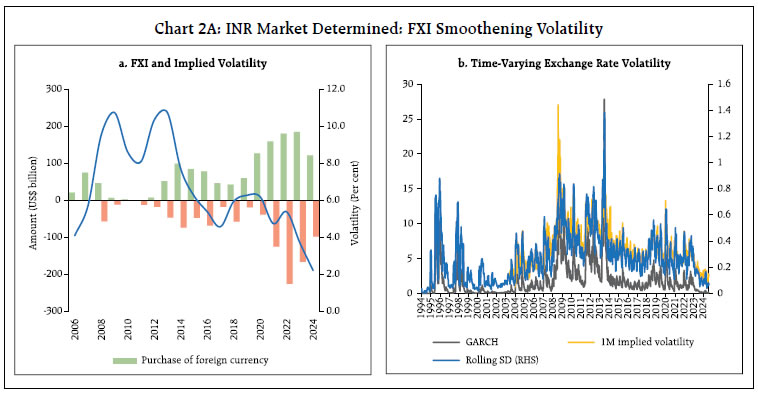 The inference by some commentators that the exchange rate policy stance has significantly impacted India’s export competitiveness is not substantiated by evidence. Export performance has to be adjusted for scale - between 2018-19 and 2023-24, world merchandise exports recorded a compound annual average growth rate (CAGR) of 4.0 per cent while India’s merchandise exports posted a higher CAGR of 5.8 per cent. Over this period, India’s merchandise export growth was more than that of several regional peers.30 Moreover, India’s export composition has undergone a significant shift - services exports recorded a robust CAGR of 10.4 per cent during 2018-19 to 2023-24, signifying their improving global competitiveness. Currently, India is the seventh largest exporter of services in the world with a share of 4.4 per cent, as against a share of only 1.8 per cent in global exports of merchandise in which it is ranked eighteenth. During 1994-2018, India’s merchandise exports expanded by a CAGR of 11.1 per cent but world merchandise export growth had also been higher with a CAGR of 6.3 per cent. Moreover, the sensitivity of India’s merchandise exports to real exchange rate changes seems to have come down over the years, reflecting diversification across markets and export items, rising technology intensity and higher value addition in manufacturing exports, increasing participation in global supply chains, and improving productivity and competitiveness.31 Thus, the emphasis in India’s export effort is shifting towards expanding market share on the basis of improvements in quality and cutting edge technology without the need for artificial props such as from an undervalued exchange rate. India’s foreign exchange reserves are built after meeting all current and capital financing needs to act as an umbrella for rainy days. Thus, the forex reserves are used to shore up investors’ confidence, ensure that the forex market remains liquid and deep, especially when there are large capital outflows, and to mitigate financial stability risks all of which can have real sector implications. |
 The foreign exchange reserves were at US$ 675.7 billion on November 8, 2024, retracting from the historical high of US$ 705.8 billion recorded at end-September 2024. At the current level, reserves cover more than 11 months of imports and more than 99 per cent of external debt outstanding at end-June 2024 (Chart IV.26a). India added US$ 53.2 billion to its reserves during 2024 so far (as on November 8), the second highest among Asian economies (Chart IV.26b). Asia dominates global foreign exchange reserves in 2024, with seven out of the world’s top ten reserve holding economies located in the region. Payments Systems Digital transactions across the payment modes remained buoyant amidst the festival season (Table IV.3). Real Time Gross Settlement (RTGS) has been witnessing a turnaround in growth, with an annual rise in transaction volume and value at 19 per cent and 26 per cent, respectively, as of October 2024. Retail payments through the Unified Payments Interface (UPI) reached a record volume of 16.6 billion transactions in October 2024. The number of UPI Quick Response (QR) codes more than doubled from a year ago, with approximately 61 crore active UPI QRs as of September 2024. Alongside this significant increase in scale, the system’s functionality has also improved, demonstrated by a rise in successful instant debit reversals to 86 per cent, up from 77 per cent in September 2023. 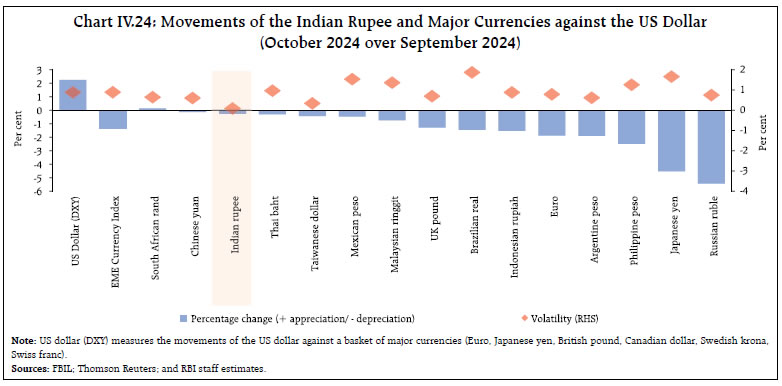
 The Bharat Bill Payment System (BBPS) achieved triple digit growth in 2024-25 so far, influenced by the Reserve Bank’s guidelines allowing non-bank payment aggregators into the system from April 2024.32 To centralise bill payments and strengthen security, the BBPS processes all credit card repayments, with major issuers supporting third party transactions.33 Additionally, a partnership between National Payments Corporation of India (NPCI) Bharat BillPay Limited and the Pension Fund Regulatory and Development Authority (PFRDA) added National Pension System (NPS) payments to the Bharat Connect platform, further boosting BBPS adoption.34 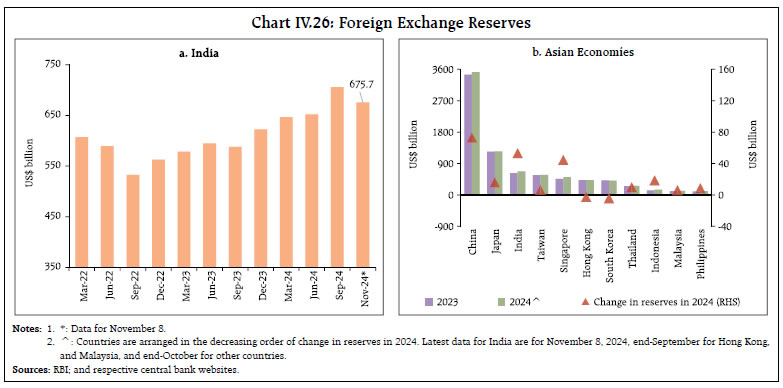
 Since December 2023, the number of fraud incidents per 1 lakh digital transactions has been on a decline, reflecting notable improvements in the safety and security of the digital payments ecosystem (Chart IV.27). The RBI Innovation Hub (RBIH) developed MuleHunter, an advanced AI tool, in August 2024 to detect mule accounts.35 Additionally, the National Payments Corporation of India (NPCI) partnered with The Times of India to launch a campaign for educating the public on digital frauds, focusing on risks such as phishing and OTP scams.36 Furthermore, the NPCI has launched a UPI Safety Awareness Campaign to proactively reinforce UPI’s security and robustness in users.37 On October 28, 2024, the Reserve Bank issued new guidelines for central counterparties (CCPs) authorised for clearing and settlement in India, superseding the directions from June 2019.38 These new rules aim to enhance CCPs’ operational safety, financial resilience and promote alignment with global standards. The key objectives include strengthening CCP governance, financial soundness, transparency, and accountability, ultimately supporting the resilience of India’s financial system and international cooperation in clearing and settlement. Conclusion Global growth is expected to sustain its momentum in the near-term as declining inflation and easing of financial conditions across major economies boosts consumer spending. Labour market conditions remain supportive with a decline in job vacancy rates and low unemployment rates. The global trade outlook is positive, although fears of protectionist trade policies loom over the nascent resilience. Despite a significant fall in inflation, consumer confidence in most economies is yet to recover, which could act as a drag going forward. Although fiscal policies in AEs including targeted infrastructure investments and social spending programs are expected to support growth, concerns over high debt levels remain significant, pushing up yields in recent months. Even as space for monetary easing has opened up in the AEs, EME central banks face challenges from external headwinds, leading to differences in policy responses. The Indian economy is exhibiting resilience, underpinned by festival-related consumption, and a recovering agriculture sector. Record production estimates for kharif foodgrains as well as promising rabi crop prospects augur well for farm income and rural demand, going forward. In terms of institutional infrastructure, the adoption of digital crop surveys for accurate production estimation and the introduction of drones are set to bring long-term efficiencies and productivity gains to the sector by enabling the assessment of production conditions on a real time basis and possibly in proactive supply management. On the industrial front, manufacturing and construction are expected to sustain dynamism. EV adoption, favorable policies, subsidies, and growing infrastructure are positioning India as a leader in sustainable transportation and fostering job creation in emerging clean energy sectors. India’s services sector is expected to sustain its growth momentum, robust job creation, and high consumer and business confidence. Despite pressures in the bond and equity markets from global uncertainty and fluctuating foreign portfolio investments, financial conditions are likely to remain accommodative as reflected in corporate bond issuances and FDI inflows. The digital payments ecosystem is also expected to sustain its growth momentum.
|