by Abhilash Arun Satape^, Nivedita Banerjee^ and Supriya Majumdar# The Services and Infrastructure Outlook Survey (SIOS)1 conducted by the Reserve Bank of India reflects the sentiments of the domestic services and infrastructure sectors. It aids in tracking the movement of related macroeconomic variables and is quite effective even during highly uncertain times like the COVID-19 pandemic. While sentiments in these sectors waned during the pandemic, corporates echoed the gradual return of their confidence in the overall business climate in the near-term. Introduction The services sector spans a large number of activities, e.g., education, healthcare, transport, media, financial services, information technology (IT), etc. Given their employment intensity, services activities hold potential for relocating labour from primary agricultural activities for better livelihood opportunities. In India, the services sector also contributes significantly to the overall GDP growth given its high share in overall economic activity; therefore, emerging trends in services sector become an important factor to be reckoned with. Concomitantly, the availability of the appropriate infrastructure through power generation, roads, railways, ports, and airports is critical for achieving sustained high growth. Understanding emerging trends in these two critical sectors, therefore, becomes a crucial element for effective policy making. Major central banks conduct consumer and business expectations surveys spanning various sectors which provide important inputs for monetary policy formulation.2 The survey expectations have useful predictive power for key macro variables like GDP and inflation and can be quite effective in understanding the evolving economic trajectory and its likely outturn periods of crisis such as the COVID pandemic. Keeping these in view, the Reserve Bank of India (RBI) has been conducting many forward-looking surveys, which includes the Services and Infrastructure Outlook Survey (SIOS). The SIOS captures the sentiments of enterprises engaged in services and infrastructure activities. It provides insights into the prevailing business conditions in these sectors and also expectations in the near term. The RBI has been conducting the SIOS on a quarterly basis since 2014-15. The first article on the SIOS was brought out in December 20203, which was aimed to serve as a metadata on the survey. The SIOS questionnaire4 is canvassed among a panel of around 4,000 companies from services and infrastructure sectors. The sample frame is selected to get a reasonable representation of size and industry. Services sector sentiments are broadly covered under major sub-sectors of information technology; trade; transport services; education; healthcare; travel, hotel, and restaurants; financial services; entertainment and communications. Business sentiments in the infrastructure sector are captured from companies engaged in transport and logistics; telecommunication; water and sanitation; energy and construction activities. The representation may vary across survey rounds as participation in the survey is voluntary. The responses obtained in SIOS about the parameters are summarised in terms of net responses5 (NR) for the assessment quarter, termed as assessment NR (NRA), and the NR for the expectations quarter which is described as expectations NR (NRE). During Q4:2019-20, when the COVID-19 pandemic hit, a block was introduced in Q1:2020-21, for assessing the business outlook of the corporate sector on critical parameters for two subsequent quarters, in order to capture medium-term expectations. Although quarterly SIOS data are released after each monetary policy announcement, a time series assessment of the key survey results and an evaluation of the survey performance has not been attempted so far. The present article bridges this gap and provides a comprehensive account of the evolution of the qualitative parameters captured in the SIOS during Q1:2014-15 to Q2:2023-24 for both services and infrastructure sectors. Furthermore, an attempt is also made to compare the performance across various sub-sectors. The article also aims to assess the extent of forward-looking information contained in the survey. The rest of the article is organised in four sections. Section II provides stylised facts about the SIOS. Section III presents an assessment of the consistency of survey responses as well as examines their co-movement with key macroeconomic variables. The insights from the survey regarding the recovery path of various sectors in the post-pandemic period is discussed in section IV. Concluding observations are presented in section V. II. Stylised Facts of SIOS Recent Trends Overall sentiments on turnover for services and infrastructure sector as reflected in the NRA and NRE have consistently remained optimistic except in Q1:2020-21 and Q1:2021-22 in terms of assessment (reflecting the impact of the pandemic) and in Q1:2020-21 in terms of expectations (Charts 1a and 1b). NRE has remained above NRA for most of the quarters, indicating that the expectations have been generally more optimistic than assessment. In the survey round conducted during Q2:2023-24, the sentiments of respondents on turnover remained optimistic, albeit with some moderation, for both the services and infrastructure sector. NRE, however, recorded a pick up for Q1:2024-25. Sector-specific Trends in Sentiments The subsectors covered under the services sector can be broadly classified into information technology (IT) and non-IT sectors. IT sector firms were less impacted during the COVID-19 pandemic as compared to their non-IT counterparts as the former sector is relatively less contact intensive. Both the assessment and expectations NRs are relatively higher for IT services in terms of turnover throughout the period under study. Further, in both sectors, the second wave was less severe as compared to the first wave (Charts 2a and 2b). Also, the NRs on Turnover for both IT (NRA T_IT & NRE T_IT) and non-IT (NRA T_Non IT & NRE T_Non IT) sectors mostly tracked the respective quarter on quarter (q-o-q) movement of sales growth. Among the non-IT sectors, travel, hotel, and restaurants sectors were impacted more severely during the pandemic. The sentiments of the healthcare services sector became passive during the first wave but improved later in the pandemic period. The sentiment of the transport services sector remained muted till Q2:2021-22, although negativity reduced from the second wave-hit Q1-2021-22. While other contact-intensive services firms exhibited optimism in Q2:2021-22 as reflected in the recovery of their sentiments, transport services sentiments turned positive only in Q3:2021-22 (Charts 2c and 2d). The sentiments of contact-intensive services moderated again during the sudden surge of omicron cases but recovered thereafter. Overall, the survey results show that the sentiments in the contact intensive services were hit relatively harder during the pandemic and the recovery has been uneven. Consistency of Sentiments Across Survey Parameters Since the survey covers perceptions of enterprises on demand conditions, financing situation, price situation, and overall business situation, the consistency of responses across parameters can help in validation of the survey responses. For example, improvement in the perception of the enterprises on the employment situation in terms of full-time and part-time employment is normally expected to be accompanied with a perception of increase in salary outgo, both in terms of assessment and expectations. Chart 3 plots co-movement among these parameters. It is found that both part-time and full-time employment perceptions tend to co-move with that of wages and salaries. Similarly, when the input cost increase, the respondent enterprises can be expected to either increase the selling prices or absorb the additional cost which would reflect in their profit margins. During the initial period of the pandemic, assessment about the selling prices fell more than that of input costs, which was consistently mirrored in the respondents’ assessment of a large fall in profit margins (Chart 4). During the recent period of input cost moderation (since Q1:2022-23), the selling prices NRA and NRE did not fall.
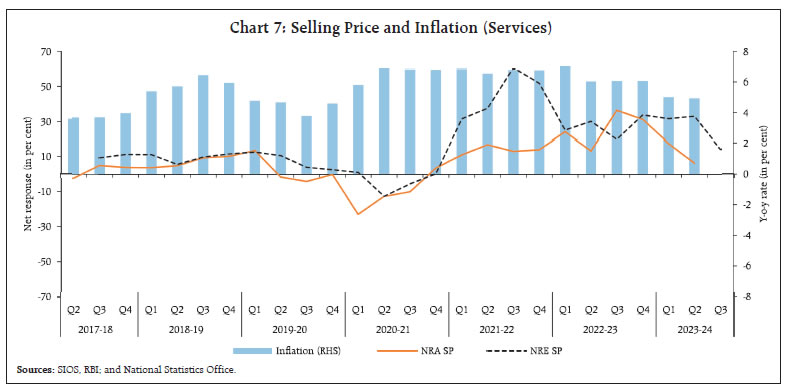
III. SIOS and Forward-looking Assessment of Macroeconomic Variables We now look at how well the business sentiments captured through SIOS track key macroeconomic variables. For this, the NRs on the parameters Overall Business Situation (OBS), Turnover (T) and Selling Price (SP) have been considered for gauging related observed macro variables, viz., Gross Value Added (GVA), Sales growth and Inflation.6 The NRs on OBS for the assessment quarter (NRA OBS) and expectations quarter (NRE OBS) mostly tracked the quarter-over-quarter (q-o-q) movement of GVA in respective sectors, viz., services and infrastructure. The NRA OBS reflects the severity of COVID-19 related lockdown better than NRE OBS, as the enterprises could not anticipate the interruption in business situation due to the sudden outbreak of the first and second wave of the pandemic (Charts 5a and 5b). Similar results were found for the NRs on Turnover for the assessment quarter (NRA T) and expectations quarter (NRE T) in tracking the q-o-q movement of sales growth in services and infrastructure sectors (Charts 6a and 6b). The sentiments on the selling price for the assessment quarter (NRA SP) and expectations quarter (NRE SP) mostly tracked the q-o-q movement of inflation in services. Further, the NRE SP captures the movement of inflation more appropriately than the NRA SP (Chart 7). 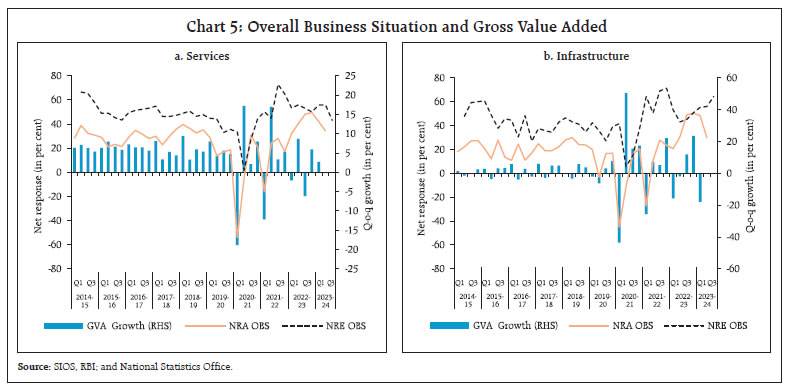 We next examine the correlation between the survey results vis-à-vis the relevant macro variables, viz., GVA growth, sales growth, and inflation. Granger causality tests are also undertaken to check the predictive power of the survey parameters for macro variables7. The analysis suggests that the NRs of the assessment quarters for the parameters OBS and turnover have a high correlation with the GVA growth and sales growth, respectively, for both services and infrastructure sectors (Table 1). Overall, NRA is found to have a higher correlation with macro variables than NRE. In the case of inflation dynamics, however, the NRE for the parameter selling price in the services sector has a higher correlation with the inflation in that sector than NRA. 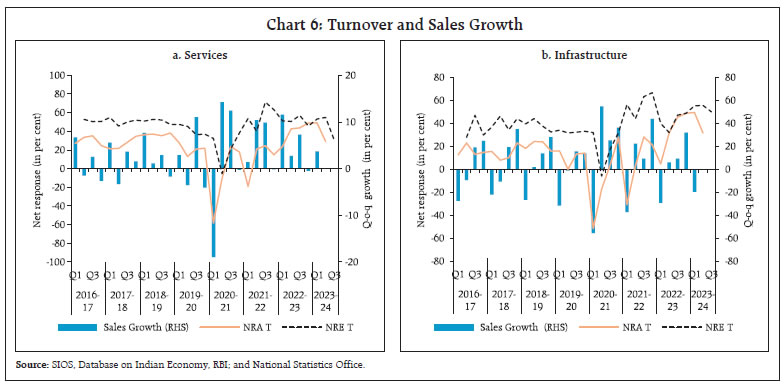
| Table 1: Correlation Between Survey Parameters and the Related Macro Variables | | Macro Variable | Survey Parameter | | Sector | Assessment (A) | Expectations (E) | | GVA growth | 1. Overall business situation | | 1.1 Services | 0.650 | 0.262 | | 1.2 Infrastructure | 0.627 | 0.154 | | Sales growth | 2. Turnover | | 2.1 Services (IT + Non-IT) | 0.523 | 0.207 | | 2.1.1 IT | 0.234 | 0.142 | | 2.1.2 Non-IT | 0.560 | 0.193 | | 2.2 Infrastructure | 0.485 | 0.149 | | Inflation | 3. Selling price | | Services | 0.325 | 0.566 | Note: Data pertaining to the COVID-19 first wave (Q1:2020-21) has been excluded.
Source: Authors’ calculations. | Pair-wise Granger causality tests have been conducted to find whether the current values of survey parameters hold predictive power for future values of macroeconomic variables. The results suggest that the survey parameters Granger-cause relevant macro variables with different lags (Table 2). | Table 2: Granger Causality Test Results between Survey Results and Related Macro Variables | | Null Hypothesis | No. of Observations | Lags | F-Statistics | p-value | | NRA of Overall Business Situation of Services sector does not Granger Cause Gross Value Added Growth of Services sector | 34 | 3 | 3.93 | 0.02 | | NRA of Overall Business Situation of Infrastructure sector does not Granger Cause Gross Value Added Growth of Infrastructure sector | 35 | 2 | 2.84 | 0.07 | | NRA of Turnover of Services sector does not Granger Cause Sales _ Growth _of Services sector | 28 | 1 | 5.66 | 0.03 | | NRA of Turnover of Infrastructure sector does not Granger Cause Sales Growth of Infrastructure sector | 26 | 3 | 3.08 | 0.05 | Note: Granger Causality on Selling Prices and inflation is not attempted given that there are only 21 data points.
Source: Authors’ Calculations. | IV. Evolution of Sentiments in Post-COVID Era After the outbreak of the COVID-19 pandemic in India during Q4:2019-20, in order to capture future expectations for a longer period of time, a block was introduced in the survey since Q1:2020-21 to get the respondents’ views on their recovery from the pandemic on critical parameters for two more subsequent quarters. The survey results of the additional block are also disseminated by the Reserve Bank in its quarterly data releases since April 2020. The parameters covered in the additional block include OBS, turnover, full and part time employment, cost of inputs and selling price. In the following section, the evolution of sentiments in response to changes in current situation in the case of three major parameters, viz., OBS, demand conditions and price situation is analysed. Overall Business Situation Services and infrastructure firms were seen to be less optimistic about the future of the overall business situation during the first wave of the pandemic. The sentiments, however, recovered swiftly, with improvements recorded in successive rounds, although some ebbing was observed during the delta wave of the pandemic. In 2022-23, the OBS of services recorded moderation and the sentiments turned less optimistic over successive rounds reflecting the impact of heightened uncertainties from the multiple shocks, especially from the Ukraine war and global monetary tightening. Sentiments on infrastructure firms, however, improved since Q3:2022-23 as the overall thrust on capital expenditure by the government provided a fillip to the sector. In the survey round conducted during Q2:2023-24, while the sentiments for Q3:2023-24 recorded a moderation, as compared with the sentiment recorded for the same quarter in the previous round, it improved in the case of infrastructure, corroborating the above discussed trend (Chart 8). Demand Conditions Various sector-specific packages and announcements by the Government and the Reserve Bank gave impetus to the services and infrastructure enterprises’ expectations on demand parameters as evident from their sentiments recovering swiftly after the first wave. But their outlook again became gloomy during the second wave in successive surveys. The job landscape, as reflected in their sentiments on full-time and part-time employment started improving, but at a slower pace than that of the turnover (Chart 9). Price Situation In the pandemic-hit economy, input cost pressures intensified for both services and infrastructure sectors due to global supply chain disruptions. This was also mirrored in firms’ expectations of higher selling price growth. However, with improvement in supply chains, input cost pressures started normalising as reflected in subsequent survey rounds. In the recent period, the net response on selling price expectation remains lower than sentiments on cost of inputs (Chart 10).
V. Conclusion Forward-looking consumer and business expectations surveys aim to extract signals about potential movements in related macro variables. In this article we examined the SIOS results and found it as an effective tool for forward looking assessment. The survey responses provide a useful lead information for comprehending the evolution of output and prices in the services and infrastructure sectors. The survey effectively captures the diversity in sentiments and the pace of activity across sectors. Despite the challenges emanating from the pandemic and the subsequent external shocks, according to survey responses, both the services and infrastructure sectors gradually rebounded as businesses reopened and restrictions eased. The perception of business entities captured by the survey indicates that despite differences in their nature of business, post-COVID, both sectors covered in the SIOS exhibited a recovery of confidence in the economy. References Banerjee, N and Majumdar, S. (2022). ‘Impact of COVID-19 on Sentiments of Indian Manufacturers’, RBI Bulletin, February. Bank of Canada,’ Business Outlook Survey’, Quarterly issue, https://www.bankofcanada.ca/publications/bos/. Banque de France, ‘Business Surveys’, Monthly issue, https://www.banque-france.fr/en/statistics/business-surveys/business-surveys. Bank of Italy, ‘Business Outlook Survey of Industrial and Service Firms’, Annual issue, https://www.bancaditalia.it/pubblicazioni/sondaggio-imprese/index.html. Federal Reserve Bank of Dallas, Monthly issue, ‘Texas Services Sector Outlook Survey’, https://www.dallasfed.org/research/surveys/tssos. Federal Reserve Bank of Richmond, Monthly issue, ‘Fifth District Survey of Service Sector Activity’, https://www.richmondfed.org/region_communities/regional_data_analysis/surveys/service_sector/about. Latey S and Majumdar, S. (2020). ‘Services and Infrastructure Outlcook Survey: Recent Trends’, RBI Bulletin, December. Reserve Bank of India (2009), “Report of the Working Group on Surveys”. https://rbi.org.in/Scripts/PublicationReportDetails.aspx?UrlPage=&ID=557
Annex I: Business Outlook Surveys Conducted by Other Countries Countries around the world conduct business outlook surveys on the services sector due to its immense importance for policy formulation purposes. Since 1993, the Bank of Italy has conducted a business outlook survey of firms, between September and October on an annual basis. The survey covers approximately 3,000 firms with 20 or more workers in industry excluding construction and 1,000 in non-financial private service firms (including firms in the wholesale and retail trade, hotels and restaurants, transport and communication companies, real-estate activities, IT, and other private services). According to the assessments of firms in industries excluding construction and in services with 20 or more employees, sales were strongly affected by the COVID-19 pandemic in the first nine months of 2020. The expectations collected during that time for the next six months were slightly positive in the industry excluding construction but remained pessimistic in services. The Federal Reserve Bank of Dallas conducts the Texas Service Sector Outlook Survey (TSSOS), which is a monthly survey of area service sector businesses. Firm executives report on how business conditions have changed for several indicators such as revenue, employment, prices, and company outlook. Respondents are also asked to report on how they perceive broader economic conditions to have changed (general business activity). During the pandemic, Texas business executives were asked supplemental questions on the impact of COVID-19 to know the extent to which their business got affected. The Banque de France conducts surveys on retail trade and on the manufacturing, services, and construction sectors based on responses from around 10,000 business leaders. These surveys are conducted via its network of regional branches. They provide an assessment of economic conditions in the month preceding the publication, together with a GDP growth forecast for the quarter. The Federal Reserve Bank of Richmond has been surveying the service sector activity since November 1993. The overall goal of the business survey is to better understand changes in business conditions across the Fifth District. The service sector survey includes questions on various aspects of their business, such as revenues, demand, number of employees, average work week, wages, and capital expenditures. The service sector firms report on changes from the previous month and also expectations for the next six months. Since the autumn of 1997, the regional offices of the Bank of Canada have conducted quarterly business outlook surveys to gather business perspectives on topics of particular interest to the Bank. Every quarter, 100 firms that reflect the diverse composition of the Canadian economy in terms of region, type of business activity, and firm size are interviewed, and they provide an informative barometer of the Canadian economic environment and leading signals of future activity. It also provides information about some important economic concepts; namely, production-capacity constraints, labour shortages, and inflation expectations.
|