by Asish Thomas George, Shelja Bhatia, Joice John and Praggya Das^ In the light of the unprecedented inflation shocks seen in recent years, Consumer Price Index (CPI) core inflation measures – exclusion-based, trimmed means, reweighted CPI, and trend CPI – for the period January 2012 to December 2023 are assessed for their desirable properties. The core inflation properties, viz., ease of communication, equality of means, lower variance, predictability, co-integration, unbiasedness and attractor conditions, were tested for the pre-COVID and full sample period. Findings suggest that exclusion-based measures of core inflation and reweighted CPI measures based on historical standard deviations and principal components, were relatively more robust to the recent inflation shocks. I. Introduction Inflation process in India has seen a drastic change since the early 2020, primarily driven by the spillovers from a series of global shocks unprecedented in recent times – that inter alia include COVID-19 and lockdowns, pent-up demand post-COVID lockdowns and the related supply-side disruptions, the conflict in Ukraine and adverse climate events. These have had a significant impact on the inflation dynamics in India, driving the headline Consumer Price Index (CPI) inflation that was close to the target rate of 4 per cent in the pre-COVID period to edge up above the upper tolerance limit of 6 per cent in 2020-21 (averaging at 6.1 per cent during June 2020-March 20211). Further, headline inflation remained above 6 per cent for three consecutive quarters and beyond beginning Q4:2021-22, thus triggering accountability procedures mandated by the Reserve Bank of India (RBI) Act. During June 2020 to March 2023, CPI inflation excluding food and fuel which abstract the volatile and transitory components from the aggregate index, also rose and remained sticky at elevated levels, with the average inflation during the period brushing 6.0 per cent. Thereafter, in 2023-24 so far, CPI inflation excluding food and fuel has seen sharp correction. Taking into account these developments, this article attempts to re-evaluate CPI core inflation measures – viz. exclusion-based, trimmed means, reweighted CPI, and trend CPI – for their desirable properties. Core inflation measures are widely used by central banks to filter out the impact of noise or volatile inflation components for a better understanding of the underlying inflation trends. While inflation targets are largely expressed in terms of headline inflation, core measures of inflation often serve as the operational guide to achieving the target rate over the medium term. This also makes core inflation the anchor for arriving at headline inflation projections. Different approaches have been used to derive measures of core or underlying inflation. These are broadly classified into the following. First, fixed exclusion-based measures, which exclude components like food and fuel which generally exhibit volatile price movements. Second, trimmed mean measures or temporary exclusion-based measures, which exclude components in the inflation distribution experiencing large relative price changes each month; and the weighted median measure, which trims all but the midpoint of the distribution of price changes (Clark, 2001). Such measures are also known as limited influence estimators of core inflation as they are designed to exclude large and influential price changes (Silver, 2006; Rich et al., 2022). Third, frequency-based exclusion measures, wherein transitory items are filtered to arrive at the persistent component of inflation (Ehrmann et al., 2018). Any measure of core inflation, for its use in monetary policy analysis as a true measure of underlying inflation trends, needs to conform to a certain set of desirable properties. To begin with, a desirable core inflation measure should be transparent in its computation and easy to communicate. In terms of its statistical properties, the measure should be more stable (or less volatile) than the headline inflation measure. Additionally, over a long period of time, the average rate of core inflation should match the average rate of headline inflation so that there is no systematic divergence between the two. This would also require that the movements in the core inflation should trace the trend rate of inflation. Accordingly, with core measures containing more information about the future trend of inflation than the headline inflation, projections of core measures should also enhance the predictability of overall or headline inflation. Given this importance of core inflation measures in informing monetary policy decisions, studies such as Eckstein, 1981; Bryan and Cecchetti, 1994; Marques et al., 2002; Schembri, 2017; and Bańbura et al., 2023, among others, have regularly attempted to evaluate the statistical performance of alternative measures of core inflation to evaluate their usefulness and adequacy. The drastic change in inflation process and its heightened volatility since 2020 across the globe has also resulted in a renewed focus on core inflation as a reliable measure of underlying inflation for the monetary policy process. Ball et al. (2021) found trimmed mean core inflation measures exhibiting the least volatility in the US during the COVID-19 period. In Canada, Khan and Sullivan (2022) finds outlier-exclusion measures of core, such as CPI-trim and CPI-median, as more reliable indicators of underlying inflation throughout the pandemic. Ball et al. (2023), based on a cross country analysis, show that weighted median inflation measures outperformed the exclusion-based measures of core inflation, even when COVID-19 period was included. Carlomagno et al. (2023) demonstrated that optimally selecting CPI components for exclusion improves core inflation measure properties, and the result was robust to the COVID-19 data period. For the Euro area, Bańbura et al. (2023) found that properties and forecasting performance are relatively better for core inflation measures of Harmonised Index of Consumer Prices (HICP) excluding energy, food, air travel-related items, clothing and footwear (HICPXX), domestic inflation measure which consists of HICP excluding energy and food (HICPX) items with low import intensity, and the persistent and common components of inflation (PCCI) measure. Core inflation studies in the context of Indian economy were initially based on the wholesale price index (WPI) (Samanta, 1999; Mohanty et al., 2000; Durai and Ramachandran, 2007; Kar, 2009; Das et al., 2009; Goyal and Pujari, 2005; Raj and Misra, 2011; Bicchal et al., 2012; Ball et al., 2016). Following the move towards CPI inflation based flexible inflation targeting (FIT) framework for monetary policy in India since 2014, which was formally adopted in 2016 with an inflation target based on the then newly released all India CPI-Combined, studies have focused on evaluating the properties of CPI based core inflation measures, with CPI-Industrial Workers (IW) and backcasted CPI-Combined series. Anand and Tulin (2016) use the backcasted CPI-Combined series based on CPI-IW to show that headline inflation does not revert to core inflation. Instead, it is core inflation that returns to headline inflation, indicating the possibility of persistent food shocks or significant second-round effects. Contrary to this, Dholakia and Kadiyala (2018) utilised CPI-Combined series to show that headline inflation tends to revert to core inflation and not otherwise. On the issue of the appropriate measure of core inflation, employing an array of core measures, which includes exclusion-based measures as well as statistical measures based on the new CPI-Combined series for the period January 2012-September 2019, Raj et al. (2020) showed that no core inflation measure satisfied all the desirable properties, though exclusion-based measures satisfied most of the desirable properties. At the same time, Sahu (2021) found that 20 per cent trimmed mean measure as a good indicator for the underlying trend in the headline inflation. Using the data for the pre-COVID period, RBI (2021) estimated that deviations in non-core components of inflation from core inflation to correct within a span of one year. Evidence of non-core components or headline influencing core were also seen, especially in the short-run, indicative of spillovers to core inflation through increased costs as well as unanchored inflation expectations. A more recent examination of the bias-adjusted weighted median measures of core inflation points towards presence of persistence in core inflation in the post-COVID era, with headline inflation converging to core inflation (Patra et al., 2023). Against this backdrop, this article formally re-examines the properties of core measures in India based on exclusion-based measures and statistical measures in line with Raj et al. (2020). This is supplemented by the inclusion of the bias-adjusted weighted median measure proposed in Ball et al. (2023) and trend measures. The paper draws on the methodology followed by Das et al. (2009) and Raj et al. (2020) to evaluate various core inflation measures and is organised into four sections. Section II provides an overview of the core inflation measures examined for analysis, along with their key stylised facts. Section III tests the various candidates of core inflation against the desirable properties. Section IV concludes the paper. II. Core Inflation – Empirical Analysis for India The distribution of CPI inflation over the last decade has witnessed considerable variations along with a sharp rise in the mean inflation rates since the 2020s as compared with the pre-COVID FIT period (Chart 1). From a low inflation phase characterised by low volatility, though exhibiting high inflation outliers in the pre-COVID period, inflation picked up along with an increase in volatility during 2020-21. However, the 2021-23 period was marked by high inflation and lower volatility, which is indicative of generalised inflation. Since April 2023 there was an easing of inflationary pressures, though food price shocks kept headline inflation volatile. Given the sharp movements in commodity prices inducing large volatility in inflation, which can even also lead to generalisation, robust measures of core inflation are critical for monetary policy to understand the durable trends in inflation, a key element in arriving at the medium-term inflation outlook and the monetary policy stance. 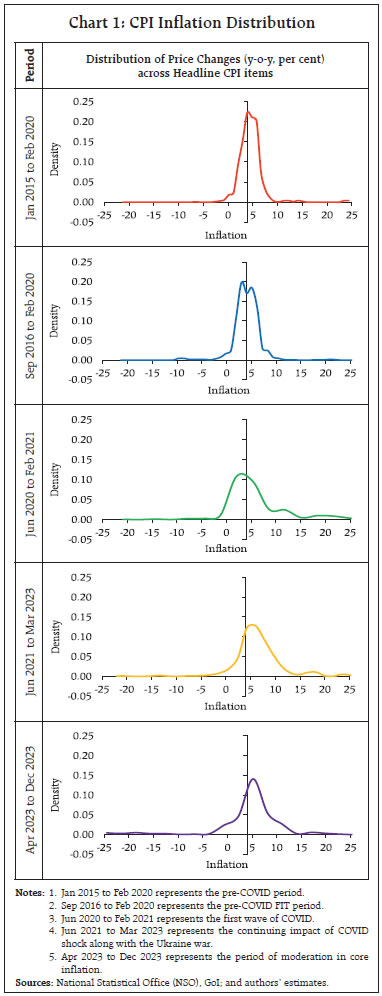 Based on the available literature the following 14 measures for core inflation (details in Annex II) are considered: Fixed Exclusion based Measures 1. CPI excluding food and fuel 2. CPI excluding food, fuel, petrol and diesel 3. CPI excluding food, fuel, petrol, diesel, gold and silver 4. CPI excluding food, fuel, petrol, diesel, gold, silver and housing Trimmed Mean Measures 5. Trimmed mean (5 per cent) 6. Trimmed mean (10 per cent) 7. Trimmed mean (20 per cent) 8. Median 9. Bias Adjusted Median Reweighted and Trend Measures (Variability based measures) 10. Historical Standard Deviation 11. Principal Component 12. Hodrick-Prescott trend (HP trend) 13. Christiano-Fitzgerald trend (CF trend) 14. Hamilton trend (Hm trend) The first four candidates are obtained by excluding the highly volatile sub-groups/items. Excluding the ‘food and fuel group’ is most common across countries to arrive at the core as it is generally the most volatile group, usually impacted by supply shocks (weather, seasonality, production shortfalls, etc.). Apart from food and fuel, some other items, viz., petrol and diesel (which belong to the transport sub-group in CPI), and gold and silver (which belong to the personal care and effects sub-group) are also found to be highly volatile in the Indian context. Housing also may show considerable price variations, especially in times of revision of imputed house rentals for accommodation provided by the Government and the public sector. The next set of five core inflation measures (5 to 9) have been computed using trimming of CPI inflation distribution; and the last set of measures (10 to 14) have been computed by either re-weighting CPI indices based on historical volatility or by estimating the trend component of CPI inflation. The historical standard deviation-based core measure and the ones derived based on statistical filters are proximate alternatives to core measures estimated based on the persistence in components of inflation. Monthly CPI item level data (base 2012=100) for the period January 2012 to December 2023 were used for the study. Since the CPI item level inflation data (base 2012=100) is available only from January 2015, the CPI item level data for the base years 2012 and 2010 were spliced to obtain CPI item level time series data from 2012. In the current series, the published headline index numbers do not always match with the ones arrived from aggregation of item level indices (Das and George, 2023). For the purpose of this study, item level CPI was adjusted to derive the headline CPI inflation from aggregation of items, consistent with published headline CPI inflation. The adjustment assumes importance as it enables an accurate and consistent assessment of the desirable properties of various core inflation measures since the distortion caused due to the aggregation method is taken care of. Various core inflation measures obtained using the above approach for the study period experienced relatively lower peaks and troughs (Chart 2). 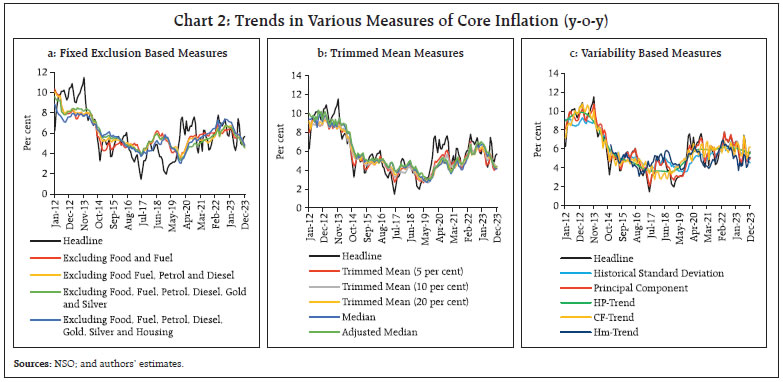 Since core measures are meant to filter out transitory movements in headline inflation, a good measure should be relatively stable over time and hence less volatile. All the core measures exhibited lower volatility than the headline measure (Chart 3). Between January 2012 and December 2023, the various core inflation measures considered were seen to largely follow the same trend. The average core inflation across various measures was in the range of 4.99 per cent to 5.99 per cent. Among the core inflation measures, higher volatility was observed in the trimmed mean, reweighted and trend core inflation measures vis-à-vis fixed exclusion-based measures. There were instances where headline inflation fell below core inflation for certain periods, attesting to the considerable impact of favourable food price dynamics and relative price shocks on headline inflation (Table 1). 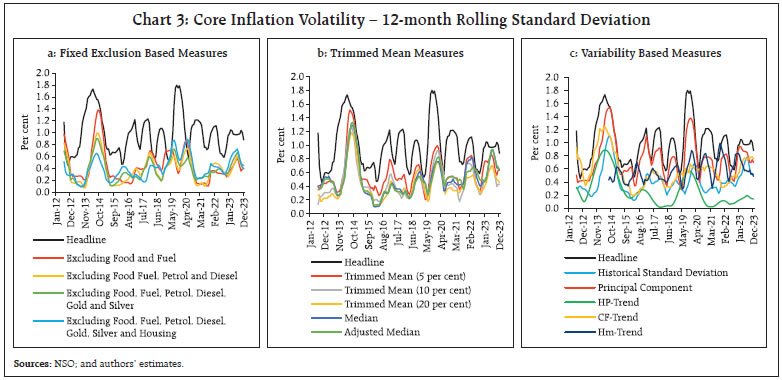
| Table 1: CPI Core Inflation Measures – Summary Statistics | | Headline and Core Measures | Wt. in CPI | Pre-COVID Sample
(Jan 2012 to Feb 2020) | Full Sample
(Jan 2012 to Dec 2023) | | Mean | Std. Dev. | Min | Max | Mean | Std. Dev. | Min | Max | | CPI Headline | 100 | 5.88# | 2.64 | 1.46 | 11.51 | 5.91 | 2.25 | 1.46 | 11.51 | | Fixed Exclusion Based Measures | | | | | | | | | | | 1. Excluding Food and Fuel | 47.3 | 5.90 | 1.74 | 3.47 | 10.34 | 5.87 | 1.46 | 3.47 | 10.34 | | 2. Excluding Food, Fuel and Petrol & Diesel | 45.0 | 6.07 | 1.66 | 3.67 | 10.09 | 5.95 | 1.42 | 3.67 | 10.09 | | 3. Excluding Food, Fuel, Petrol & Diesel and Gold & Silver | 43.8 | 6.10 | 1.67 | 3.33 | 9.58 | 5.92 | 1.46 | 3.33 | 9.58 | | 4. Excluding Food Fuel, Petrol & Diesel, Gold & Silver and Housing | 33.7 | 5.78 | 1.49 | 3.04 | 8.87 | 5.85 | 1.32 | 3.04 | 8.87 | | Trimmed Mean Measures | | | | | | | | | | | 5. Trimmed Mean (5 per cent) | | 5.62 | 2.23 | 2.66 | 9.72 | 5.54 | 1.89 | 2.66 | 9.72 | | 6. Trimmed Mean (10 per cent) | | 5.64 | 2.21 | 2.66 | 9.49 | 5.53 | 1.86 | 2.66 | 9.49 | | 7. Trimmed Mean (20 per cent) | | 5.73 | 2.15 | 2.82 | 9.29 | 5.53 | 1.84 | 2.82 | 9.29 | | 8. Median | | 5.94 | 2.28 | 2.72 | 9.99 | 5.68 | 1.99 | 2.72 | 9.99 | | 9. Bias-Adjusted Median | | 6.13 | 2.33 | 3.02 | 10.34 | 5.87 | 2.01 | 3.02 | 10.34 | | Reweighted and Trend Measures | | | | | | | | | | | 10. Historical Standard Deviation | | 5.94 | 1.97 | 3.46 | 9.28 | 5.84 | 1.67 | 3.46 | 9.28 | | 11. Principal Component | | 5.96 | 2.45 | 2.11 | 10.76 | 5.99 | 2.07 | 2.11 | 10.76 | | 12. Hodrick-Prescott trend | | 5.89 | 2.32 | 3.58 | 9.88 | 5.91 | 1.91 | 3.58 | 9.88 | | 13. Christiano-Fitzgerald trend | | 5.87 | 2.41 | 2.78 | 10.77 | 5.90 | 2.01 | 2.80 | 10.78 | | 14. Hamilton trend* | | 4.73 | 0.71 | 3.11 | 6.44 | 4.99 | 0.80 | 3.26 | 7.03 | Notes: *: Hamilton trend CPI inflation was computed based on 36-month lag.
#: Headline CPI inflation during the pre-COVID FIT period (Oct-16 to Mar-20) was 3.9 per cent.
Sources: NSO; and author’s calculations.. | III. Properties and Performance of Various Candidates of Core Inflation As mentioned above, a measure of core inflation must adhere to certain desirable properties to serve as a reliable indicator of underlying inflation trends in the context of monetary policy analysis. These properties, which include ease of communication, equality of means, lower volatility, unbiasedness, predictability, co-integration and attraction condition, are tested for the various core measures in this section. III.1. Ease of Communication A major criterion for a good measure of core inflation is that it should possess qualities of timeliness, credibility (i.e., independent agents should be able to verify these) and ease of comprehension by the general public (Roger, 1998). By construct, the exclusion-based core inflation measures satisfy these criteria better as compared to the statistical measures as the former can be readily verified by the independent agents and are easier to communicate. III.2. Equality of Means and Lower Variance A necessary condition of a good core inflation measure is that it should, on average, closely align with the headline inflation while exhibiting lower variability (Clark, 2001). This can be tested by checking whether (a) the means of headline and core inflation are statistically similar; and (b) the variability of the core inflation is statistically lower than the headline inflation. (a) Test of Equality of Means The standard t-tests for checking the equality of the means of the headline inflation series and different candidates of core inflation measures were conducted. In the pre-COVID period, all core inflation measures satisfied the equality of means criterion. This is consistent with the results obtained by Raj et al. (2020). Expanding the sample to cover the period since June 2020, the results are still seen to hold, indicating that even after accounting for the shocks of COVID-19 and Ukraine war in 2022, core inflation rates (on an average), derived from these various measures, were not statistically different from those of headline (Table 2). (b) Variance Ratio Test As per this criterion, core inflation should have lower variance than the headline. Table 3 presents the ratio of variances and p-values corresponding to the hypothesis of lower variance of the core inflation series using F-test. For the pre-COVID period, the fixed exclusion based core measures, trimmed mean measures (barring bias-adjusted median), historical standard deviation measure and the Hamilton trend CPI inflation measure satisfied this criterion. For the full sample period (January 2012 to December 2023) the principal component and the Christiano-Fitzgerald trend inflation measures, the weighted median and the bias-adjusted median did not significantly satisfy the criteria of lower variance than the headline inflation series. | Table 2. Equality of Means | | Core Measures | Pre-COVID
(Jan 2012 to Feb 2020) | Full Sample
(Jan 2012 to Dec 2023) | | Difference* in Mean | p-value@ | Remarks | Difference* in Mean | p-value@ | Remarks | | Fixed Exclusion Based Measures | | | | | | | | 1. Excluding Food and Fuel | -0.022 | 0.944 | Satisfied | 0.044 | 0.844 | Satisfied | | 2. Excluding Food, Fuel and Petrol & Diesel | -0.195 | 0.537 | Satisfied | -0.039 | 0.860 | Satisfied | | 3. Excluding Food, Fuel, Petrol & Diesel and Gold & Silver | -0.229 | 0.469 | Satisfied | -0.005 | 0.983 | Satisfied | | 4. Excluding Food Fuel, Petrol & Diesel, Gold & Silver and Housing | 0.094 | 0.759 | Satisfied | 0.064 | 0.768 | Satisfied | | Trimmed Mean Measures | | | | | | | | 5. Trimmed Mean (5 per cent) | 0.256 | 0.465 | Satisfied | 0.375 | 0.127 | Satisfied | | 6. Trimmed Mean (10 per cent) | 0.236 | 0.499 | Satisfied | 0.385 | 0.116 | Satisfied | | 7. Trimmed Mean (20 per cent) | 0.141 | 0.683 | Satisfied | 0.384 | 0.114 | Satisfied | | 8. Median | -0.071 | 0.840 | Satisfied | 0.235 | 0.348 | Satisfied | | 9. Bias-Adjusted Median | -0.252 | 0.480 | Satisfied | 0.036 | 0.885 | Satisfied | | Reweighted and Trend Measures | | | | | | | | 10. Historical Standard Deviation | -0.058 | 0.861 | Satisfied | 0.073 | 0.754 | Satisfied | | 11. Principal Component | -0.081 | 0.824 | Satisfied | -0.076 | 0.767 | Satisfied | | 12. Hodrick-Prescott trend | 0.000 | 1.000 | Satisfied | 0.000 | 1.000 | Satisfied | | 13. Christiano-Fitzgerald trend | 0.016 | 0.964 | Satisfied | 0.007 | 0.976 | Satisfied | | 14. Hamilton trend | 0.000 | 1.000 | Satisfied | 0.000 | 1.000 | Satisfied | Notes: * Headline inflation minus core inflation
@: Test of equality of means based on t-test with H0 : μ1 = μ2 Vs H1 : μ1 ≠ μ2 where μ1 and μ2 are means of headline inflation and core inflation, respectively.
Source: Authors’ estimates |
| Table 3. Variance Ratio Test | | Core Measures | Pre-COVID
(Jan 2012 to Feb 2020) | Full Sample
(Jan 2012 to Dec 2023) | | Ratio@ of SD | p-value# | Remarks | Ratio@ of SD | p-value# | Remarks | | Fixed Exclusion Based Measures | | | | | | | | 1. Excluding Food and Fuel | 1.522 | 0.000 | Satisfied* | 1.543 | 0.000 | Satisfied* | | 2. Excluding Food, Fuel and Petrol & Diesel | 1.591 | 0.000 | Satisfied* | 1.587 | 0.000 | Satisfied* | | 3. Excluding Food, Fuel, Petrol & Diesel and Gold & Silver | 1.583 | 0.000 | Satisfied* | 1.539 | 0.000 | Satisfied* | | 4. Excluding Food Fuel, Petrol & Diesel, Gold & Silver and Housing | 1.775 | 0.000 | Satisfied* | 1.704 | 0.000 | Satisfied* | | Trimmed Mean Measures | | | | | | | | 5. Trimmed Mean (5 per cent) | 1.183 | 0.050 | Satisfied*** | 1.189 | 0.039 | Satisfied** | | 6. Trimmed Mean (10 per cent) | 1.198 | 0.038 | Satisfied** | 1.208 | 0.025 | Satisfied** | | 7. Trimmed Mean (20 per cent) | 1.228 | 0.022 | Satisfied** | 1.222 | 0.018 | Satisfied** | | 8. Median | 1.159 | 0.074 | Satisfied*** | 1.132 | 0.138 | Not Satisfied | | 9. Bias-Adjusted Median | 1.137 | 0.104 | Not Satisfied | 1.119 | 0.182 | Not Satisfied | | Reweighted and Trend Measures | | | | | | | | 10. Historical Standard Deviation | 1.344 | 0.002 | Satisfied * | 1.349 | 0.000 | Satisfied* | | 11. Principal Component | 1.078 | 0.461 | Not Satisfied | 1.086 | 0.323 | Not Satisfied | | 12. Hodrick-Prescott trend | 1.131 | 0.229 | Not Satisfied | 1.177 | 0.053 | Satisfied*** | | 13. Christiano-Fitzgerald trend | 1.096 | 0.371 | Not Satisfied | 1.119 | 0.179 | Not Satisfied | | 14. Hamilton trend | 3.445 | 0.001 | Satisfied * | 2.828 | 0.000 | Satisfied* | Notes: @ Headline inflation over core inflation.
# Test of equality of variance based on F-test with H0 : σ21 = σ22 Vs H1 : σ21 > σ22 where σ21 and σ22 are variances of headline inflation and core inflation, respectively.
***: at 10 per cent level of significance. **: at 5 per cent level of significance. *: at 1 per cent level of significance.
Source: Authors’ estimates | III.3. Inflation Predictability Another desirable property of a core inflation measure, suggested by Cecchetti and Moessner (2008), is that a good core inflation series should predict future changes in inflation by the right magnitude. This is empirically examined by the inflation-prediction test suggested by Cogley (2002), and Dholakia and Kadiyala (2018). If πc(t) is the core inflation, π(t) is headline inflation and u(t) is the error term at time period t, then for any sufficiently large time horizon H, the regression: should satisfy α = 0 and β = -1, implying that deviation in inflation between headline and core should be inversely related to future changes in headline inflation. If the slope coefficient is less (greater) than one in absolute terms, it suggests that the measure of core inflation is over (under) predicting the magnitude of subsequent changes in inflation. As in Raj et al. (2020), the predictability is tested for the forecasting horizon of six months, i.e., H = 6. For the pre-COVID period, there was evidence of a negative β coefficient for all the core inflation measures considered. However, the exclusion-based core inflation measures could not satisfy the joint hypothesis (i.e. α = 0 and β = -1) in equation (1). Raj et al. (2020) also obtained a similar result and attributed it to the unusually low and persistent food inflation during the sample period. Most of the trimmed means and the historical standard deviation and other trend inflation measures satisfied the predictability property, while the bias-adjusted median measure did not satisfy it (Table 4). Table 4. Predictability for Pre-COVID period
(Jan 2012 to Feb 2020) | | Core Measures | α | β | Test@ α = 0 and β = -1 | Remarks | | Fixed Exclusion Based Measures | | | | | | 1. Excluding Food and Fuel | -0.268 | -0.485 | 0.000 | Not Satisfied | | 2. Excluding Food, Fuel and Petrol & Diesel | -0.383 | -0.582 | 0.000 | Not Satisfied | | 3. Excluding Food Fuel, Petrol & Diesel and Gold & Silver | -0.412 | -0.568 | 0.000 | Not Satisfied | | 4. Excluding Food Fuel, Petrol & Diesel, Gold & Silver and Housing | -0.221 | -0.509 | 0.000 | Not Satisfied | | Trimmed Mean Measures | | | | | | 5. Trimmed Mean (5 per cent) | -0.073 | -0.785 | 0.627 | Satisfied** | | 6. Trimmed Mean (10 per cent) | -0.108 | -0.764 | 0.380 | Satisfied** | | 7. Trimmed Mean (20 per cent) | -0.192 | -0.760 | 0.213 | Satisfied** | | 8. Median | -0.344 | -0.680 | 0.012 | Satisfied* | | 9. Bias-Adjusted Median | -0.497 | -0.749 | 0.001 | Not Satisfied | | Reweighted and Trend Measures | | | | | | 10. Historical Standard Deviation | -0.336 | -0.766 | 0.031 | Satisfied* | | 11. Principal Component | -0.271 | -0.574 | 0.110 | Satisfied** | | 12. Hodrick-Prescott trend | -0.258 | -1.290 | 0.024 | Satisfied* | | 13. Christiano-Fitzgerald trend | -0.231 | -1.180 | 0.167 | Satisfied** | | 14. Hamilton trend | -0.067 | -1.098 | 0.857 | Satisfied** | Note: @: p-values are reported; ** at 5 per cent level of significance and * at 1 per cent level of significance.
Source: Authors’ estimates. | Extending the data to cover the period since the outbreak of COVID-19 in 2020, all the exclusion-based measures and the trimmed measures (barring 5 per cent trimmed mean) failed to satisfy the predictability test. Though the β coefficients were seen to be negative (indicating the predictive power of core inflation for determining the headline inflation), the joint hypothesis of α = 0 and β = -1 in equation (1) was not satisfied. On the other hand, the trend core inflation measures satisfied the predictability conditions. In contrast to the pre-COVID period, the multiple adverse supply shocks and the resultant high food inflation in the recent years also contributed to some persistence in headline inflation even as core inflation moderated (Patra et al., 2024). This could have caused the weakening of the predictive power of some core measures in explaining headline inflation movements (Table 5). Table 5. Predictability – Full Sample
(Jan 2012 to Dec 2023) | | Core Measures | α | β | Test@ α = 0 and β = -1 | Remarks | | Fixed Exclusion Based Measures | | | | | | 1. Excluding Food and Fuel | -0.121 | -0.470 | 0.000 | Not Satisfied | | 2. Excluding Food, Fuel and Petrol & Diesel | -0.160 | -0.508 | 0.000 | Not Satisfied | | 3. Excluding Food Fuel, Petrol & Diesel and Gold & Silver | -0.146 | -0.466 | 0.000 | Not Satisfied | | 4. Excluding Food Fuel, Petrol & Diesel, Gold & Silver and Housing | -0.107 | -0.452 | 0.000 | Not Satisfied | | Trimmed Mean Measures | | | | | | 5. Trimmed Mean (5 per cent) | -0.086 | -0.639 | 0.035 | Satisfied* | | 6. Trimmed Mean (10 per cent) | -0.079 | -0.584 | 0.002 | Not Satisfied | | 7. Trimmed Mean (20 per cent) | -0.053 | -0.522 | 0.000 | Not Satisfied | | 8. Median | -0.052 | -0.400 | 0.000 | Not Satisfied | | 9. Bias-Adjusted Median | -0.133 | -0.441 | 0.000 | Not Satisfied | | Reweighted and Trend Measures | | | | | | 10. Historical Standard Deviation | -0.103 | -0.611 | 0.003 | Not Satisfied | | 11. Principal Component | -0.196 | -0.662 | 0.124 | Satisfied** | | 12. Hodrick-Prescott trend | -0.141 | -1.130 | 0.204 | Satisfied** | | 13. Christiano-Fitzgerald trend | -0.112 | -1.032 | 0.605 | Satisfied** | | 14. Hamilton trend | 0.011 | -0.678 | 0.019 | Satisfied** | Notes: @: p-values are reported.
** at 5 per cent level of significance and *at 1 per cent level of significance.
Source: Authors’ estimates. | III.4. Convergence Marques et al. (2003), using cointegration and vector-error correction models (VECM), presented a set of testable properties for a good core inflation measure. In this cointegration framework (when both core and headline are non-stationary), a good core inflation measure should statistically show the following properties: first, core inflation and headline inflation should be co-integrated; second, core inflation measure should be unbiased with respect to the headline inflation; and third, in the short-run, core inflation should cause headline, while the reverse should not be true. III.4.1: Cointegration and Unbiasedness First, we test for cointegration between core and headline inflation. Furthermore, if there is long-run cointegration, the core inflation measure should be unbiased with respect to π(t), i.e., when there are no shocks, π(t) = πc (t). For gauging the unbiasedness property, Marques et al. (2003) proposed a test for β = 1 in the cointegrating equation (2) when α = 0. III.4.2: Attractor Conditions In the short run, if headline and core inflation deviates, there should exist an error correction mechanism wherein headline inflation adjusts to core inflation trends. This implies that in the error correction process, core inflation is strongly exogenous (with respect to headline), but headline is not; or when there are episodes of divergence between headline and core inflation, a good core measure should be an attractor of headline inflation that results in headline inflation converging to core inflation over the long run (Figueiredo et al., 2002). This property is distinct from the predictability condition. In the evaluation criterion based on Marques et al. (2003), the emphasis is not on the predictive power of core inflation measure to explain future headline inflation movements fully in the short to medium term, but on the long-run equilibrium relationship between headline and core inflation. The attractor condition can be tested in an error correction framework as follows:  However, this condition should not apply in the opposite direction, that is, the core measure should not be attracted by inflation (4). Thus πc (t) needs to be strongly exogenous. The results of the tests for convergence of headline to core inflation are given below. III.4.3: Testing Cointegration and Unbiasedness In the pre-COVID sample period, all the core inflation series are found to be non-stationary with null hypothesis of unit root not getting rejected. Johannsen tests of co-integrating long-run relationship between core and headline inflation was satisfied for all exclusion-based and trimmed mean measures.2 It was also satisfied for the historical standard deviation weighted CPI core inflation measure. Among trend measures, while cointegration was observed for principal component and Hodrick-Prescott trend, it was not satisfied for Christiano-Fitzgerald and Hamilton trend measures (Table 6). For the full period sample also, the test of cointegration was satisfied by all exclusion and trimmed-mean-based measures, along with historical standard deviation and principal component-based measures. | Table 6. Cointegration | | Core Measures | Pre-COVID
(Jan 2012 to Feb 2020) | Full Sample
(Jan 2012 to Dec 2023) | | ADF test on πc (t)$ | Test of Cointegration@ | Remarks | ADF test on πc (t)$ | Test of Cointegration@ | Remarks | | Fixed Exclusion Based Measures | | | | | | | | 1. Excluding Food and Fuel | 0.156 | 2.925 | Satisfied | 0.036 | 6.627& | Satisfied | | 2. Excluding Food Fuel and Petrol & Diesel | 0.181 | 3.008 | Satisfied | 0.041 | 6.588& | Satisfied | | 3. Excluding Food Fuel, Petrol & Diesel and Gold & Silver | 0.437 | 2.261 | Satisfied | 0.126 | 3.555 | Satisfied | | 4. Excluding Food Fuel, Petrol & Diesel, Gold & Silver and Housing | 0.789 | 1.785 | Satisfied | 0.340 | 3.467 | Satisfied | | Trimmed Mean Measures | | | | | | | | 5. Trimmed Mean (5 per cent) | 0.420 | 2.655 | Satisfied | 0.229 | 5.467& | Satisfied | | 6. Trimmed Mean (10 per cent) | 0.850 | 2.169 | Satisfied | 0.356 | 3.234 | Satisfied | | 7. Trimmed Mean (20 per cent) | 0.352 | 1.870 | Satisfied | 0.186 | 3.230 | Satisfied | | 8. Median | 0.882 | 2.254 | Satisfied | 0.409 | 3.527 | Satisfied | | 9. Bias-Adjusted Median | 0.661 | 2.456 | Satisfied | 0.441 | 4.699& | Satisfied | | Reweighted and Trend Measures | | | | | | | | 10. Historical Standard Deviation | 0.454 | 2.172 | Satisfied | 0.282 | 3.219 | Satisfied | | 11. Principal Component | 0.442 | 3.130 | Satisfied | 0.276 | 4.160& | Satisfied | | 12. Hodrick-Prescott trend | 0.317 | 6.736& | Satisfied | 0.018 | 17.604 | Not-Satisfied | | 13. Christiano-Fitzgerald trend | 0.680 | 24.291 | Not-Satisfied | 0.611 | 32.299 | Not-Satisfied | | 14. Hamilton trend | 0.388 | 8.077 | Not-Satisfied | 0.017 | 10.352& | Not-Satisfied | Notes: $: MacKinnon approximate p-value for the Augmented Dickey Fuller Test is given, with null hypotheses of unit root;
@: Johanssen test based on trace statistics for rank=1; 5% critical value (CV) is 3.76.
&: Including a restricted constant in the model; 5% CV is 9.42.
If the test statistic is higher than the CV, the variables are not cointegrated.
Source: Authors’ estimates. | For the pre-COVID period, all the core inflation measures that were seen to be cointegrated satisfied the unbiasedness property (Table 7). The same results were observed when the sample period was extended till December 2023. III.4.4: Testing Attractor Conditions For the pre-COVID period, the attractor conditions are satisfied for all exclusion-based and the historical standard deviation-based core measures. However, it was not satisfied for the trimmed mean and most of the trend-based measures. These results are broadly in alignment with Raj et al. (2020)3. All the exclusion-based measures satisfied the attractor condition when the sample period was extended till December 2023. In case of the trimmed mean-based measures, for the full sample period, the attractor conditions were not satisfied for any, barring the 5 per cent one. Historical standard deviation-based and principal component-based measures of core inflation also satisfied attractor conditions (Table 8). | Table 7. Unbiasedness | | Core Measures | Pre-COVID
(Jan 2012 to Feb 2020) | Full Sample
(Jan 2012 to Dec 2023) | | β | Remarks# | β | Remarks# | | Fixed Exclusion Based Measures | | | | | | 1. Excluding Food and Fuel | 1.105 | Satisfied* | 1.075 | Satisfied* | | 2. Excluding Food Fuel and Petrol & Diesel | 1.071 | Satisfied* | 1.065 | Satisfied* | | 3. Excluding Food, Fuel, Petrol & Diesel and Gold & Silver | 1.060 | Satisfied* | 1.068 | Satisfied* | | 4. Excluding Food Fuel, Petrol & Diesel, Gold & Silver and Housing | 1.101 | Satisfied* | 1.060 | Satisfied* | | Trimmed Mean Measures | | | | | | 5. Trimmed Mean (5 per cent) | 1.090 | Satisfied* | 1.095 | Satisfied* | | 6. Trimmed Mean (10 per cent) | 1.107 | Satisfied* | 1.105 | Satisfied* | | 7. Trimmed Mean (20 per cent) | 1.114 | Satisfied* | 1.110 | Satisfied* | | 8. Median | 1.055 | Satisfied* | 1.081 | Satisfied* | | 9. Bias-Adjusted Median | 1.039 | Satisfied* | 1.048 | Satisfied* | | Reweighted and Trend Measures | | | | | | 10. Historical Standard Deviation | 1.092 | Satisfied* | 1.067 | Satisfied* | | 11. Principal Component | 1.014 | Satisfied* | 1.004 | Satisfied* | | 12. Hodrick-Prescott trend | 0.985 | Satisfied* | @ | @ | | 13. Christiano-Fitzgerald trend | @ | @ | @ | @ | | 14. Hamilton trend | @ | @ | @ | @ | Notes: #: Test the hypothesis of β = 1, when α = 0 in (2)
*: at 1 per cent level of significance.
@: Did not estimate since there was no statistically significant evidence of cointegration.
Source: Authors’ estimates. | IV. Conclusion In the backdrop of large adverse supply-side shocks to inflation process since 2020, brought about by COVID-19, the war in Ukraine and adverse climatic events, the study examined the properties of various CPI core inflation measures for their suitability in capturing underlying inflation movements. The findings of the study reveal that the properties of various core inflation measures largely held up vis-à-vis the pre-COVID period. The multiple supply side shocks, particularly food price and energy price shocks, however, have led to some degree of persistence in headline inflation. This has caused spillovers from non-core to core inflation weakening some properties of core inflation, particularly with respect to the predictability criterion, although in the long-run, non-core inflation still converges to core inflation. Properties of the exclusion-based and reweighted CPI-based (derived from historical standard deviations or principal component) measures of core inflation broadly remained unchanged even in the presence these shocks, attesting to their robustness. | Table 8: Attractor Conditions | | Core Measures | Pre-COVID
(Jan 2012 to Feb 2020) | Full Sample
(Jan 2012 to Dec 2023) | | Core does not cause Head-line% | Head-line does not cause Core# | Remarks | Core does not cause Head-line% | Head-line does not cause Core# | Remarks | | Fixed Exclusion Based Measures | | | | | | | | 1. Excluding Food and Fuel | 0.026 | 0.135 | Satisfied* | 0.013 | 0.140 | Satisfied* | | 2. Excluding Food Fuel and Petrol & Diesel | 0.020 | 0.214 | Satisfied* | 0.005 | 0.088 | Satisfied* | | 3. Excluding Food Fuel, Petrol & Diesel and Gold & Silver | 0.015 | 0.154 | Satisfied* | 0.006 | 0.051 | Satisfied* | | 4. Excluding Food Fuel, Petrol & Diesel, Gold & Silver and Housing | 0.003 | 0.093 | Satisfied* | 0.004 | 0.051 | Satisfied* | | Trimmed Mean Measures | | | | | | | | 5. Trimmed Mean (5 per cent) | 0.097 | 0.008 | Not Satisfied | 0.014 | 0.058 | Satisfied* | | 6. Trimmed Mean (10 per cent) | 0.033 | 0.000 | Not Satisfied | 0.003 | 0.009 | Not Satisfied | | 7. Trimmed Mean (20 per cent) | 0.034 | 0.000 | Not Satisfied | 0.008 | 0.000 | Not Satisfied | | 8. Median | 0.039 | 0.000 | Not Satisfied | 0.022 | 0.002 | Not Satisfied | | 9. Bias-Adjusted Median | 0.012 | 0.000 | Not Satisfied | 0.021 | 0.001 | Not Satisfied | | Reweighted and Trend Measures | | | | | | | | 10. Historical Standard Deviation | 0.011 | 0.005 | Not Satisfied | 0.009 | 0.151 | Satisfied* | | 11. Principal Component | 0.065 | 0.005 | Not Satisfied | 0.005 | 0.327 | Satisfied* | | 12. Hodrick-Prescott trend | 0.000 | 0.000 | Not Satisfied | @ | @ | @ | | 13. Christiano-Fitzgerald trend | @ | @ | @ | @ | @ | @ | | 14. Hamilton trend | @ | @ | @ | @ | @ | @ | Notes: %: p-value of the test of joint hypothesis of all ηjs = 0 and λ = 0 in (3)
#: p-value of the test of joint hypothesis of all δj s = 0 and λ= 0 in (4)
*: at 5 per cent level of significance.
@: Did not estimate since there was no statistically significant evidence of cointegration.
Source: Authors’ estimates. | References Anand, R. & Tulin, V. (2016) Food Inflation in India: What Role for Monetary Policy. In Anand, R. & Cashin, P. (2016) (Eds.), Taming Indian Inflation. International Monetary Fund. Apel, M., & Jansson, P. (1999). A Parametric Approach for Estimating Core Inflation and Interpreting the Inflation Process. BIS Review. Ball, L. M., Carvalho, C., Evans, C., & Ricci, L. A. (2023). Weighted Median Inflation Around the World: A Measure of Core Inflation (No. w31032). National Bureau of Economic Research. Ball, L., Chari, A., & Mishra, P. (2016). Understanding Inflation in India (No. w22948). National Bureau of Economic Research. Ball, L. M., Leigh, D., Mishra, P., & Spilimbergo, A. (2021). Measuring US Core Inflation: The Stress Test of COVID-19 (No. w29609). National Bureau of Economic Research. Bańbura, Marta, Elena Bobeica, Katalin Bodnár, Bruno Fagandini, Peter Healy and Joan Paredes (2023). Underlying Inflation Measures: An Analytical Guide for The Euro Area. ECB Economic Bulletin, Issue 5/2023. Bicchal, Motilal and Sharma, Naresh Kumar and Kamaiah, B. (2012). Some Measures of Core Inflation for India (November 6, 2012). The IUP Journal of Applied Economics, Vol. XI, No. 3, pp. 22-64, July. Blinder, A. S. (1997), Commentary, Federal Reserve Bank of St. Louis Review, Vol. May-June, 157-160. Bryan, M. F. and Cecchetti, S. G. (1994). Measuring Core Inflation. In N. Gregory Mankiw (ed.), Monetary Policy (Chicago: University of Chicago Press for NBER), 195-215. Bryan, M. F., & Cecchetti, S. G. (1993). The Consumer Price Index as a Measure of Inflation (No. w4505). National Bureau of Economic Research. Bryan, M. F., & Pike, C. J. (1991). Median Price Changes: An Alternative Approach to Measuring Current Monetary Inflation. Federal Reserve Bank of Cleveland Economic Commentary, 1. Bryan, M. F., Cecchetti, S. G., & II, R. L. W. (1997). Efficient Inflation Estimation (No. w6183). National Bureau of Economic Research. Carlomagno, G., Fornero, J., & Sansone, A. (2023). A Proposal for Constructing and Evaluating Core Inflation Measures. Latin American Journal of Central Banking, 4(3), 100094. Cecchetti, S. G., & Moessner, R. (2008). Commodity Prices and Inflation Dynamics. BIS Quarterly Review, 55-66. Clark, T. E. (2001). Comparing Measures of Core Inflation. Economic Review-Federal Reserve Bank of Kansas City, 86(2), 5-32. Cogley, T. (2002). A Simple Adaptive Measure of Core Inflation. Journal of money, credit and banking, 94-113. Das, A., John, J., & Singh, S. (2009). Measuring Core Inflation in India. Indian Economic Review, 247-273. Das, P. and George, A. T. (2023). Consumer Price Index: The Aggregation Method Matters, RBI Bulletin, Vol. 77(3). Dholakia, R. H., & Kadiyala, V. S. (2018). Changing Dynamics of Inflation in India. Economic & Political Weekly, 65-73. Durai, S. R. S., & Ramachandran, M. (2007). Core Inflation for India. Journal of Asian Economics, 18(2), 365-383. Eckstein, O. (1981). Core Inflation (Vol. 121). Englewood Cliffs, NJ: Prentice-Hall. Ehrmann, Michael, Gianluigi Ferrucci, Michele Lenza and Derry O’Brien (2018). Measures of Underlying Inflation for the Euro Area. ECB Economic Bulletin, Issue 4/2018. Figueiredo, F. M. R., & Staub, R. B. (2002). Evaluation and Combination of Core Inflation Measures for Brazil. Central Bank of Brazil, Research Department. Goyal, A., & Pujari, A. K. (2005). Analyzing Core Inflation in India: A Structural VAR Approach. The IUP Journal of Monetary Economics, 3(2), 76-90. Kar, S. (2009). Statistical Tools as Measures of Core Inflation for India. Indian Economic Review, 225-245. Khan, M., & Sullivan, E. (2022). Core Inflation over the COVID-19 Pandemic (No. 2022-17). Bank of Canada. Marques, C. R., Neves, P. D., & Sarmento, L. M. (2003). Evaluating Core Inflation Indicators. Economic modelling, 20(4), 765-775. Mishkin, F. S. (2007). Headline versus Core Inflation in the Conduct of Monetary Policy. Business Cycles, International Transmission and Macroeconomic Policies Conference, HEC Montreal, Montreal, Canada, October. Mohanty, D., Rath, D. P., & Ramaiah, M. (2000). Measures of Core Inflation for India. Economic and Political Weekly, 273-282. Patra, M. D., John, J., & George, A. T. (2023). Recent Regime Reversal in Inflation: The Indian Experience, RBI Bulletin, Vol. 77(4). Patra, M. D., John, J., & George, A. T. (2024). Are Food Prices the ‘True’ Core of India’s Inflation?, RBI Bulletin, Vol. 78(1). Raj, J., Misra, S., George, A. T., & John, J. (2020). Core Inflation Measures in India: An Empirical Evaluation using CPI Data. Reserve Bank of India, Working Paper, Vol. 5. Raj, J., & Misra, S. (2011). Measures of Core Inflation in India–An Empirical Evaluation. Reserve Bank of India Occasional Paper, 32(3), 37-66. RBI (2021). Report on Currency and Finance, Reserve Bank of India. Rich, R. W., & Steindel, C. (2007). A Comparison of Measures of Core Inflation. Economic Policy Review, 13(3). Rich, R., Verbrugge R., Zaman, S. (2022). Adjusting Median and Trimmed-Mean Inflation Rates for Bias Based on Skewness, Economic Commentary, Federal Reserve bank of Cleveland, March, 2022-05, 1-7. Roger, S. (1998). Core Inflation: Concepts, Uses and Measurement. Reserve Bank of New Zealand Discussion Paper, (G98/9). Sahu, P. (2021). A Study on the Dynamic Behaviour of Headline Versus Core Inflation: Evidence from India. Global Business Review, 22(6), 1574-1593. Samanta, G. P. (1999). Core Inflation in India: Measurement and Policy Perspectives. Reserve Bank of India Occasional Papers, 20(1), 23-53. Silver, M. (2006). Core Inflation Measures and Statistical Issues in Choosing Among Them, IMF Working Paper, WP/06/97, April. Schembri L. L. (2017). Getting to the Core of Inflation, Remarks at Department of Economics, Western University London, Ontario, February. Wynne, M. (2008). Core Inflation: A Review of Some Conceptual Issues. Federal Reserve Bank of St. Louis Review, (May), 205-228.
| Annex I. Core Inflation – Measures and Properties (January 2012 to December 2023) | | | Properties | Ease of Communication | Equality of means | Lower variance | Predictability | Cointegration | Unbiasedness | Attractor Condition | | Measures | | | (1) | (2a) | (2b) | (3) | (4a1) | (4a2) | (4b) | | Fixed Exclusion Based Measures | | 1. | Excluding Food and Fuel | ✓ | ✓ | ✓ | x | ✓ | ✓ | ✓ | | 2. | Excluding Food, Fuel, Petrol and Diesel | ✓ | ✓ | ✓ | x | ✓ | ✓ | ✓ | | 3. | Excluding Food, Fuel, Petrol, Diesel, Gold and Silver | ✓ | ✓ | ✓ | x | ✓ | ✓ | ✓ | | 4. | Excluding Food, Fuel, Petrol, Diesel, Gold, Silver and Housing | ✓ | ✓ | ✓ | x | ✓ | ✓ | ✓ | | Trimmed Mean Measures | | 5. | Trimmed Mean (5 per cent) | x | ✓ | ✓ | ✓ | ✓ | ✓ | ✓ | | 6. | Trimmed Mean (10 per cent) | x | ✓ | ✓ | x | ✓ | ✓ | x | | 7. | Trimmed Mean (20 per cent) | x | ✓ | ✓ | x | ✓ | ✓ | x | | 8. | Median | x | ✓ | x | x | ✓ | ✓ | x | | 9. | Bias-Adjusted Median | x | ✓ | x | x | ✓ | ✓ | x | | Reweighted and Trend Measures | | 10. | Historical Standard Deviation | x | ✓ | ✓ | x | ✓ | ✓ | ✓ | | 11. | Principal Component | x | ✓ | x | ✓ | ✓ | ✓ | ✓ | | 12. | Hodrick-Prescott trend | x | ✓ | ✓ | ✓ | x | @ | @ | | 13. | Christiano-Fitzgerald trend | x | ✓ | x | ✓ | x | @ | @ | | 14. | Hamilton trend | x | ✓ | ✓ | ✓ | x | @ | @ | Note: @: Did not estimate since there was no statistically significant evidence of cointegration.
Source: Authors’ computation. |
| Annex II: Core Inflation Measures – Definitions | | Measure | Description | | Fixed Exclusion Based Measures | | 1. | CPI excluding food and fuel | Excludes food and fuel groups from CPI headline (weight 47.3) | | 2. | CPI excluding food, fuel, petrol and diesel | Excludes petrol and diesel items in addition to food and fuel groups (weight 45.0) | | 3. | CPI excluding food, fuel, petrol, diesel, gold and silver | Excludes gold, silver, petrol and diesel items in addition to food and fuel groups (weight 43.8) | | 4. | CPI excluding food, fuel, petrol, diesel, gold, silver and housing | Excludes housing group, gold, silver, petrol and diesel items in addition to food and fuel groups (weight 33.7) | | Trimmed Mean Measures | | 5. | Trimmed mean (5 per cent) | Excludes 5, 10 or 20 per cent weight of CPI items, whose inflation rates in a given month are in either tail of the distribution of price changes | | 6. | Trimmed mean (10 per cent) | | 7. | Trimmed mean (20 per cent) | | 8. | Median | Corresponds to the price change located at the 50th percentile (in terms of CPI items weights) of the distribution of inflation, each month | | 9. | Bias Adjusted Median | Corresponds to the price change located at the 50th percentile (in terms of CPI items weights) after adjusting for skewness of the distribution of inflation, each month | | Reweighted and Trend Measures | | 10. | Historical Standard Deviation | Weighs each CPI component inversely proportional to its historical volatility | | 11. | Principal Component | Using the first principal component as a core inflation indicator | | 12. | Hodrick-Prescott trend | Estimating trend using different filter-based data-smoothing techniques. | | 13. | Christiano-Fitzgerald trend | | 14. | Hamilton trend |
|