by Vijay Singh Shekhawat, Avdhesh Kumar Shukla, ACV Subrahmanyam and Jugnu Ansari^ This article analyses retail credit flows and asset quality dynamics therein across the supervised entities on an inter-temporal basis. The study finds that the quality of retail loan portfolio continues to be healthy across the banks, product categories and borrower risk classes, despite a surge in growth. However, it also finds that a few sub-categories in the unsecured retail sector show signs of weakness, which need to be closely monitored by lenders. The recent pre-emptive macroprudential measures by the Reserve Bank augur well for the financial stability. 1. Introduction The sectoral composition of bank credit has undergone a decisive shift in the last decade. The compositional change is primarily driven by the growing prominence of personal loans or retail credit in the overall bank credit.1 As of June 2023, personal loans constituted the single largest category of bank credit, accounting for 49 per cent of total borrower accounts, and 30 per cent of the outstanding non-food credit.2 In the recent past, the share of personal loans in the total non-food credit has increased steadily. Between 2015 to 2023, the personal loans registered a compounded annual growth rate (CAGR) of 17 per cent in outstanding amount and 15 per cent in borrower accounts. Against which, non-food credit registered a CAGR of 10 per cent in outstanding amount and 12 per cent in borrower accounts. Tracking the above rise in the share of retail credit, concerns have been raised over the increasing indebtedness of households and the potential risks to the lending entities from increasing their exposures to the retail segments (Roy, 2023; Das, 20243). The literature has further expressed concerns that a rise in households’ indebtedness may expand contemporary consumption at the cost of sustainable growth in the medium to long term (Gupta, 2023). Several studies have analysed the growth in retail credit in the Indian context. It is observed that personal loans have aided in keeping up the growth momentum in the overall credit (Kumar and Senapati, 2023). Also, the retail credit growth is sensitive to both asset quality and interest rates (ibid). However, it is also observed that only a few banks are dominating the credit flow to the personal loan segment, reflecting the differences in the business models adopted by various banks (Senapati and Prakash, 2021). Consequently, the share of personal loans within the credit portfolio of banks has increased in an unequal manner across banks. Furthermore, from financial stability and risk management standpoint, a sustained increase in credit flows to any sector should be backed by strong fundamental growth drivers without any build-up of concentration risks (Roy, 2006). However, the sustained increase in credit flow to personal loans, particularly unsecured loans, and the consequent rise in their share in overall credit could also entail financial risk and stability concerns both at the entity and systemic levels. Therefore, it needs to be ascertained whether the growth witnessed in the personal loan segment is being driven by fundamental factors without leading to overheating (i.e., excessive credit supply) (Lombardi et al., 2017). Also, at the entity level, the rise in the share of personal loans in banks’ credit portfolios should be accompanied by strong risk management practices regarding borrower selection, and diversification across size and risk categories to avoid the build-up of concentration risks (RBI, 2022; Patra, 2023; RBI, 2023). In this context, the present study analyses the dynamics of retail credit with reference to growth and asset quality trends. The study contributes to the existing literature by specifically analysing whether the current phase of growth in retail credit and its sub-segments is sustainable and whether there are any build-up of risks.4 To ascertain the above, the study analyses a host of forward-looking, sector specific, time series variables. The problem of sustainability of the current surge in retail credit flows hinges on the health of two broad sectors of the economy, viz., households and financial service providers, i.e., banks and non-bank financial corporations. However, households technically are a residual sector, and unlike the general government and non-financial corporate sector, it does not have sector-specific aggregated indicators. Therefore, the health of households and the financial services sector is assessed using financial vulnerability indicators, viz., gross, and incremental delinquencies at the sectoral and product levels. In order to address these issues, this article uses data from multiple sources, viz., RBI’s sectoral deployment of credit releases, aggregated information accessed through supervisory returns submitted to the RBI, and aggregated information received from a credit information company.5 The study uses longest possible historical information of sectoral credit flows (March 1999 to March 2023). However, the central question of the study is focused on the sustainability of current credit flows, especially during periods of stress and therefore, it has analysed the latest credit information with Covid-19 pandemic as a key natural experiment. Specifically, the study uses a before-after framework to assess the build-up of stress in the banking system and households. The study is divided into five sections. Following the introduction, the second section presents a chronological overview of the retail credit growth and its composition (secured vs unsecured loans)6 to examine whether the sustained growth in the retail credit segment is a long-term phenomenon. The third section provides a multi-dimensional analysis of the trends in retail credit composition in banks and non-banking financial companies. The fourth section makes a comprehensive assessment of the risk and stability concerns in the retail credit segments. The concluding observations are outlined in the fifth section. 2. Evolution of Retail Credit in India – Long-term Trend Before setting a context for the analysis of the sustainability of retail loans and the build-up of stress therein, a trend analysis of the growth of personal loans vis-à-vis overall bank credit is provided. The average growth of bank credit loans from March 1999 to March 2023 was 16.5 per cent, at the same time personal loans grew by 21.4 per cent (Table 1). During the sample period, housing loans grew the fastest (24.7 per cent). Based on the long-term trend of overall credit growth and shift in credit growth trajectory, the entire period is divided into two parts, i.e., 1999-2011 and 2011-2023. In the first phase, the average bank credit growth at 21.5 was around twice as large as the 11.0 per cent growth in the second phase. At the same time, retail credit outpaced overall credit growth during both phases growing at 26.4 per cent and 16.1 per cent, respectively in the first and second phase. | Table 1: Descriptive Statistics of Growth in Bank Credit and Personal Loans | | (In per cent) | | Variables | Bank credit | Personal loans | Consumer durables | Housing loans | Other personal loans | | Full period: March 1999 - March 2023 | | Mean | 16.5 | 21.4 | 16.6 | 24.7 | 19.9 | | Minimum | 5.3 | 1.0 | -30.4 | 7.6 | -5.6 | | Maximum | 31.4 | 57.2 | 63.2 | 73.9 | 45.2 | | Standard deviation | 7.1 | 11.8 | 25.8 | 16.4 | 10.7 | | Coefficient of variation | 0.4 | 0.5 | 1.6 | 0.7 | 0.5 | | Phase 1: March 1999 - March 2011 | | Mean | 21.5 | 26.4 | 16.0 | 33.0 | 22.8 | | Minimum | 15.2 | 1.0 | -25.7 | 7.6 | -5.6 | | Maximum | 31.4 | 57.2 | 51.1 | 73.9 | 45.2 | | Standard deviation | 5.5 | 14.5 | 25.1 | 19.0 | 12.9 | | Coefficient of variation | 0.3 | 0.5 | 1.6 | 0.6 | 0.6 | | Phase 2: March 2011 - March 2023 | | Mean | 11.0 | 16.1 | 17.3 | 15.7 | 16.7 | | Minimum | 5.3 | 11.9 | -30.4 | 9.5 | 3.8 | | Maximum | 17.9 | 19.6 | 63.2 | 22.7 | 24.0 | | Standard deviation | 4.0 | 2.4 | 26.6 | 3.6 | 6.2 | | Coefficient of variation | 0.4 | 0.1 | 1.5 | 0.2 | 0.4 | | Source: Authors’ estimates using the Handbook Statistics on the Indian Economy, DBIE,CEIC data. |
| Table 2: Drivers of Incremental Credit Growth | | (In per cent) | | Period | Contribution of personal loans to bank credit growth | Contribution of housing loans to personal loans growth | Contribution of non-housing-personal loans in personal loans growth | | Full: 1999 - 2023 | 28.6 | 49.5 | 50.5 | | Phase 1: 1999 - 2011 | 17.0 | 52.9 | 47.1 | | Phase 2: 2011 - 2023 | 32.9 | 48.8 | 51.2 | | Source: Authors estimates using DBIE data. | In the full period, housing loans had the dominant share in the growth of the retail credit, however, in the second phase, non-housing retail credit has emerged as the major growth contributor (Table 2). Interestingly, it can be observed that volatility in retail credit growth (as measured by standard deviation and coefficient of variation) has declined indicating a stable credit flow to the sector and its sub-segments, though overall bank credit growth exhibited a marginal rise in volatility. Generally, the growth in the retail credit has outpaced that of overall bank credit, barring an interim between 2007 to 2011 (Chart 1a).7 Also, if the extreme values are not considered the growth in the retail segment was mostly higher than the growth in bank credit. Prima facie, it indicates that the current rise in retail credit (post-2014) is more likely than not, in consonance with the long-term trends (Anthony, Shankar, & Sahoo, 2019). The general rise in income levels, purchasing power, demographic profile, and improvement in the quality of the credit information (credit scores) has helped in sustaining the growth momentum in retail credit (Gopinath, 2005; Bag, 2012; Sengupta and Vardhan, 2021) (Chart 1b). 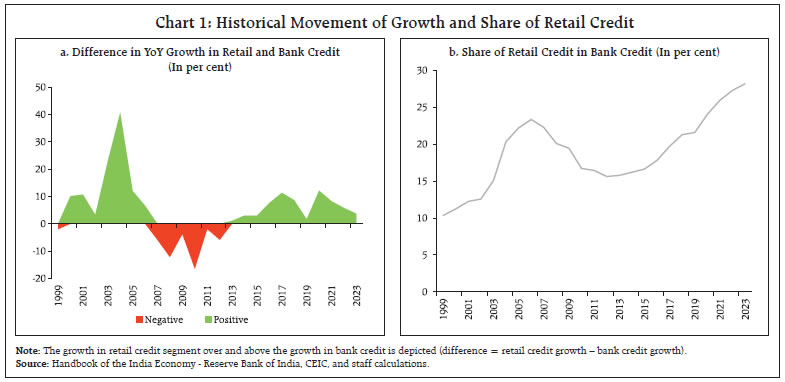 The composition of retail credit has also been changing over time. The share of unsecured credit within the retail credit has been rising. Between 2007 to 2023, the share of unsecured advances in retail credit increased from 25 to 35 per cent (Chart 2a).8 As opposed to this, the share of major segments representing the secured credit remained stable. The housing loans continue to be the single largest sub-segment, constituting around 48 to 50 per cent of retail credit, the vehicle loans constituted the second largest segment accounting for about 10 to 12 per cent share. Further, both the secured and unsecured components have registered growth rates higher than overall bank credit growth (Chart 2b). Besides, the above drivers of retail credit, the continued focus of banks in the retail segment may also be due to historically low delinquency and slippage rates and hence better credit quality observed in this segment vis-à-vis other credit segments (Chart 3)9. The above trends in retail credit growth, low levels of delinquency, composition of secured and unsecured loans indicate that the emergence of retail credit’s dominance in overall credit growth is in consonance with its long-term trends. However, it needs to be ascertained whether the credit flow is towards appropriate borrowers without causing any risk build up. The risks can still stem from the concentration and distribution of credit among different types of borrower risk categories.10 Hence, in the next section, the nature of retail credit growth and its distribution across entities, products and borrower risk categories is examined to ascertain the concentration of risks.
3. Dimensions of Credit Flow 3.1 Do the Right Borrowers Get the Credit? The prominent feature of retail credit portfolio is that it carries an overall lower probability of default owing to its diversification across borrower and product categories. The granularity of the credit distribution brings in diversification benefits imparting stability to the overall portfolio (Patra, 2023).11 During 2014 to 2023, the distribution of retail credit, both in terms of amount outstanding and number of accounts, across various size buckets have remained more or less stable, although the mid-size buckets (viz., ₹25 lakh to up to ₹1 crore) have seen stronger growth. Further, as compared to other components of bank credit (excluding agriculture and personal loans), the distribution of retail credit is relatively more granular and distributed in low and mid-value buckets (Chart 4). Therefore, the growth in retail credit has not led to any shift in the inherent composition of the retail credit portfolio. However, at the product level, there has been a shift in the composition albeit the changes are not substantial. There has been a moderation in the share of housing loans within overall retail credit, indicating that other product categories are gaining more traction, viz., consumer durables, credit cards and other unsecured loans (Chart 5). Mirroring the trends at the aggregate level, the distribution of credit across size buckets has also been stable across major retail product categories except for other personal loans and consumer durables. In major retail products, like housing loans, vehicle loans, and credit cards, the contribution from medium-sized buckets is increasing. Further, the change has been non-disruptive as the compositional change indicates a gradual shift across size buckets. Notwithstanding the above, across product categories (barring housing loans), 80 per cent of the credit is contributed to by size buckets less than ₹10 to 25 lakh, thus reflecting the granular13 nature of retail credit even at the product level (Chart 6).
3.2 Retail Credit - Is There Concentration among a Few Dominant Bank Groups The aggregated borrower-level analysis reveals that the retail loans portfolio across the product categories continues to be granular and over the years no adverse concentration build-up is observed. Therefore, the credit concentration amongst the financial service providers is assessed. The analysis of retail credit growth amongst banks reveals that a few banks are contributing to the major share in retail credit growth. Between 2017 and 2023, on average 60 per cent of the incremental credit is contributed by five banks. However, in recent years, the incremental growth contribution from the dominant banks has decreased (Chart 7). The values of HHI (Hirschman and Herfindahl index) computed on share in incremental growth have fallen from 1400 in March 2017 to 1000 in March 2023, indicating the wider contribution by a broader set of banks (Table 3). Despite the increasing contribution by other banks to incremental growth in retail credit, the HHI computed for share in outstanding retail credit has moved moderately from 1350 in March 2017 to 1250 by March 2023. 3.3 Product category-wise and risk group-wise movement of credit Risk-score and retail product-wise movement of outstanding credit flows reveal that there is stability in the ticket size of credit disbursed. Further, per live borrower, the average size of credit is higher for highly rated borrowers except in the case of credit cards (Chart 8). In the case of credit cards, per live borrower credit outstanding is higher for the below-prime borrowers suggesting a higher flow of credit to relatively riskier borrowers. | Table 3: Movement in Hirschman and Herfindahl Index for Retail Credit | | Financial Year | Share in Incremental Credit | Share in Outstanding Credit | | 2016-17 | 1399 | 1324 | | 2017-18 | 1110 | 1268 | | 2018-19 | 1282 | 1255 | | 2019-20 | 1563 | 1262 | | 2020-21 | 1936 | 1311 | | 2021-22 | 1789 | 1353 | | 2022-23 | 1007 | 1248 | | Notes: Share in outstanding credit as on 31st March of the financial year. Source: Supervisory returns. |
4. Movements in the Flow of Retail Credit and Stress in Retail Credit Portfolio in the Post-Pandemic Period The COVID-19 pandemic disrupted production activity severely impacting the cash flows of bank borrowers, particularly the small ticket borrowers. To alleviate Covid-19 related stress, central banks, including the Reserve Bank, instituted supportive measures for the borrowers (RBI, 2023). However, as noted earlier (Chart 1 & Table 1), the surge in retail credit has continued even after the cessation of the Covid-19 related supportive policies. Therefore, concerns were raised that the unwinding of support policies may result in hidden fragilities surfacing with time lags in terms of defaults from restructured assets or assets coming out of the moratorium (RBI, 2023). As alluded previously, the structure and composition of the retail credit has not undergone any systemic shift in the recent past. Further, the asset quality parameters have shown an improvement or followed a stable trajectory. Therefore, it is expected that pandemic related stress, if any would have not materially impacted the credit growth and asset quality trends in retail credit segments. The same is examined empirically using a simple t-test framework for equality of means. The test examines, if there is a difference in the average values of the growth and asset quality parameters in the periods before pandemic and post pandemic. Besides credit growth and gross non-performing asset ratio (GNPA), the test is also carried out on GNPA including the technical write offs14 and slippage ratios.15 Accordingly, the status of credit flows and stress in the retail portfolio (both incipient and realised) after COVID-19 in comparison with those before the COVID-19 outbreak is presented (Table 4). It can be observed that the majority of credit products recorded a statistically significant rise in credit growth in the post-COVID-19 period vis-à-vis the pre-COVID-19 period. Contrary to the credit growth, stress levels, as depicted by GNPA ratios, and slippage ratios, in retail portfolios dipped during the post-COVID-19 period. However, credit cards and vehicle loan portfolios did record a moderate but statistically significant rise in stress. | Table 4: Shift in Growth and Risk Composition of Retail Portfolio# | | | Pre-Covid-19 (March 2015 - December 2019) | Post-Covid-19 (December 2021 – June 2023) | Statistical Significance with sign | | Credit Growth | | | | | Retail | 14.80 | 20.00 | (+)** | | Housing | 17.02 | 10.38 | (-)*** | | Consumer Durables | 24.05 | 45.23 | (+) | | Credit Card | 28.78 | 24.99 | (-) | | Vehicle Loans | 12.18 | 23.87 | (+)* | | Educational Loans | 5.48 | 11.68 | (+)*** | | Retail Others | 9.89 | 37.05 | (+)** | | GNPA Ratio | | | | | Retail | 2.00 | 1.78 | (-)*** | | Housing | 1.42 | 1.55 | (+)* | | Consumer Durables | 4.56 | 1.86 | (-) | | Credit Card | 1.52 | 1.96 | (+)*** | | Vehicle Loans | 1.97 | 1.64 | (-)*** | | Educational Loans | 7.80 | 6.35 | (-)*** | | Retail Others | 2.72 | 1.91 | (-)*** | | GNPA+TWO Ratio | | | | | Retail | 4.22 | 4.39 | (+)* | | Housing | 1.78 | 2.05 | (+)*** | | Consumer Durables | 36.30 | 19.73 | (-)*** | | Credit Card | 11.63 | 13.28 | (+) | | Vehicle Loans | 3.81 | 4.16 | (+)*** | | Educational Loans | 11.89 | 13.18 | (+)* | | Retail Others | 6.48 | 5.34 | (-)** | | Slippage Ratio | | | | | Retail | 2.37 | 2.11 | (-)* | | Housing | 1.51 | 1.15 | (-)** | | Consumer Durables | 3.90 | 5.02 | (+) | | Credit Card | 3.47 | 7.12 | (+)*** | | Vehicle Loans | 2.48 | 2.92 | (+)** | | Educational Loans | 7.75 | 3.78 | (-)*** | | Retail Others | 3.68 | 2.51 | (-)** | Note: 1. TWO: Technical Write-Off.
2. #: The period March 2020 to September 2021 has been considered as the peak covid-19 affected period. | 5. Conclusion The Indian economy is witnessing a surge in retail credit growth. The credit growth is led by a well-diversified customer base, with reasonably good financial health conditions barring a few pockets of incipient weakness. Therefore, the recent trends as depicted in the study underscore that it is imperative for banks and other financial service providers to monitor the retail segment closely and continuously for any undue build-up of stress (Das, 2023). Notwithstanding the above trends, the policymakers may also consider using structural prudential tools, viz., debt-service ratio and debt-to-income ratio of retail borrowers. While the extant macro prudential tools impart lender resilience by specifying differential risk weights for various classes of retail products reflecting their inherent riskiness,16 policy makers are encouraging lenders to use emerging technology ecosystem, viz., account aggregators, to seek requisite consent from the borrowers; strengthen credit underwriting; and strengthen monitoring of models (Swaminathan, 2023). Besides enabling greater flexibility both in terms of product and pricing choices for the borrowers, such frameworks facilitate monitoring of borrower leverage in a holistic fashion. This can be further extended by prescribing debt-to-income (DTI) limits for certain borrower or product categories. DTI limits along with restrictions on loan-to-value (LTV) ratios are found to be effective macro prudential tools, that can be synchronized to contain systemic risks (Lee, Asuncion, & Kim, 2015; Shin, 2011). Also, such macro prudential tools can be quickly calibrated in line with the evolving macro-economic situations to support or dampen the credit growth. References Anthony, M. J., Shankar, S., & Sahoo, S. (2019, February). “Sectoral deployment of bank credit in India”. RBI Bulletin, LXXIII(2), 35 - 53. Bag, D. (2012), “Growth of Retail Credit and Its composition in Indian banking: A Macro Evaluation”, International Journal of Computing and Corporate Research, 2(3). BIS (2016). “Macroprudential policies and integrated inflation targeting”. BIS Paper, (86a). Brady, R. R. (2008). “Structural breaks and consumer credit: Is consumption smoothing finally a reality?”, Journal of macroeconomics, 30(3), 1246-1268. Das, S. (2023), “Winning in Uncertain Times: The Indian Experience”, RBI, November. https://rbi.org.in/Scripts/BS_SpeechesView.aspx?Id=1396 Das, S, (2024), “Governor’s interaction during Mint BFSI Summit & Awards 2024 on January 11, 2024 (Edited Excerpts)”, RBI, January. https://rbi.org.in/scripts/BS_SpeechesView.aspx?Id=1403 Dobridge, C. L. (2018). “High‐cost credit and consumption smoothing”. Journal of Money, Credit and Banking, 50(2-3), 407-433. Gopinath, S. (2005). “Retail Banking - Opportunities and Challenges”, RBI Bulletin, June. Gupta, N. (2023, October 31). The household debt challenge. Retrieved from The Indian Express: https://indianexpress.com/article/opinion/columns/the-household-debt-challenge-9006522/ Kumar, P., Senapati, M., and Prakash, A. (2021), “Changes in Sectoral Bank Credit Allocation: Developments Since 2007-08”, RBI Bulletin, September. Kumar, S., & Senapati, M. (2023). “Retail Credit Trends–A Snapshot”. RBI Bulletin, 135-145. Lee, M., Asuncion, R. C., & Kim, J. (2015,). “Effectiveness of Macroprudential Policies in Developing Asia: An Empirical Analysis”, Asian Development Bank: Working Papers, No. 439. Lombardi M. J., Mohanty M and I. Shim, (2017), “The Real Effects of Household Debt in the Short and Long Run”, BIS Working Papers No. 607. Patra, M. D. (2023). “India’s financial sector - From exuberance to resilience”. RBI Bulletin, LXXVII(10), 107-122. RBI, (2022), “Operations and Performance of Commercial Banks - Box IV.3: Bank Herding and Systemic Risk”, Report on Trend and Progress of Banking in India 2021-22, 66-67. RBI, (2023). “Chapter VI. Regulation, Supervision and Financial Stability”, Annual Report, Reserve Bank of India. RBI, (2023). “Governor’s Statement: October 6, 2023”, Reserve Bank of India. Roy, M. (2006), “A Review of Bank Lending to Priority and Retail Sectors”, Economic and Political Weekly 41(11) 1035-1040. Rubio, M., & Carrasco-Gallego, J. A. (2014). “Macroprudential and monetary policies: Implications for financial stability and welfare”, Journal of Banking & Finance, 49, 326-336. Sengupta, R., & H. Vardhan (2021), “‘Consumerisation’ of banking in India: Cyclical or structural?”, Ideas for India, July 23, 2021. https://www.ideasforindia.in/topics/moneyfinance/consumerisation-of-banking-in-india-cyclical-or-structural.html Shin, H. S. (2011). “Macroprudential policies beyond Basel III”, Bank of International Settlements, Working Papers (No. 60). Swaminathan, J. (2023), “Building resilient brand India amidst global uncertainty”, RBI, December. Retrieved https://rbi.org.in/scripts/BS_SpeechesView.aspx?Id=1399
|