by Nandini Jayakumar, Rajnish Kumar Chandra, Brijesh P., and Prayag Singh Rawat^ Housing Finance Companies (HFCs) play an important role as the second largest lender in the housing finance space and one of the largest borrowers of the financial system. The HFC sector weathered multiple challenges in the last few years, with the COVID-19 pandemic striking the most recent blow. We empirically examine the heterogeneous impact of the pandemic by studying the relationship between credit growth of HFCs and their size and find that vis-á-vis big HFCs, credit disbursements by smaller HFCs declined in the post-COVID period. Introduction In India, housing and real estate have come to be recognized as key drivers of broader economic and community development, employment and asset creation, and wealth accumulation. A host of 250 ancillary industries, either directly or indirectly, derive their livelihoods from the real estate sector (RBI, 2014). In terms of employment, housing and real estate is the second largest employment provider, next to agriculture, and as per estimates, was slated to have employed over 67 million by 2022 (GoI, 2018). Housing also accounts for a preponderant share in total institutional indebtedness of households, ranging from 61 per cent in urban areas to around 22 per cent in rural areas (NSO, 2021). Housing policies in India have undergone a paradigm shift, with the role of the government evolving from a ‘provider’ to that of a ‘promoter’. In the post-independence period, government played a leading role in the wholesale provision of public housing. Since 2000, with the advent of economic liberalization, however, government has preferred a more market-oriented approach, playing the role of a facilitator. Specifically, they have sought to mitigate housing shortage by providing access to affordable finance and developing the housing finance market (NHB, 2021). At present, Pradhan Mantri Awaas Yojana (PMAY) - with its two verticals, Urban (PMAY-U) and Gramin (PMAY-G) - is the cornerstone of affordable housing policies in India. This umbrella initiative was launched in 2015 with the mission of “Housing for All” by 20221 and aimed to build around four crore homes2. A study based on 2011 census data estimated rural housing shortage to be 140 million (Singh, Swaminathan, & Ramachandran, 2013). Urban housing shortage is estimated to be 29 million in 2018, 54 per cent higher than in 2012 (Roy & ML, 2020). The scarcity in residential real estate, in general, became more evident in recent times when pandemic-induced uncertainty fueled demand for homeownership (NHB, 2022). The low mortgage-to-GDP ratio in India (around 11 per cent) vis-à-vis other Asian economies (ranging from 20 to 30 per cent) is also an indicator of the untapped potential of the sector (KPMG, CII, 2022). With increased urbanization and rising per capita income, this ratio is expected to grow, thereby propelling the sector to a higher growth trajectory (RBI, 2019). In India, among primary lending institutions (PLIs) operating in the housing finance space, scheduled commercial banks (SCBs) dominate the segment with around two-third market share in March 2022. Housing finance companies (HFCs), which are specialized lending institutions registered under the National Housing Bank (NHB) Act, 1987, are the second-largest player, with around one-third market share (RBI, 2022)3. They act as an important alternative financing channel to the housing and real estate sector and are especially instrumental in providing affordable finance to marginalized and new to credit borrowers (Karmali & Rodriguez Ruiz, 2022). On the borrowing side, HFCs interlinkages with rest of the financial institutions make them systemically important from the financial stability perspective. At end-September 2022, after non-bank financial companies (NBFCs), HFCs were the second largest net borrowers of funds from the financial system (FSR,RBI, 2022). In recent times, HFC sector has also been in the throes of rapid change. In the aftermath of the IL&FS crisis in 2018 which sent the NBFC sector into a tailspin, the liquidity woes of non-banks (including HFCs) were exacerbated, culminating in the default by DHFL, a prominent HFC, in June 2019. Subsequently, in a bid to strengthen the oversight of HFCs, the Government amended the NHB Act, 1987 in August 2019, thereby bringing HFCs under the regulatory purview of the Reserve Bank. They are now regulated as a specialised category of NBFCs. Another major development has been the merger of Housing Development Finance Corporation (HDFC) with HDFC Bank on July 1, 2023, resulting in considerable reduction in the size of the HFC sector. Given the important economic role played by HFCs, their systemic importance to the financial system and latest developments in the sector, it is of interest to see how HFCs have fared in recent times. In this regard, this article empirically examines how the HFC sector has performed in the aftermath of the COVID-19 pandemic and whether smaller HFCs were affected disproportionately by this shock. We contribute to the nascent literature on HFCs in India by using the supervisory data filed by HFCs on a quarterly basis with NHB for the period between June 2016 and September 2022. The rest of the article is divided into the following sections. Section II gives an institutional background of HFCs and enumerates the recent changes in the regulatory framework governing the sector. In Section III, we provide an overview of the sector, covering, inter alia, its oligopolistic characteristics, balance sheet, loan portfolio, profitability, and asset quality. Section IV outlines the data and methodology. The empirical estimation and results are discussed in Section V, which also includes robustness checks. Section VI concludes with the way forward. II. Institutional background and recent regulatory developments in the HFC sector II.1 Institutional background As alluded to above, the housing sector is amongst the most important sectors for overall socio-economic development, and therefore, it has received sustained policy support through both demand and supply-side interventions by the government. As a first step toward formalization of housing finance, the central government set up Housing and Urban Development Corporation (HUDCO) as a wholesale lender to finance housing and urban infrastructure activities. Housing finance market gained further traction with the emergence of HDFC as India’s first private company focused on retail housing finance. The success of HDFC prompted the emergence of several HFCs, either as private sector initiatives or in partnership with government, banks, and insurance companies (Tiwari & Rao, 2016). An important development in the housing policy framework was the establishment of NHB in 1988 as an apex housing finance institution with the mandate of promoting “a sound, healthy, viable and cost-effective housing finance system to cater to all segments of the population…”. NHB was also vested with the regulation and supervision of HFCs. In the early stages, HFCs played a more dominant role in providing housing finance, accounting for over two-thirds of housing finance disbursements by PLIs in 2000-01 (NHB, 2005). In the late 1990s however, buoyed by a low-interest rate regime, ample liquidity, favourable demand conditions and positive regulatory developments, banks began to consider housing finance an attractive business proposition (Thingalaya, Moodithaya, & Shetty, 2007). Over the years, banks steadily expanded their housing loan portfolio, leveraging their extensive branch network and low cost of funds, thereby overtaking HFCs in housing loan disbursements (Chart 1a and 1b) (NHB, 2021). Consequently, the domain of housing finance is presently governed by this dual set up, dominated by banks and HFCs. Despite the dominance of banks, HFCs have carved out a niche for themselves as specialists in housing finance by acquiring in-depth knowledge about local markets, rules and regulations (UN-HABITAT, 2008). While retaining their specialization in providing housing loans, HFCs have also diversified their offerings by providing loans against property and lease rental discounting. Owing to their flexible eligibility requirements, HFCs are preferred for housing loans, particularly by middle- and lower-income segments. HFCs, therefore, continue to play an important role in stimulating the growth impulses of the housing sector. II.2 Recent regulatory developments The Committee on Financial Sector Assessment (CFSA), highlighting the conflict of interest faced by NHB in being both the regulator and refinancer of the housing sector, recommended that since HFCs are akin to NBFCs, their regulation should be transferred to the Reserve Bank. However, at the time, the Government was of the view that the housing market in India was in its infancy and therefore, vesting regulatory and developmental functions in a single authority, viz., the NHB, would be advantageous for the market (CFSA, 2009). In 2019, however, the NHB Act, of 1987 was amended and the regulatory authority over HFCs was transferred to the Reserve Bank. 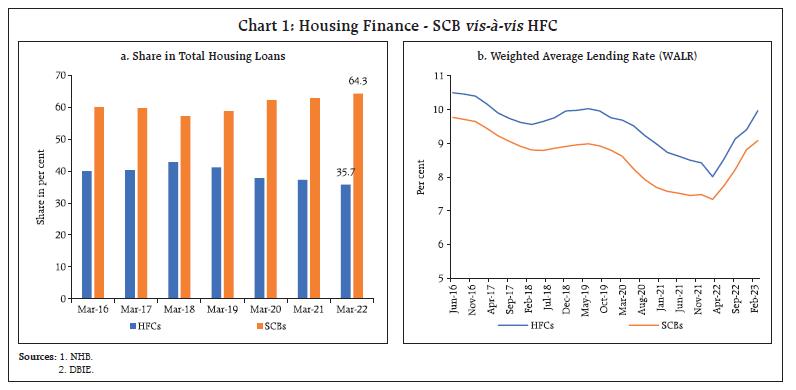 The Reserve Bank sought to harmonise the regulations between HFCs and NBFCs in a phased manner. To that effect, the Bank gave a glide path for existing HFCs to comply with principal business criteria, net owned fund (NOF) requirements, maintenance of liquidity coverage ratio (LCR) and capital adequacy ratio (CRAR) among others. Further, regulations applicable to NBFCs on liquidity risk management framework, implementation of Ind-AS and other prudential norms were also extended to HFCs. HFCs failing to achieve prescribed regulatory requirements in the stipulated time would be required to convert their Certificate of Registration (CoR) from HFC to Investment and Credit Company (NBFC-ICC) if they wish to remain in business. Keeping in view the increasing interconnectedness of NBFCs (including HFCs) with other financial sector entities, the Reserve Bank implemented scale-based regulation in October 2022, where bigger entities are subject to more stringent regulation. Accordingly, HFCs are placed in the middle layer (HFC-ML), with the largest five HFCs in the upper layer (HFC-UL) in the current review period4. III. An Overview of the HFC Sector The HFC sector in India is highly concentrated, as evidenced by the Herfindahl–Hirschman Index (HHI) (Chart 2). In terms of asset size, the largest HFC holds around 52 per cent and the five largest HFCs account for around 85 per cent of market share at end of September 20225. This is largely attributable to the strong market position and extensive geographical presence of HDFC. Going forward, consequent to HDFC twins’ merger, the concentration in the sector is expected to decrease. III.1 Balance Sheet Analysis The HFC sector weathered multiple challenges in the last few years, with the COVID-19 pandemic striking the most recent blow. However, with gradual resumption of economic activities, the sector demonstrated its resilience by growing in double-digits at end-March 2022. The demand for credit extended by HFCs also gained traction, mainly on account of low interest environment, higher savings rate and increased preference for home ownership in the post-COVID period. The consistent thrust from the government through affordable housing schemes, refinance and regulatory support also aided the revival of the sector (NHB, 2022). 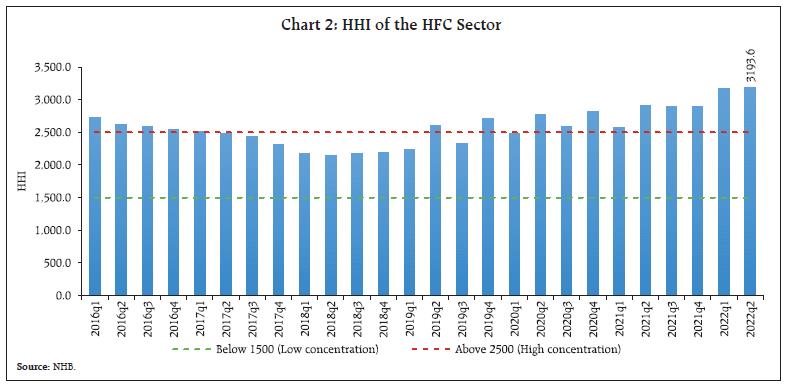
| Table 1: Consolidated Balance Sheet of the HFC Sector6 (At end-March) | | (in ₹ crore) | | | 2021 | 2022 | Growth rates | | Mar-21 over Mar-20 | Mar-22 over Mar-21 | | Share Capital | 32,701 | 35,452 | 2.1 | 8.4 | | Reserves and Surplus | 1,84,518 | 2,07,907 | 20.7 | 12.7 | | Public Deposits | 1,31,458 | 1,38,257 | 10.3 | 5.2 | | Total Borrowings | 9,66,297 | 10,57,597 | 2.6 | 9.4 | | Other Liabilities | 45,929 | 57,502 | 3.7 | 25.2 | | Total Liabilities/Assets | 13,60,903 | 14,96,715 | 5.5 | 10.0 | | Loans and Advances | 10,90,821 | 12,26,423 | 7.0 | 12.4 | | Investments | 97,089 | 1,03,243 | 2.2 | 6.3 | | Cash and Bank Balances | 42,212 | 35,245 | -3.9 | -16.5 | | Other Assets | 1,30,782 | 1,31,805 | -0.6 | 0.8 | | Source: NHB. | Credit extended by HFCs was growing at a robust rate before the liquidity shock due to the IL&FS crisis spilled over to the HFC sector in September 2018. With a few major HFCs defaulting on their debt obligations in 2019, the liquidity stress exacerbated. On the other hand, SCBs stepped up their housing credit during this period, filling the credit gap created by a slowdown in HFC credit. The COVID-19 pandemic and subsequent nationwide lockdown in 2020 aggravated the already delicate business environment. In the post-pandemic period, with government policies and support from regulators, HFCs’ credit growth witnessed revival (Chart 3). On the liabilities side, HFCs predominantly rely on markets and banks for their funding requirements. At end-September 2022, borrowings from these two sources constituted around 68 per cent of the total resources mobilized. Post IL&FS episode, there has been a gradual decline in the share of market borrowings, reflecting waning market confidence. In the aftermath of the COVID-19 outbreak, low-interest rate environment resulted in an increase in borrowing from banks and a further moderation in share of market borrowings. Other borrowings, which included, borrowings from the government and refinance support from NHB also grew during this period (Chart 4).
III.2 Soundness Indicators Overall asset quality of the sector witnessed an improvement at end-September 2022, over the previous year. Gross non-performing assets (GNPA) ratio declined mainly on the back of better recovery by HFCs, improvement in collections under the SARFAESI Act and economic revival (ICRA, 2022). Profitability indicators, return on assets (RoA) and return on equity (RoE) saw a marginal dip in Q2:2022-23 vis-à-vis Q1 of the same year (Chart 5).
To sum up, the HFC sector continues to grow in the aftermath of the COVID-19 shock, exhibiting double digit credit growth and low GNPA ratio, aided by policy and regulatory support. In the next section, we discuss whether there was a heterogeneous impact of the pandemic on HFCs based on their size. IV. Data and Summary statistics Public availability of data on the HFC sector is limited. In this regard, our research makes a valuable contribution towards information dissemination. We utilise quarterly data obtained from NHB on operational and financial parameters of HFCs. The data spans from June 2016 to September 2022 and covers 58 HFCs. The panel is not balanced due to data availability and/or quality issues. Further, information is not available for all variables for all HFCs. However, the dataset covers around 98 per cent of the HFC universe in terms of asset size (at end-March 2022) and therefore, is representative of the sector. In addition, we also use variables to control for the macroeconomic environment, which are sourced from Database on Indian Economy (DBIE) of the Reserve Bank. We study the relationship between credit growth of HFCs and their size. The former is defined as the four-quarter log difference of HFC credit, while the latter is a categorical variable, below-median (small) or above-median (big), depending on whether the natural log of total assets of a HFC in any given quarter is above or below the median value for that quarter (Gambacorta, 2005). Small HFCs primarily operate in semi-urban and rural geographies, focusing on middle- and low-income groups, underserved by banks and other large financial entities. Big HFCs, on the other hand, cater mostly to customers with stable income and have an urban focus (Chart 6a). They differ in terms of their borrowing profiles as well, with small HFCs relying more on bank borrowings and refinance support from NHB, unlike big HFCs which have greater access to market borrowings (Chart 6b). This difference in their customer mix and overall structure of their lending and borrowing portfolios forms the basis of our exercise to assess the differential impact of COVID-19 on these two groups. We also use the following HFC-specific variables as controls7. -
Liquidity Ratio, defined as the ratio of cash and bank balances to total assets. A higher ratio implies a greater ability of the HFC to meet its short-term obligations. -
GNPA Ratio, defined as the share of non-performing loans in total credit extended. A deterioration in asset quality will adversely affect credit intermediation. -
Capital ratio, defined by the ratio of share capital and reserves and surplus to total assets. A higher capital ratio is an important metric of solvency. -
Funding Cost, defined as interest expenses to total borrowings. Higher cost may act as a dampener since HFCs rely on borrowed resources to extend credit. As prevailing macroeconomic factors may simultaneously be related to HFC credit growth and their size, we control for the following macroeconomic variables in our regression specification to ensure that these factors do not confound the relationship of interest: -
SCB housing credit growth, defined as their four-quarter growth rate in housing credit. As HFCs and SCBs compete in the housing credit space, more credit extended by SCBs can dampen the credit growth of HFCs. As discussed previously, over time, the share of HFCs in housing credit has declined and that of SCBs has increased. -
GDP growth, with higher GDP growth reflecting higher demand for credit. We use lagged GDP growth to avoid the problem of reverse causality (Guo & Stepanyan, 2011). -
All-India House Price Index (HPI), compiled by the Reserve Bank on quarterly basis, based on transaction-level data received from the housing registration authorities in ten major cities. In our regression framework, we take four-quarter per cent change in the level of HPI, which is expected to have a positive relationship with credit growth, due to, inter alia, positive wealth effect on the borrowers’ side and easing collateral constraints on the lenders’ side (Pouvelle, 2012). We present summary statistics of key variables for both small and big HFCs in Table 2. We find that as expected, credit growth decelerated and GNPA ratio has increased for both categories in the post-COVID period (quarter-ending June 2020 to September 2022) as compared to the pre-COVID period (quarter-ending June 2016 to March 2020). We further note that the big HFCs maintain a higher liquidity ratio in the post-COVID period, in a bid to shore up liquidity buffers. While the capital position of smaller HFCs did not change materially, big HFCs buttressed their financial position by raising additional capital and strengthened their balance sheets (Table 2). V. Empirical Strategy and Results We have already documented in Section III how the HFC sector suffered a series of shocks, initially via the IL&FS crisis and then with the DHFL crisis. In this section, we seek to examine how the COVID-19 shock affected HFC sector. We are particularly interested to know if there was a differential impact of COVID-19 pandemic on HFCs based on their size. | Table 2: Summary Statistics of Important Variables | | Variable | Pre-COVID | Post-COVID | Difference | | a. Below-median (Small) HFCs | | Average Asset size (₹ crore) | 403.75 | 460.75 | 57.001* | | | [21.43] | [27.36] | [34.333] | | Average Credit (₹ crore) | 351.53 | 394.75 | 43.217 | | | [19.20] | [23.92] | [30.428] | | Credit growth (in log difference) | 0.52 | 0.13 | -0.390*** | | | [0.03] | [0.02] | [0.036] | | Liquidity Ratio (per cent) | 7.24 | 7.38 | 0.133 | | | [0.38] | [0.37] | [0.548] | | Capital Ratio (per cent) | 46.34 | 44.14 | -2.204 | | | [1.45] | [1.45] | [2.105] | | GNPA Ratio (per cent) | 1.99 | 3.33 | 1.341*** | | | [0.08] | [0.17] | [0.173] | | Funding Cost (per cent) | 4.64 | 4.77 | 0.128 | | | [0.14] | [0.17] | [0.223] | | b. Above-median (Big) HFCs | | Average Asset size (₹ crore) | 45693.62 | 51019.12 | 5325.504 | | | [5221.90] | [8139.83] | [9257.076] | | Average Credit (₹ crore) | 37612.06 | 41012.81 | 3400.754 | | | [4008.06] | [6169.98] | [7055.596] | | Credit growth (in log difference) | 0.3 | 0.1 | -0.202*** | | | [0.02] | [0.01] | [0.023] | | Liquidity Ratio (per cent) | 3.16 | 6.95 | 3.791*** | | | [0.22] | [0.35] | [0.392] | | Capital Ratio (per cent) | 15.19 | 20.37 | 5.183*** | | | [0.45] | [0.62] | [0.745] | | GNPA Ratio (per cent) | 2.05 | 3.17 | 1.120*** | | | [0.09] | [0.16] | [0.169] | | Funding Cost (per cent) | 3.61 | 3.23 | -0.383** | | | [0.12] | [0.12] | [0.179] | Notes: 1. Significance levels: * < 10 per cent ** < 5 per cent *** < 1 per cent.
2. Standard errors in parentheses. | The specification of our regression framework is as follows: We estimate three specifications, with big HFCs as the base category. The first specification, reported in column (1), is a regression with HFC fixed effects but no controls. In column (2), we add HFC-specific and relevant macroeconomic controls to the regression specification in column (1) to see the impact of HFC characteristics and time variant macro characteristics on HFC credit growth. In column (3), we use both HFC-specific controls and time fixed effects. The results are reported in Table 3. We further discuss the results reported in columns (2) and (3). The coefficient of the explanatory variable Sizei,t indicates that in the pre-COVID period, compared to big HFCs, credit by small HFCs grew faster, perhaps by virtue of their smaller balance sheets (Pouvelle, 2012). The negative coefficient of the COVID-19 dummy shows the adverse effect of the pandemic on the sector overall. The main coefficient of interest, however, is the interaction between Size and the COVID-19 dummy. We find significant statistical evidence that in the post-COVID period, credit growth by small HFCs is lower than the big ones. This shows the disproportionate shock of the COVID-19 pandemic on the smaller HFCs. We also find that among the HFC specific variables, high GNPA ratio and funding cost dampen credit growth and high capital ratio stimulates it. Among macroeconomic controls, we find that SCB housing credit, GDP growth rate and HPI have expected signs and are significant. In column (3), we add time fixed effects to control for all time variant characteristics which are constant across HFCs. This will absorb the effect of the macroeconomic controls in the second specification. The variable of interest remains highly significant in this more stringent specification as well, indicating the robustness of our result. | Table 3: Differential Impact of COVID-19 on HFCs | | | (1) | (2) | (3) | | Variables | Credit_gr | Credit_gr | Credit_gr | | Size_Below median | 0.244*** | 0.126** | 0.109* | | | (0.0676) | (0.0615) | (0.0613) | | Covid_dummy | -0.249*** | -0.225*** | | | | (0.0215) | (0.0334) | | | Size_Below median x Covid_dummy | -0.223*** | -0.171*** | -0.161*** | | | (0.0388) | (0.0360) | (0.0337) | | Liquidity Ratio | | 0.000487 | 0.00191 | | | | (0.00243) | (0.00236) | | Capital Ratio | | 0.00979*** | 0.0102*** | | | | (0.00137) | (0.00134) | | GNPA Ratio | | -0.0281*** | -0.0252*** | | | | (0.00752) | (0.00769) | | Funding Cost | | -0.0232*** | -0.0342*** | | | | (0.00380) | (0.00564) | | GDP | | 0.00153* | | | | | (0.000791) | | | HPI | | 0.0245*** | | | | | (0.00500) | | | SCB_housing credit | | -0.0153*** | | | | | (0.00337) | | | Constant | 0.315*** | 0.339*** | 0.149*** | | | (0.0345) | (0.0879) | (0.0489) | | HFC fixed effects | Y | Y | Y | | Time fixed effects | N | N | Y | | Observations | 1,236 | 1,177 | 1,177 | | R-squared | 0.492 | 0.588 | 0.624 | Notes: 1. Robust standard errors in parentheses.
2. *** p < 0.01, ** p < 0.05, * p < 0.1. | A major change experienced by the HFC sector in recent times, apart from liquidity shocks and the COVID-19 pandemic, is the merger of HDFC, the largest mortgage financier, with HDFC Bank. As discussed previously, HDFC accounted for over half the size of the sector at end- September 2022. In this regard, one can question if HDFC, by virtue of its size and dominance, is driving our results by its inclusion in the sample. To address this question, we employ the same framework excluding HDFC for robustness. Our results are presented in Table 4. Upon exclusion of this major HFC, we do not find any change in our results, particularly the interaction coefficient, which is our variable of interest. | Table 4: Differential Impact of COVID-19 on HFCs (excluding HDFC) | | | (1) | (2) | (3) | | VARIABLES | Credit_gr | Credit_gr | Credit_gr | | Size_Below median | 0.238*** | 0.120* | 0.103* | | | (0.0677) | (0.0616) | (0.0615) | | Covid_dummy | -0.259*** | -0.234*** | | | | (0.0223) | (0.0343) | | | Size_Below median x Covid_dummy | -0.214*** | -0.162*** | -0.152*** | | | (0.0393) | (0.0365) | (0.0342) | | Liquidity Ratio | | 0.000865 | 0.00233 | | | | (0.00243) | (0.00237) | | Capital Ratio | | 0.00973*** | 0.0101*** | | | | (0.00137) | (0.00134) | | GNPA Ratio | | -0.0279*** | -0.0249*** | | | | (0.00753) | (0.00770) | | Funding Cost | | -0.0235*** | -0.0341*** | | | | (0.00386) | (0.00566) | | GDP | | 0.00156* | | | | | (0.000806) | | | HPI | | 0.0251*** | | | | | (0.00512) | | | SCB_housing credit | | -0.0156*** | | | | | (0.00344) | | | Constant | 0.322*** | 0.346*** | 0.148*** | | | (0.0353) | (0.0894) | (0.0495) | | HFC fixed effects | Y | Y | Y | | Time fixed effects | N | N | Y | | Observations | 1,210 | 1,152 | 1,152 | | R-squared | 0.492 | 0.589 | 0.625 | Notes: 1. Robust standard errors in parentheses.
2. *** p < 0.01, ** p < 0.05, * p < 0.1. | VI. Conclusion In India, HFCs are an important financing channel to the housing and real estate sector and are instrumental in providing affordable finance to marginalized and new-to-credit borrowers. The sector exhibits oligopolistic characteristics, with the largest five HFCs accounting for around 85 per cent of the total assets at end-September 2022. In this regard, recent scale-based regulation introduced by the Reserve Bank seeks to regulate these bigger entities more stringently. The COVID-19 pandemic struck a blow to the HFC sector, which was already reeling under difficulties. Nevertheless, as the economy began inching toward normalcy on the back of liquidity support from the government and regulatory forbearance, the sector also showed signs of revival. Balance sheet of HFC sector recovered and continues to remain sound in terms of asset quality and profitability. The impact of the pandemic, however, differed for bigger and smaller HFCs. We establish this heterogeneity by using quarterly data and find that vis-á-vis big HFCs, credit disbursements by smaller HFCs declined in the post-COVID period. Our results remain robust to various controls and validity checks. In the wake of existing demand-supply gap in the housing sector, HFCs, as the second largest player in the housing finance space, are instrumental in providing accessible and affordable finance options to desiring borrowers. Apart from larger HFCs that dominate the sector, many small players also operate in this space and have developed geographical expertise and knowledge of local markets. They play an important role in promoting last-mile financial inclusion by providing access to housing finance to customers in tier-II and tier-III geographies and their strengthening will reinforce the ‘Housing for all’ agenda. References CFSA. (2009). Report of the Committee on Financial Sector Assessment. Reserve Bank of India. FSR,RBI. (2022). Financial Stability Report, December 2022. Reserve Bank of India. Gambacorta, L. (2005). Inside the Bank Lending Channel. European Economic Review, 1737-1759. GoI. (2018). Economic Survey 2017-18. Ministry of Finance, Government of India. Guo, K., & Stepanyan, V. (2011, March). Determinants of Bank Credit in Emerging Market Economies. Retrieved from International Monetary Fund (IMF): https://www.imf.org/en/Publications/WP/Issues/2016/12/31/Determinants-of-Bank-Credit-in-Emerging-Market-Economies-24698 ICRA. (2022, August). HFCs to witness improvement in growth and profitability in FY2023: ICRA. Retrieved from ICRA Limited: https://www.icra.in/Media/OpenMedia?Key=400e56cf-efa6-4d10-b5db-e0fd0c192d8e Karmali, N. M., & Rodriguez Ruiz, G. J. (2022, May). The Growth and Performance of Affordable Housing Finance Lenders in India. Retrieved from Policy Research Working Paper 10038, World Bank Group: https://documents1.worldbank.org/curated/en/099731505092231210/pdf/IDU0d6d905ed0a3d704e5b0800c0f4741914254c.pdf KPMG, CII. (2022, November). Role of NBFCs and HFCs in driving sustainable GDP growth in India. Retrieved from KPMG: https://assets.kpmg.com/content/dam/kpmg/in/pdf/2022/11/role-of-nbfcs-and-hfcs-in-driving-sustainable-gdp-growth-in-india.pdf NHB. (2005). Report on Trend and Progress of Housing in India. National Housing Bank. NHB. (2021). Report on Trend and Progress of Housing in India. National Housing Bank. NHB. (2022). Annual Report 2021-22. National Housing Bank. NHB. (2022). Report on Trend and Progress of Housing in India, 2021-22. National Housing Bank. NSO. (2021). All India Debt & Investment Survey 2019 (NSS 77th Round). National Statistical Office, MoSPI, GoI. Pouvelle, C. (2012, April). Bank credit, asset prices and financial stability: Evidence from French banks. Retrieved from International Monetary Fund: https://www.imf.org/en/Publications/WP/Issues/2016/12/31/Bank-Credit-Asset-Prices-and-Financial-Stability-Evidence-From-French-Banks-25874 RBI. (2014). Real Estate and Housing - A Sensitive Sector or Samvriddhi Sector? Retrieved from Speech delivered by Shri R. Gandhi, Deputy Governor on August 20, 2014 at the “NAREDCO CONCLAVE - Banking & Investment Reforms: Housing for all by 2022’: https://rbi.org.in/Scripts/BS_SpeechesView.aspx?Id=910 RBI. (2019). Report of the Committee on the Development of Housing Finance Securitisation Market. Reserve Bank of India. RBI. (2022). Report on Trend and Progress of Banking in India, 2021-22. Reserve Bank of India. Roy, D., & ML, M. (2020, December). Housing for India’s Low Income Urban Households: A Demand Perspective. Retrieved from Indian Council for Research on International Economic Relations (ICRIER): https://icrier.org/publications/housing-for-indias-low-income-urban-households-a-demand-perspective/ Singh, S., Swaminathan, M., & Ramachandran, V. (2013). Housing Shortages in Rural India. Review of Agrarian Studies, 54-72. Thingalaya, N., Moodithaya, M., & Shetty, N. (2007, December). Housing Finance: A Study of Experiences of Commercial Banks. Retrieved from Indian Institute of Banking and Finance Macro research initiatives: http://www.iibf.org.in/documents/reseach-report/Report-15.pdf Tiwari, P., & Rao, J. (2016, April). Housing Markets and Housing Policies in India, ADBI WP no.565. Retrieved from Asian Development Bank Institute (ADBI): https://www.adb.org/sites/default/files/publication/182734/adbi-wp565.pdf UN-HABITAT. (2008). Housing Finance Mechanisms in India. Retrieved from United Nations Human Settlements Programme: https://unhabitat.org/housing-finance-mechanisms-in-india.
|