by Harendra Behera, V. Dhanya, Kunal Priyadarshi and Sapna Goel^ This article provides an indicative roadmap for enabling India to become a developed country by 2047-48, which would require India’s real GDP to grow at 7.6 per cent per annum over the next 25 years, raising its current per capita GDP of US$ 2,500 to US$ 22,000. The sustainable path to development requires investment in physical capital and comprehensive reforms across sectors covering education, infrastructure, healthcare and technology to raise productivity. Collaboration between the government, private sector, civil society, and citizens is essential for driving this transformation. Introduction Addressing the nation on August 15, 2022 – the 75th year of India’s independence – the Prime Minister laid down a vision for the next 25 years, to become a developed nation by 2047. As a nation with the largest democracy, rich cultural heritage, young and dynamic population, large middle-class and a rapidly growing economy, India is poised to make significant strides towards achieving this ambitious goal. To transform this vision into reality, several key factors must be addressed and prioritised while focusing on strong macroeconomic fundamentals, structural reforms, demographic dividend, manpower skilling, technological advancements, sustainable practices and good governance. To become a developed country by 2047, India’s per capita GDP needs to rise by 8.8 times from the current level1. This would largely depend on the policy changes and their effective implementation. This article explores the potential drivers of growth over the next 25 years and the challenges that may crop up necessitating timely and targeted policy responses to tackle them effectively. The next Section presents the criteria to define a developed country and estimates the required growth rate for India to achieve that status. Section III explores the feasibility of India becoming a developed country by referring to cross-country growth experiences. Section IV examines the structural drivers of growth in India and the challenges. Section V provides the roadmap to achieve the target, followed by the conclusion in Section VI. II. India as a Developed Country No unique criterion is used to define a country as ‘developed’. The World Bank classifies countries as low-income, lower-middle-income, upper-middle-income and high-income countries based on per capita income (PCI). As per World Bank classification, a country with a per capita income of US$ 13,205 or more in 2022-23 is classified as a high-income country. The International Monetary Fund (IMF) classifies countries into two major groups: advanced economies (AEs) and emerging market and developing economies (EMDEs) based on three criteria: (i) per capita gross domestic product (GDP); (ii) export diversification; and (iii) global financial integration. As PCI is the only common criterion and no PCI threshold is given for the advanced country category by the IMF, the lowest PCI recorded (US$ 18,427 for Croatia) among the AEs in 2022 is considered in this article as a benchmark to evaluate a country as an ‘advanced’ economy. The Target Based on the above two classifications of developed country, two scenarios are considered by assuming annual average global inflation of 2 per cent until 2047-48 (Table 1)2: Table 1: Target Level of Per-Capita GDP for India in 2047-48
(Implicit Annual Average Real GDP Growth) | | | Current | Projected | Advanced Economy
(IMF Classification) | High-Income Country
(World Bank Classification) | | 2021-22 | 2022-23 | 2047-48 | 2047-48 | | Nominal GDP (USD billion) | 3,150 | 3,388 | 49,069 | 35,025 | | Nominal Per Capita GDP (USD) | 2,302 | 2,450 | 30,351 | 21,664 | | Required Nominal GDP (USD billion) CAGR (%) | | | 11.3 | 9.8 | | Required Nominal Per Capita GDP (USD) CAGR (%) | | | 10.6 | 9.1 | | Required Real GDP (INR) CAGR (%) | | | 9.1 | 7.6 | | Sources: IMF; National Statistical Office (NSO); World Bank; Authors’ calculations. | 1. The IMF classification of an AE: To achieve the status of an AE by 2047, a country’s per capita nominal GDP must be more than US$ 30,351. To achieve this target, the real GDP compound annual growth rate (CAGR) required for India should be 9.1 per cent during 2023-24 to 2047-48. 2. The World Bank classification of a high-income country: A country’s per capita nominal GDP must be more than US$ 21,664 to become a high-income country by 2047. To achieve this target, the required real GDP CAGR for India works out to be 7.6 per cent during 2023-24 to 2047-48. To become an AE (high-income country) by 2047-48, India’s per capita GDP in nominal terms would have to record a CAGR of 10.6 per cent (9.1 per cent) (Chart 1)3. It may, however, be mentioned that the best India achieved over a period of consecutive 25 years in the past is a CAGR of 8.1 per cent during 1993-94 to 2017-184. III. Feasibility of Attaining the Target: Cross-Country Experience Achieving high growth over a long time is not a rarity in economic history; the episodes of sustained high growth phases are more recent and highlight the importance of technology and globalised markets in sustaining high growth. It may be stated that India must surpass its preceding record to achieve the nominal per capita GDP of 9.1 per cent growth target. The growth record of our neighbouring countries which managed to achieve this target during their respective high growth phases over a period of 25 consecutive years suggests that most of these countries had started from a low level of income. The highest CAGR was registered by South Korea – 17.9 per cent during 1966-1990, starting from a low per capita GDP of US$ 109 in 1965 to reach US$ 6,610 in 1990. China, though not an AE or high-income country yet, grew robustly at 10.9 per cent during 1983-2007 from a level of US$ 203 in 1982 to US$ 2,694 by 2007. The growth trajectories experienced by other countries during their respective take-off phases, thus, show that India’s prospects of becoming a developed nation by 2047 are feasible. Two common characteristics that marked the transition towards the high income status in these countries are the conscious decision to industrialise and focus on external trade. South Korea, Singapore and China placed special emphasis on industry – especially manufacturing – to propel their growth. Further, the development requirement for the manufacturing sector was met by quality infrastructure and a low cost and trained labour force. A corollary to the conscious decision to promote manufacturing sector was the export orientation which provided markets and helped in improving the efficiency of firms. Their targeted measures include: (i) exchange-rate depreciation; (ii) export promotion via preferential credit allocation, tax exemptions, and other direct measures favouring export promotion; (iii) harnessing comparative advantage in labour-intensive manufacturing and, later, increasing capital-intensive or skill-intensive products; and (iv) policies that favoured new industries with export potential. Furthermore, they were helped by the rapid growth of world income during the 1960s and the beginning of the 1970s which increased demand for exports. Compared to these countries, which underwent structural transformations from agriculture to industry to services sector, India leapfrogged into the services sector while the industrial sector remained stagnant. To sustain growth over the next 25 years, India must rebalance its economic structure by strengthening its industrial sector which has strong backward and forward linkages. Besides providing employment opportunities, a wider industrial sector would mean that India would be able to meet domestically the increasing demand from the burgeoning population. Accordingly, it is expected that India’s industrial sector should increase its share from the current 25.6 per cent to 35 per cent by 2047-48 with manufacturing occupying a 25 per cent share in total value added. This would require the industrial sector to grow at a nominal CAGR of 13.4 per cent (Chart 2). While these economies majorly focused on manufacturing exports, the current scenario warrants attention on services exports too. Given India’s comparative advantage in services exports, if it manages to sustain the growth in exports of goods and services (nominal) at 13.3 per cent over the next 25 years (as observed during the high growth phase of 1993-2017), their share in GDP would increase from 22.8 per cent in 2022-23 to 30.5 per cent by 2047-48 (Chart 3). 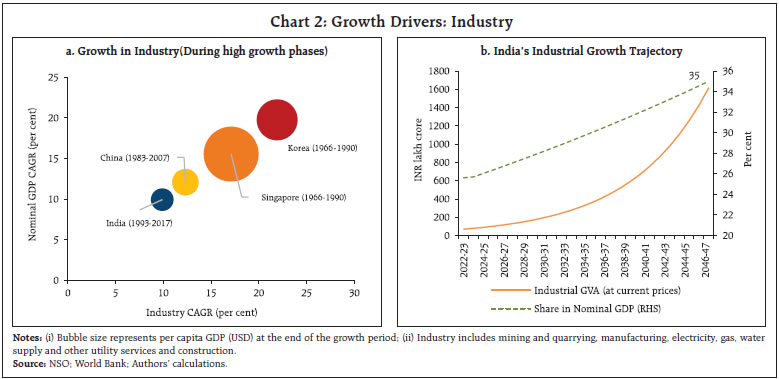 Another feature that marked the growth path of these economies was the gradual transition from an agriculture-led to an industry and services-led economy with the share of the agriculture sector reducing to below 5 per cent of GDP (Table 2). At the time of India’s independence, agriculture accounted for more than 50 per cent share which has declined gradually over the years. Going forward, the share of agriculture would have to come down with the rise in the share of services as observed in AEs. Accordingly, agriculture would have to grow at a CAGR of 4.9 per cent and the services sector by 13 per cent in the coming 25 years to have a sectoral share of 5 per cent and 60 per cent, respectively, by 2047-48. 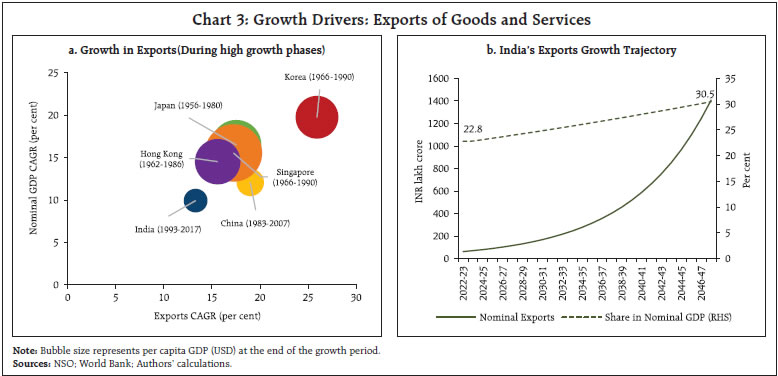
| Table 2: Share in Nominal GDP: 2022 | | Countries | Industry | Services | Agriculture | Exports | | South Korea | 31.8 | 58.2 | 1.6 | 48.3 | | China | 39.9 | 52.8 | 7.3 | 20.7 | | Japan | 28.8* | 69.9* | 1.0* | 18.2* | | Singapore | 24.2 | 70.9 | 0.0 | 186.6 | | Hong Kong | 6.0* | 89.7* | 0.1* | 193.9 | | Average sectoral mix | 26.4 | 67.8 | 2.1 | 93.2 | | India | 25.6 | 48.6 | 16.6 | 22.4 | *: Latest data are available for 2021.
Sources: World Bank; Authors’ calculations. | For realising these growth targets, India needs a development strategy focusing on sustained economic growth with structural change. Along with achieving high per capita income, the goal should be to accomplish all-round development ensuring quality of growth and sustainability in the use of natural resources. In the next section, we explore the growth drivers in detail. IV. Growth Drivers Growth Accounting The neoclassical growth theory postulates that economic growth is the result of three factors – labour, capital, and technology (Solow, 1956; Swan, 1956; Solow, 1957). An increase in employment and investment or technological advancement can increase the growth of an economy. A rise in savings rate or higher capital inflows can contribute to the capital accumulation of a country. Similarly, employing more people in the production process (or a high labour force participation rate) can increase the contribution of labour to overall output. While a country may have limited resources to generate employment or add more capital, it can boundlessly increase the contribution from technology to grow. Therefore, a persistently higher rate of growth can be achieved by creating new forms of technology and efficient and effective means of production – generally termed as total factor productivity (TFP) – through investments in human capital and research and development (R&D) (Romer, 1986, 1990; Aghion and Howitt, 1992). The growth accounting exercise reveals that India’s growth is mainly driven by non-information and communications technology (non-ICT) capital. Despite India being a labour-abundant country, the contribution of both quantity and quality of labour to overall growth is diminutive. TFP played a major role during the high growth-phase of 2003-07 with its contribution coming down in the post-GFC period and turning negative during the pandemic (Chart 4). The impact of a decline in productivity during the COVID-19 pandemic is partly offset by contributions from strong employment growth during 2021-2022; however, the overall growth suffered due to lower contributions from other accounts mainly from ICT and non-ICT capital. To assess the feasibility of maintaining an annual real GDP growth of 7.6 per cent over next 25 years, a baseline scenario along with five alternative scenarios are being generated within growth accounting framework for the period 2023-47. These scenarios involve different assumptions regarding all factors of production and their respective shares in overall output (Table 3). 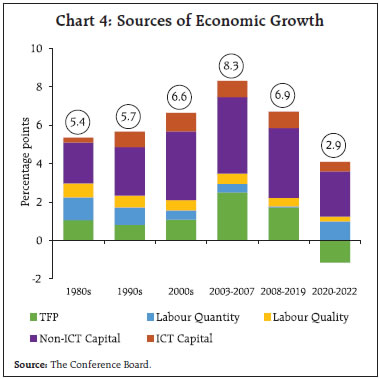
| Table 3: Assumptions on Growth in Factors of Production for Longer-term Projections | | Variables | Baseline | Alt_Skill | Alt_Cap | Alt_ICT | Alt_Skill_Cap_ICT | 2047 Target | | Labour Hours | Same as employment growth | Baseline | Baseline | Baseline | Baseline | Baseline | | Labour Quality (Skill set) | 5-year moving average | Baseline plus a gradual increase of 0.1 pp in first year, 0.11 pp in 2nd year, 0.12 pp in 3rd year, so on. | Baseline | Baseline | Alt_Skill | Alt_Skill | | ICT | 5-year moving average | Baseline | Baseline | Average growth observed during 2003-19 | Alt_ICT | Alt_ICT minus 5 pp | | Non-ICT | 5-year moving average | Baseline | A gradual rise in growth by 0.2 pp up to 2033 | Baseline | Alt_Cap | Alt_Cap minus 0.25 pp | | TFP | Average growth observed during 2003-16 | Baseline | Baseline | Baseline | Baseline | Baseline plus a gradual rise in TFP by 0.05 pp for initial 5 years and subsequently by 0.01 pp. | pp: percentage points; Alt: Alternative; ICT: Information and Communication Technology
Notes: (a) Employment numbers are generated by using United Nation Working age population and a gradual rise in labour force participation rate by 1 pp per year from the level of 40 per cent in 2022.
(b) Reflecting the impact of new education policy and several measures undertaken by the Government, the skill set is assumed to grow gradually and slowly.
(c) TFP in baseline scenario is assumed to grow at relatively higher rate, as observed during 2003-16, reflecting various measures undertaken by the Government.
(d) Non-ICT capital growth is assumed to be lower as compared to a very strong growth experience in the past; but higher than the current growth rate.
(e) Share coefficients are assumed at 5-year moving average levels. | Various scenario analyses underscore the importance of concerted action across sectors for achieving high-income economy status (Chart 5). By continuing the status-co, as assumed under the baseline scenario, the projected growth falls significantly short of the target required to attain developed country status. Even with an increase in skills or assuming a higher growth rate in ICT capital as observed during 2003-19, India’s growth would still fall considerably below the target. While higher growth in physical capital could provide some boost to the growth momentum, it still falls short of the desired growth (Alt_Cap scenario). However, higher growth in labour quality and capital (Alt_Skill_Cap_ICT scenario) or a combination of improvements in labour quality, ICT and non-ICT capital and greater productivity growth (2047 Target scenario), would assist India in its journey towards becoming a developed nation. 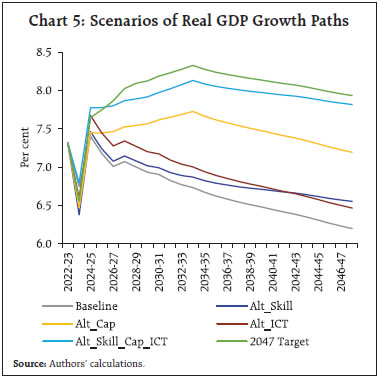
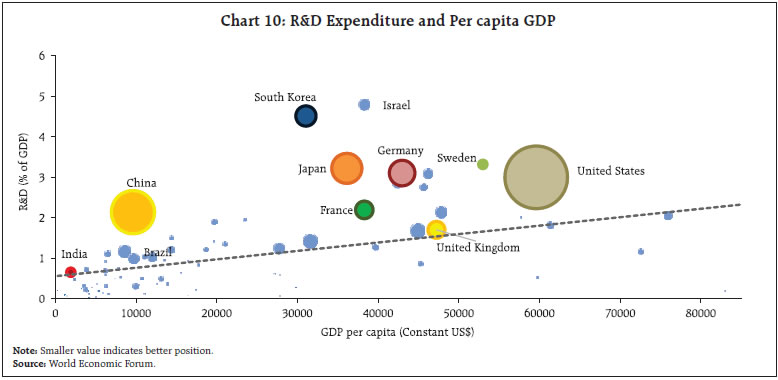
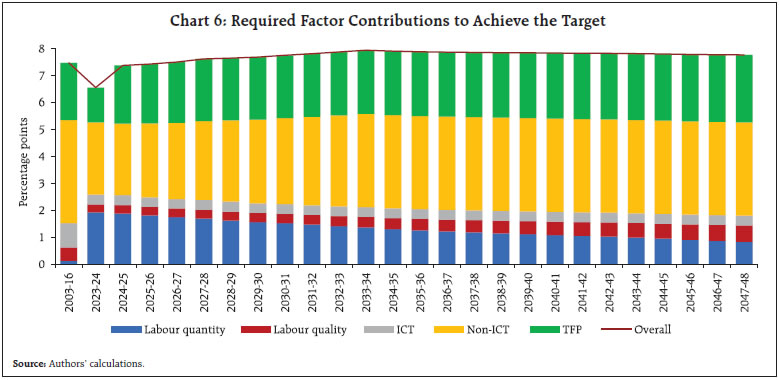 Therefore, it is necessary to focus on larger contributions from physical capital and TFP (Chart 6). At the same time, improvement in labour quality should be a continuous endeavour as it plays a major role in enhancing TFP. It becomes crucial to increase capital per worker, as this would enhance the productivity and efficiency of the workforce. By emphasising the importance of capital investment and technological advancements, India can empower its workers to produce more efficiently, ensuring sustained economic growth in the long run. Challenges Accumulation of Capital to Upscale Production India’s path to a developed nation by 2047 would crucially depend on developing both physical and human capital. In India, investments are mainly financed by domestic savings and a small portion through capital inflows. Saving and investment rates picked up following liberalisation with private capital playing an increasingly important role in total capital formation. India’s savings rate has, however, declined gradually from 37.8 per cent in 2007-08 to 30.2 per cent in 2021-22 with investments also witnessing a slowdown. Given the development requirements of the country, capital accumulation needs to be at a faster rate with focus on both domestic and external sources for capital formation. Considering that a significant portion of India’s household savings primarily consists of physical assets, gold and silver, there is a crucial need to efficiently mobilise and direct these resources towards investments. Though the Indian economy is becoming increasingly capital-intensive, the rise in capital per worker and capital-output ratio is more of a recent phenomenon. Still, India’s capital per worker remains lower as compared to the AEs and other peer countries (Chart 7). This hinders economic growth by reducing productivity, impeding innovation and technological progress. At the sectoral level, it has been found that the rise in capital intensity in construction and mining sectors failed to translate its disproportionate use of capital into productivity (Krishna et al., 2022). Hence, it is important to focus on increasing capital investment as well as its productivity. Skilling the Indian Labour Force to Reap the Demographic Dividend Given India has vast human resources, investment in human capital is crucial to take advantage of the large working age population. Currently, India’s population of 1.42 billion is the world’s youngest, with a median age of 28.2 years, and 68 per cent of the population belonging to the working age group5. In the context of fast-moving technological developments, the future contribution from the labour force would depend on the skill-set available to them. A significant portion of the Indian labour force is employed in the unorganised sector (above 90 per cent of total employment)6, and employability7 of the existing workforce is only around 50 per cent (Patra, 2022). In a cross-country perspective, India’s employment is dominated by elementary occupations and lagging in skill-based occupations (Chart 8). Promoting Health and Education India has to prioritise spending on education and health; and the private sector should play a proactive role in promoting quality education and health system. Few, if any, countries have achieved a sustained period of high economic growth without having invested substantial amounts on their labour force. General government expenditure on health and education in India at 1.8 per cent and 3.1 per cent of GDP, respectively, is low as compared to both transition economies (average 4.7 per cent and 3.6 per cent, respectively) and developed western economies (average 9.1 per cent and 5.2 per cent, respectively). Enhancing Total Factor Productivity Studies in cross-country context have found that TFP growth explains a dominant portion of their growth (Eichengreen et al., 2012; Bulman et al., 2014; Kim and Park, 2017). TFP growth is also found to be a prime factor in a country’s upward transition from middle-income to high-income country group (Kim and Park, 2017); hence, middle-income countries have to complete the “transition from input-driven to TFP-driven growth” (Tran, 2013). Most of today’s advanced nations witnessed higher TFP growth during their high-growth phases, than what India has experienced. For instance, during the two decades of their high growth phases between 1955 and 1973, major European countries like France, Germany, Italy, Spain, and Japan experienced TFP growth in the range of 2.7 to 3.5 per cent per year. In contrast, India’s TFP growth during 1994 - 2018, was only 1.7 per cent per year despite being one of the major growing economies in the world (Chart 9). To enhance productivity, faster diffusion of global frontier technologies to domestic firms through strengthened value chains is required along with reallocation of labour force from low to high-productive sectors. Scaling up R&D and strengthening innovation to enhance TFP Low investment in R&D, particularly by the private sector, is a key impediment to reaping benefits from potential productivity gains. Despite economic slowdown in the post-global financial crisis period, major economies increased their R&D expenditure, while it remained low and almost unchanged for India (at 0.7 per cent of GDP for the last two decades). The aggregate R&D expenditure of South Korea, Germany and China was about 4 per cent, 3 per cent and 2 per cent of their respective GDPs between 2009 and 2018 (Chart 10). The share of patents applied and granted to India in total patents granted globally has been rising in recent years, even as it languishes below 1 per cent. Stepping up R&D investment would require more efforts by the private sector, with the Government focusing on creating an enabling environment – by providing incentives, encouraging collaboration with private sector and research institutes, streamlining regulatory processes and strengthening the enforcement of Intellectual Property Rights (IPR). 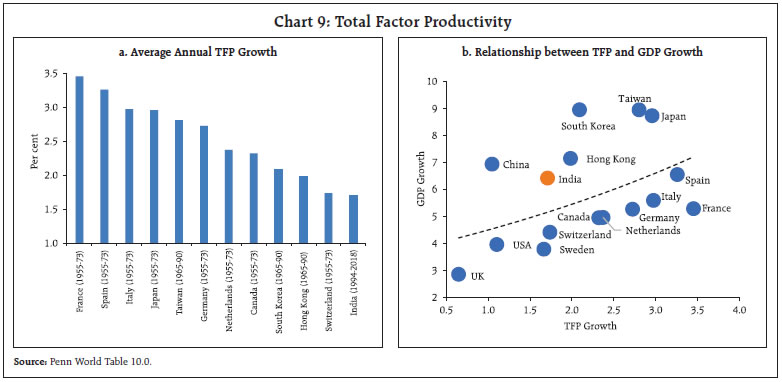
 V. Roadmap to Achieve the Target History offers plausible growth paths, but the export-led growth strategy which helped Japan, South Korea and China in the past may not be applicable or available for India at the current juncture, particularly given the subdued medium-term global growth outlook as well as rising trend towards deglobalisation. On the other hand, services sector globally has become the growth powerhouse as opposed to manufacturing propelled economic growth. India may have to follow a multi-pronged approach with a focus on various aspects of development: strong manufacturing and services sector, structural reforms enabling reallocation of labour from agriculture to other sectors, and investments in human and physical capital. While services sector will continue as the main driver of economic growth, India must also focus on widening its manufacturing base to meet the demand of large domestic market. Apart from sectoral rearrangements, India’s path to a developed nation would depend crucially on addressing the structural bottlenecks in the economy. Here we discuss the broad contours of transformation, first at the economy-wide level and subsequently for select target sectors. Strengthening institutional capacity Globally, a strong correlation has been observed between the quality of national institutions and economic prosperity. Daron Acemoglu8 describes economic institutions as those that set “economic rules of the game” – in particular, the degree of property rights enforcement, the set of contracts that can be written and enforced, and the rules and regulations that determine the economic opportunities open to agents. At its core, the rule of law guarantees public safety, legal security, respect for human rights, access to justice, and accountability. Technological advancements can also improve the quality of institutional services as evident in the recent digitisation drive and subsequent rise in transparency in public service delivery. Institutional quality transcends the public sector; and efforts to create an institutional framework promoting sound corporate governance policies could also help in building an environment of trust, long-term stability and business integrity (Das, 2023). Deepening the financial system It is important to enhance the efficiency of the domestic financial system to improve the allocation of resources to productive sectors. Investments in India have been primarily fuelled by domestic savings. While India’s savings rate is high as compared to EMDEs, efforts should be made to channelise these savings into productive assets wherein innovations and technology can help. The lack of credit history of borrowers and good collateral, combined with information asymmetry, exacerbates the challenge for lenders to lend. Technological innovations in the financial sector have improved the credit delivery mechanisms, and the scope for further innovation in banking and financial products and furthering differentiated banking needs to be explored. The recent measures undertaken by the government on digitalisation of the economy and availability of data provide a more objective and comprehensive basis for credit assessment and thereby enhanced lending to both individuals and businesses. Additionally, corporate bond market needs to be widened which otherwise puts the onus of furthering financial reach entirely on the banking system. This would free up bank resources to concentrate on the untapped segments of the economy. Streamlining and strengthening regulatory requirements across various financial sector entities, developing alternate investment opportunities, utilising fintech and digital innovation, widening the investor base, promoting financial literacy, and coordinated implementation of policies by various policymakers are essential for further deepening the financial system. Increasing Labour Force Participation rate Along with improving the skill-set of the labour force, it is equally important to bring more working age population into the labour force. As of now, only one-fifth of women are part of the labour force, which is one of the lowest in the world. There is a need to increase the participation of women in the workforce by spreading awareness to influence social norms in favour of working women; incentivising institutes to maintain the diversity of students and employees; flexible working hours; women-friendly policies and facilities at workplaces, availability of work closer to the household; and increasing formalisation of jobs (Patra, 2022). Targeting knowledge-oriented sectors While a broad-based approach is necessary for sustained high growth, a focused approach to harness the benefits from key sectors which could offer low-hanging fruits of growth also needs to be explored. Services sector presents itself as a candidate for such a strategy. Literature identifies two distinct waves of service sector growth. The first occurs in “traditional” services (such as personal services, retail and wholesale trade, etc.) at the early stage of development at relatively low levels of income, while the second occurs later at higher incomes in industries such as communication, computers, and technical and business services that use information technology and possess greater scope for cross-border tradability (Eichengreen and Gupta, 2009). India has started this transformation; and exports of engineering, information technology (IT) and IT enabled services (ITeS) are increasingly contributing to national wealth. Given the large pool of Indian talents available to global corporations and 45 per cent of the 1500 global capability centers (GCCs) present in India which are scalable with access to manpower skilled in new technologies, India is well-positioned to leverage this success and cater to more skill-intensive and increasingly digitised services. Riding on the spurt in e-commerce, FinTech and EdTech sectors are expected to lead the next wave of the Indian startup ecosystem. With more diversified solutions in areas of artificial intelligence (AI) and machine learning (ML), big data, data analytics, blockchain and virtual reality, firms will be operationally efficient, globally competitive and highly productive. The policies should focus on facilitating the export of professional services (e.g. accounting and legal services). This may involve outsourcing of services and identification of gaps between the current skillsets of Indian professionals and expected requirements from foreign organisations. Tie-ups with foreign institutes may be considered to fill up the gaps and develop the global best practices amongst Indian firms and professionals. Initiatives towards greater formalisation of the economy should continue as the role of certain services, such as corporate accounting, merchant banking and corporate law shall gain more prominence with increased corporate activity, such as initial public offerings (IPOs), mergers and acquisitions, etc. Moreover, the policies can be initiated in taking steps to build the capacity of domestic firms by shifting away from the reliance on Big 4 accounting9 / Big 3 management consulting10 firms to favour domestic firms. Structural transformation and role of MSMEs The demographic advantage in terms of existence of large working age population can be fully reaped only if employment opportunities are generated outside agriculture. Micro, small and medium enterprises (MSMEs) can play a pioneering role in providing employment opportunities in manufacturing and services sectors. Compared to AEs and EMDEs, the shares of MSMEs in value added and employment are low in India. MSME’s contribution to GDP in Malaysia, Singapore, Germany and Japan ranges between 40-50 per cent while their share in employment is around 70 per cent. In contrast, in India, the shares of MSMEs in gross value added and employment, at 30 and 24 per cent, respectively, are low. This offers a potential to capitalise on this segment and raise its shares in both value added and employment. Various initiatives taken by the government to promote economic development and improve ease of doing business for MSMEs are expected to bring better synergies between the organised manufacturing sector and MSMEs. The corporate sector must take the lead in supporting industrial parks to produce highly customised and specialised products. Acting as innovation hubs, these industrial clusters would ensure smooth functioning of supply chain, supporting domestic manufacturing. Scaling up of physical infrastructure, reducing logistics costs, enhancing skillset of the workforce and integrating MSMEs into the value chain would shape India’s journey in developing the manufacturing sector. This would also require addressing the structural issues relating to land availability, labour market flexibility and speedier dispute resolution. Harnessing the potential in tourism For many countries, including a few large economies, travel and tourism sector contributes a noticeable share to their GDP. India has a major advantage as a tourist destination in the form of its rich endowment of natural and cultural resources, robust air, ground and port infrastructure, and price competitiveness. Further investments in providing safety and security, improving tourist service infrastructure, health and hygiene, and ICT readiness would enhance its attractiveness. Policy focus could be on facilitating digital readiness of state and municipal departments, competitive federalism like aspirational districts and smart city program for travel and tourism, improvement of basic health and sanitary infrastructure especially in and around major tourism destinations. Tourism can also be promoted by leveraging its diaspora to promote Indian culture and inbound tourism using the template of East Asian and European economies which have used liberal travel environment along with showcasing natural resource endowment and culture. Ensuring energy security with a sustained thrust on renewables While following a growth enhancing strategy, India also has to be cognisant of its commitments towards pursuing a clean energy pathway as eventually ignoring climate concerns could threaten long-term growth sustainability (RBI, 2023). Currently, coal accounts for more than half of India’s primary energy consumption, second only to China among the major economies. To reduce its dependence on conventional sources, India has committed to meet 50 per cent of its energy requirement from renewable energy by 2030. Pushing for renewable energy, the government is proactively taking various policy measures to incentivise the production and usage of renewable energy. Nevertheless, the overall rise in consumption and economic size is expected to push up the costs of energy import in absolute terms in the near term. India has taken various steps to amass the critical minerals required for production of renewable energy as the sector is more mineral intensive than conventional energy sources. The International Energy Agency (2021) highlighted that geopolitical risks to energy will intensify with the shift to clean energy, as the endowment of critical raw materials is more geographically concentrated. Additionally, low grid connectivity for renewables, and volatile supply linked to weather conditions pose further risks to energy security through renewables. In view of this, creating a regular and stable supply of critical minerals is essential for meeting the needs of the industry and achieving the country’s climate targets. India may, therefore, conduct an audit of critical minerals which are essential to India’s green transition and promote capital expenditure in these sectors. India may expand international alliances, strategic investments and diversify supply chains to ensure steady supply of critical minerals Securing supply chains and reducing logistic costs Exposure to global supply chain disruptions is quickly transmitted to domestic supply chains, especially from those countries from where India sources a large part of its requirements of raw materials and intermediates (Patra et al, 2022). Thus, it becomes essential for India to work towards securing its supply chains. Moreover, experience from the pandemic and aggravated geopolitical tensions-induced supply chain disruptions have created interests in maintaining supply chain flexibility and resilience or the ability to adapt to aggregate shocks. There are significant gains to be made by lowering logistics costs – a reduction of logistics costs from 14 per cent to 10 per cent of GDP, can save up to ₹10 lakh crore and significantly reduce carbon emissions (Niti Aayog, 2021)11. With a focus on the same, the National Logistics Policy (NLP) was launched in September 2022 to: (i) reduce logistics costs comparable to the global level by 2030 through the policies to improve efficiency and multimodal connectivity via Unified Logistics Interface Platform (ULIP) under PM Gati Shakti; and (ii) create data-driven decision support mechanism for an efficient logistics ecosystem with the use of AI and ML. Certain challenges, however, remain as a major share of logistics cost is arising from transportation (62 per cent of total logistics cost). To reduce the transportation cost, therefore, dependence on road transport needs to be brought down to 25 to 30 per cent. Simultaneously, there is also a need to increase freight transport through railways from the current 27 per cent to 45 per cent12. For achieving the same, the firms/units may be incentivised to use railway freights by lowering the costs and by building separate railway freight tracts. VI. Conclusion India could become a developed country by 2047 with an average annual real GDP growth of 7.6 per cent sustained over the next 25 years. Analysis presented in this article shows that it is feasible, powered by the growth augmenting impact of policy focus on structural reforms, investments, logistics and digitalisation of the economy, upskilling the labour force to reap the potential of favourable demography, and sectoral policy initiatives covering manufacturing, exports, tourism, education, and health. The task, however, may not be easy, given the current level of capital stocks, infrastructure and skill sets of the people. India needs to follow a multipronged approach for engaging the large pool of labour force productively and harnessing growth opportunities in knowledge-oriented sectors. While the unskilled/semi-skilled labour force can be absorbed in MSMEs, new-age manufacturing and services sectors will require upskilling and preparing the younger generation to meet the future demand. While augmenting capital and empowering human resources could place India on the desired growth trajectory, technology will be a key player in this transformation. References: Aghion, P. and Howitt, P. (1992). A Model of Growth through Creative Destruction. Econometrica, 60, 323–51. Bulman, D., Eden, M. and Nguyen, H. (2014). Transitioning from Low-Income Growth to High-Income Growth – Is There a Middle-Income Trap? World Bank Policy Research Working Paper No. 7104. Das, S. (2023). Governance in Banks: Driving Sustainable Growth and Stability. Inaugural Address at the Conference of Directors of Banks organised by the Reserve Bank of India for Public Sector Banks on May 22, 2023 in New Delhi and Private Sector Banks on May 29, 2023 in Mumbai. Eichengreen, B. and Gupta, P. (2009). The Two Waves of Service Sector Growth. NBER Working Paper Series. No. 14968. Cambridge, MA: NBER. Eichengreen, B., Park, D. and Shin, K. (2012). When Fast-Growing Economies Slow Down: International Evidence and Implications for China. Asian Economic Papers 11 (1): 42–87. International Energy Agency (2021). World Energy Outlook 2021.Paris. Kim, J. and Park, J. (2017). The Role of Total Factor Productivity Growth in Middle Income Countries. ADB Economics Working Paper Series No. 527, November. Krishna, K.L., Goldar, B., Das, D.K., Aggarwal, S.C., Erumban, A.A. and Das, P.C. (2022). India Productivity Report. Centre for Development Economics, University of Delhi. Patra, M.D. (2022). India@75. Speech delivered at Bhubaneswar in an event to celebrate Azadi Ka Amrit Mohotsav organised by Reserve Bank of India - August 13. Patra, M.D., Behera, H. and Gajbhiye, D. (2022). Measuring Supply Chain Pressures on India. RBI Bulletin, April. Reserve Bank of India (2023). Report on Currency and Finance 2022-23. Mumbai. Romer, P. M. (1986). Increasing Returns and Long-run Growth. Journal of Political Economy, 94, 1002–37. Romer, P.M. (1990). Endogenous Technological Change. Journal of Political Economy 98, S71–S102. Solow, R. M. (1956). A Contribution to the Theory of Economic Growth. The Quarterly Journal of Economics, 70(1), 65-94. Solow, R. M. (1957). Technical Change and the Aggregate Production Function. The Review of Economics and Statistics, 39(3), 312-320. Swan, T. (1956). Economic Growth and Capital Accumulation. Economic Record, 32 (63), 334-361 Tran, V. T. (2013). The Middle-Income Trap: Issues for Members of the Association of Southeast Asian Nations. ADBI Working Paper No. 421.
|