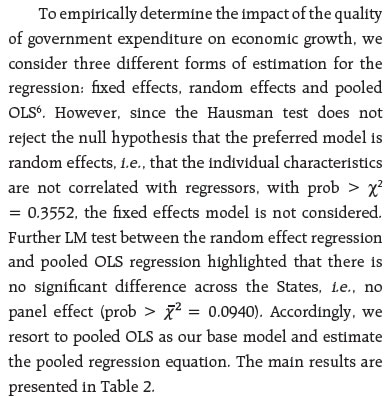
by Ipsita Padhi^, Ranjeeta Mishra^, Samir Ranjan Behera^ and Deba Prasad Rath^ A sustained improvement in the quality of public spending through higher share of productive expenditure can play a conducive role in supporting growth. A composite index of quality of public expenditure (QPE) is derived from five underlying indicators using a dynamic factor model for fourteen major States. Applying a pooled OLS framework, the QPE index is found to have a positive and statistically significant impact on GSDP growth, highlighting the pivotal role of States’ expenditure quality in fostering higher growth. Introduction A sustained improvement in the quality of public spending, with a focus on infrastructure, research and development, health, education and other social services can play a conducive role in promoting an inclusive and sustainable economic growth (RBI, 2023). The channels through which such positive effects emerge are high multiplier benefits, crowding in of private investment, relieving critical supply constraints, improving productivity and ultimately raising potential growth (European Commission, 2012; Bose and Bhanumurthy, 2015; Cordes et al., 2015). In India, at the sub-national level, States account for 60 per cent of general government expenditure, as against the global average for sub-national spending of about 30 per cent, and therefore the expenditure quality of State governments can have important implications for growth (Das, 2021). Moreover, State capex multipliers have been found to be higher than that of the Centre, underlining the pivotal role of States’ expenditure quality in fostering higher growth (Jain and Kumar, 2013). Increasingly, the quality of life and the business environment in India is going to be defined by shifts in the focus of public policy that foster competitive federalism among India’s States in achieving the aspirational goals of sustainable economic development (Patra, 2023). In this backdrop, this article seeks to analyse the trends in the quality of expenditure of State governments and investigate its impact on economic growth. The quality of public spending has two complementary dimensions – (i) the composition of spending; and (ii) the effectiveness of policies. An improvement in the composition of public expenditure through a higher share of capital or developmental spending can have positive effects on growth. At the same time, the effectiveness of policies also matters – the same amount of expenditure could generate higher output if utilised more effectively; e.g., good governance practices can generate better outcomes without necessitating more fiscal resources (Mohanty and Bhanumurthy, 2018). Most empirical studies on the impact of the quality of public spending on economic growth, however, focus on the first dimension as public-sector efficiency is very hard to measure (Busatto, 2011). Accordingly, the share of capital outlay in total expenditure (COTE), capital outlay as per cent of GDP (CO-GDP), development expenditure as per cent of GDP (DE-GDP) and revenue expenditure to capital outlay (RECO) ratio are some of the indicators commonly used in the literature to assess the quality of public spending (Misra et al., 2021). The share of the revenue deficit in the gross fiscal deficit (RD-GFD) is also used as an indicator of the quality of spending as it indicates the proportion of borrowed resources exhausted on revenue expenditure rather than on growth-giving investment (GoI, 2021). Using the above-mentioned indicators, we construct composite indices of quality of government expenditure for 14 major States that account for around 80 per cent of India’s GDP for the period 2005-06 to 2019-20 and analyse its relationship with gross state domestic product (GSDP). We find that the quality of public spending has a positive impact on GSDP growth, underlining the need for States to step-up productive expenditures to spur economic growth, create jobs and raise living standards. The rest of the article is divided into six sections. After a brief survey of literature in Section 2, Section 3 presents some stylised facts. The data and methodology are described in Section 4, while the results are discussed in Section 5. The final Section sets out the concluding observations. II. Literature Review There is a long-standing debate on whether government spending can lead to better growth outcomes with different schools of economic thought viewing this relationship as complex and dependent on a variety of factors (Bussato, 2011; Alqadi and Ismail, 2019). While the Keynesians acknowledge that government spending can help to stimulate economic growth by increasing demand for goods and services and boosting investment, the Ricardian school of thought is based on the premise that people are rational and will make decisions based on their expectations of future events. Accordingly, consumer expectations of future tax hike by the government to fund current government expenditure would make them sceptical about spending and induce them to save, which offsets the effect of government spending on economic growth. The neo-classical school of thought, on the other hand, proffers that increased government spending leads to competition and can crowd out private investment by increasing domestic interest rates (Alqadi and Ismail, 2019). Majority of the empirical work devoted to addressing the issue of the impact of government expenditure on economic growth mostly relates to the size- dimension and not the quality- dimension (Cooray, 2009). In recent years, however, there has been a growing body of research focussing on the quality of government spending which suggests that the quality of government spending is important for economic growth (Barrios and Schaechter, 2008; Bussato, 2011; Masih, 2019). Assessment of the quality aspects of public expenditure with clear definitions and more disaggregated data on expenditure is important as it can help countries to better identify priorities of expenditure and get the desired results (Koroma, 2016). The quality of government spending has some basic principles, which are priority, allocation, time, accountability, and effectiveness; and these are conducive to economic development, reducing poverty and enhancing the human development index (HDI) (Masduki et al., 2022; Haque, 2019). Additionally, the quality of public expenditure is considered to be multi-dimensional; the different dimensions of public finance in a growth-oriented framework indicate that the impact on growth can run through six channels - the size of the government; the level of sustainability; the composition and efficiency of public expenditure; the structure and efficiency of revenue systems; the existence of/adherence to fiscal rules, institutions, and procedures; and lastly, fiscal governance (Barrios and Schaechter, 2008). According to endogenous growth theory, the impact of fiscal policy on economic growth is contingent upon the composition and magnitude of public expenditure and taxation (Bleaney et al., 2001). Several indicators have been identified in the literature to accurately depict the quality of expenditure of the government such as the ratio of revenue expenditure to capital outlay [i.e., capital expenditure minus loans and advances] and the ratio of revenue deficit to the gross fiscal deficit (Misra et al., 2021). Furthermore, Banka (2022) proposes that the ratios of development to non-development expenditure and economic expenditure to social expenditure can also be considered as indicators of quality of expenditure. The composition of public expenditure is often used for assessing the quality of public spending. Redirecting spending towards capital expenditure is found to have a positive effect on economic growth both in the short run and the long run, whereas expenditure on current consumption and subsidies is found to hurt economic growth in the long run (Sever et al., 2011). For instance, countries with demographic burdens attributable to the ageing population would be incurring a considerable amount of public expenditure towards social security aspects, which may crowd out capital outlays thereby hindering economic growth (Colombier, 2011). Infrastructure development also has the potential to catalyse employment generation (Chingoiro and Mbulawa, 2016; Leigh and Neill, 2011). Additionally, government spending on education and health while keeping a balance on the investment in infrastructure, can reduce inequality, poverty, and unemployment (Campodonico et al., 2014; Mekdad et al., 2014). An increase in government expenditure on education by one per cent is found to increase GDP by more than one per cent in the case of Italy, Luxembourg, Slovenia and India (Zoran, 2017). Apart from the composition of expenditure, the effectiveness of expenditure also matters, e.g., using data for fourteen Indian States, Jha et al. (2006) estimate that spending on higher, university, technical, vocational and adult education is more effective in poverty reduction as opposed to expenditure in elementary and secondary education. According to Mohanty and Bhanumurthy (2018), public expenditure is efficient when the government, using its given resources, produces maximum possible benefit for the country’s population. Ceteris paribus, governments that produce more output while spending less on inputs can be viewed as more efficient than governments that produce fewer output and use more inputs. While measurement of public sector efficiency is complex, the authors have used outlays-outcome framework to measure the efficiency of government expenditures on social sector for the Indian States. They find that States are spending their resources more efficiently on education than on health and overall social sector spending. Further, they find that the quality of governance plays a vital role in improving the efficiency of public spending. To summarise, most studies in the Indian context have focussed on analysing individual indicators of the quality of public spending which in isolation may not provide a comprehensive picture of the overall quality of expenditure. This paper contributes to the existing literature by generating a set of composite indicators of the quality of government expenditure at the State-level. Additionally, we use these indicators to empirically examine the impact of the quality of government spending on economic growth. III. Stylised Facts Five main indicators of government expenditure quality are considered in the study, viz., share of capital outlay in total expenditure (COTE); (ii) capital outlay as per cent of GDP (CO-GDP); (iii) development expenditure as per cent of GDP (DE-GDP); (iv) revenue expenditure to capital outlay (RECO) ratio; and (v) share of revenue deficit in the gross fiscal deficit (RD-GFD). While the first three of these indicators share a positive association with the quality of government spending, the latter two are inversely related to the quality of spending with an increase in RECO or RD-GFD implying a worsening of the quality of government expenditure. Aggregated for all States1, each of these indicators broadly shows similar trends with a notable improvement in government spending quality during the high growth years of 2003-04 to 2007-08, notwithstanding the fiscal responsibility legislations (FRL)-led fiscal consolidation during the period (Chart 1). A deterioration in the quality of expenditure, however, set in after the global financial crisis (GFC), which was arrested in 2014-15. During 2015-16 and 2016-17, the expenditure quality improved across most dimensions. Thereafter, from 2017-18 to 2019-20, the RECO and COTE show a sustained deterioration in the expenditure quality, but other indicators present a mixed picture. In 2020-21, COVID-19 dented government revenues while necessitating counter-cyclical spending (Rath et al., 2023a). As States’ focussed on medical and public health expenditure in response to the pandemic, development expenditure-GDP ratio increased while most of the other indicators of expenditure quality witnessed a deterioration. In 2021-22 (RE), the indicators signal a general improvement in spending quality, supported by a buoyant growth in tax revenues, higher tax devolution from the Centre, and long-term interest-free loans extended by the Centre for capex (RBI, 2023). 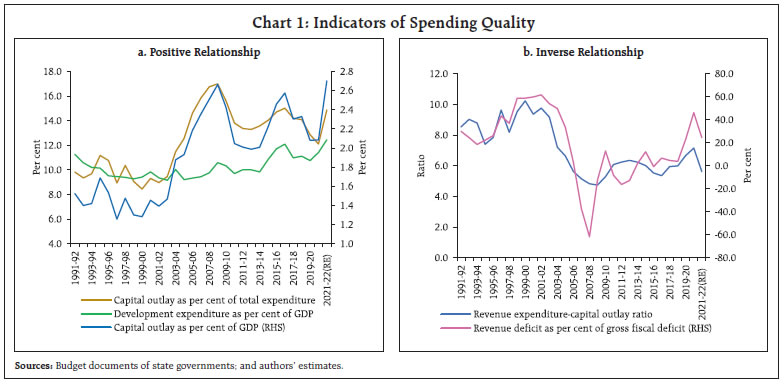 Turning next to State-level data on indicators of expenditure quality, we analyse data for 14 States for 15 years from 2005-06 to 2019-202. We generate binned scatter plots to visualise this data effectively and examine the relationship between quality of public spending and economic growth. The data for the expenditure quality indicator is first partitioned into equal-sized bins, following which the average GSDP growth is calculated for each bin. A scatterplot of the average GSDP growth and average expenditure quality within each bin is then plotted and a linear fit representing the best linear approximation to the conditional expectation function is generated. The binned scatter plots show that higher CO-GSDP and COTE and lower RECO and RD-GFD are associated with higher GSDP growth along expected lines (Chart 2). DE-GSDP, however, does not show a strong association with GSDP growth with higher development expenditure associated with slightly lower GSDP growth. This could be due to the lagged effect of developmental expenditure such as education and health spending on economic growth. 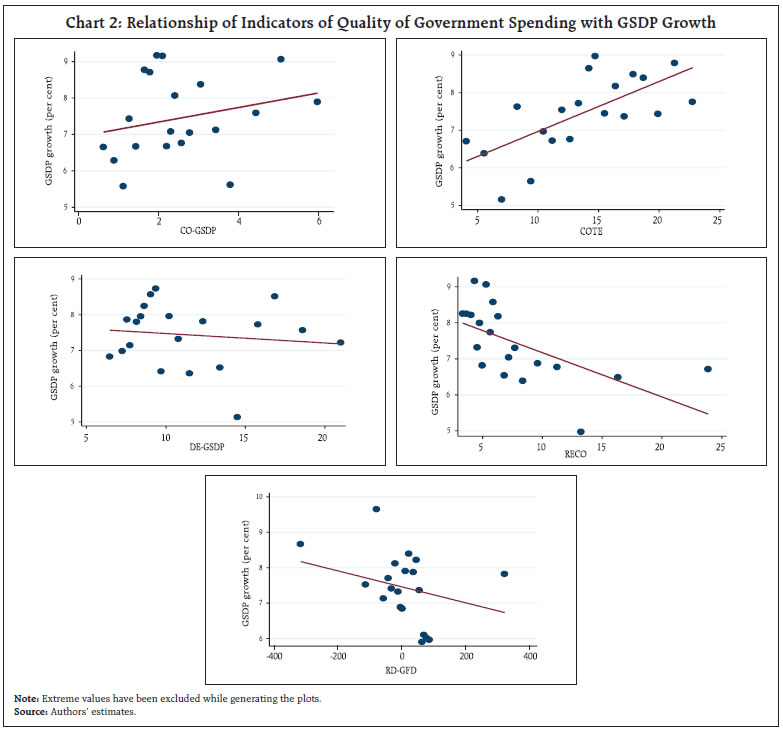 IV. Data and Methodology The data set for this article covers 14 major Indian States3 for the time period 2005-06 to 2019-204. The set of variables includes real gross state domestic product (GSDP) growth, indicators of expenditure quality of States, workforce growth and gross fiscal deficit. The indicators of expenditure quality are used to derive the quality of public expenditure (QPE) index, the data for which is sourced from various issues of the State Finance Report of the Reserve Bank of India. The QPE index is generated for all-States as well as each of the 14 major States5. The GDP/GSDP data are obtained from National Statistics Office (NSO), Ministry of Statistics and Programme Implementation (MoSPI) and data for workforce is sourced from various rounds of the National Sample Survey reports. Table 1 lays out some descriptive statistics for the data set used in the regression model. | Table 1: Descriptive Statistics | | Variable | Number of Observations | Mean | Standard Deviation | Minimum | Maximum | | GSDP Growth | 203 | 0.074 | 0.031 | -0.017 | 0.162 | | QPE (log) | 203 | 2.573 | 0.866 | -0.254 | 3.858 | | Workforce Growth | 203 | 0.003 | 0.043 | -0.125 | 0.174 | | Fiscal Deficit (log) | 203 | 9.413 | 0.930 | 5.622 | 11.052 | | Source: Authors’ estimates. | Identification of Quality of Public Expenditure Index To capture the quality of spending, we derive a composite index of the five indicators, as previously mentioned, using a dynamic factor model (DFM) to extract a common factor from these indicators. The DFM is based on the premise that a small number of latent factors explain the common dynamics of a larger number of observed time series (Stock & Watson, 2016). The composite index provides a dynamic representation that captures the overall quality of spending. DFMs are dimension reduction models for multi-variate time series in which the observed endogenous variables are linear functions of exogenous covariates and unobserved factors, which have a vector autoregressive structure. Following Stock and Watson (1989, 1991), the parameters of DFMs are estimated by maximum likelihood (ML) in state-space form by using the Kalman filter to derive and implement the log likelihood. The unobserved factor is estimated using the following specification: Main Regression Model Apart from the quality of public expenditure, the main regression equation (3) includes fiscal deficit and workforce growth as control variables. The impact of fiscal deficit on growth would depend on several factors such as the state of the business cycle, the magnitude of fiscal deficit and the financing of the deficit (Adam and Bevan, 2001). Workforce participation can impact growth through its impact on the demand for goods and services and as an input in the production process (Kucharski and Kwiatkowski, 2020). V. Results The QPE index, aggregated for all States, is presented in Chart 3a, with the periods of improvement in the quality of government expenditure marked in green and the periods of deterioration or stagnation in the quality of spending marked in orange. It is observed that periods with enhanced quality of public spending are associated with higher average GDP growth while periods of poor or declining QPE index have lower average GDP growth. To investigate further, a binned scatter plot of the State-level QPE indices with GSDP growth is generated (Chart 3b). The best fit line is positively sloped suggesting that a higher QPE index is correlated with higher economic growth. 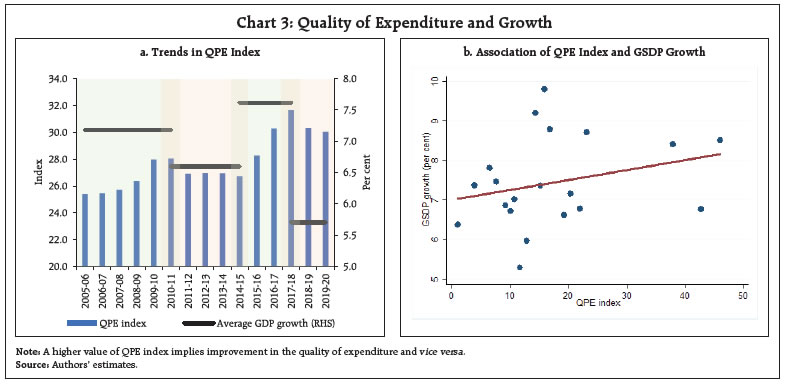
 Controlling for the impact of workforce growth and fiscal deficit, we find that the index of quality of government expenditure has a positive (statistically significant) effect on GSDP growth, which could be due to the higher share of government capital expenditure or due to higher share of developmental expenditure such as education, health or research and development. The significant association between the share of government capital expenditure and economic growth has been noted in previous studies (Cashin, 1995; Bose et al., 2007). Government investment in capital goods is associated with higher rates of economic growth by increasing productivity, stimulating innovation and crowding-in private investment resulting in higher capital expenditure multipliers compared to revenue expenditure multipliers (Wahab, 2011). While capital expenditure multiplier is estimated to be well above unity for both the Union and State governments in India, revenue expenditure multiplier is found to be less than one as an increase in revenue expenditure has been associated with reduction in capital expenditure which affects private investment adversely and offsets the positive impact emerging from the consumption channel and ultimately increases the output by an amount less than one (Rath et al., 2023b; RBI, 2022). The positive impact of development expenditures such as higher share of education and health expenditure on growth has also been documented (Zhang et al., 2020; Kesavarajah, 2019; Bose et al., 2007). | Table 2: Regression Results | | Variables | Pooled OLS | Fixed Effects | Random Effects | | QPE (log) | 0.01*** | 0.02** | 0.01* | | | (0.00) | (0.01) | (0.00) | | Workforce Growth | -0.13*** | -0.13*** | -0.13*** | | | (0.04) | (0.05) | (0.05) | | Fiscal Deficit (log) | -0.01*** | -0.01*** | -0.01*** | | | (0.00) | (0.00) | (0.00) | | Constant | 0.12*** | 0.08** | 0.12*** | | | (0.02) | (0.04) | (0.02) | | Observations | 203 | 203 | 203 | Notes: (i) Conclusions are drawn based on the Pooled OLS model only;
(ii) Standard errors are given in parentheses;
(iii) *, ** and *** indicate significance at 10 per cent, 5 per cent and 1 per cent level, respectively.
Source: Authors’ estimates. | VI. Conclusion With States accounting for around 60 per cent of general government expenditure and about 70 per cent of general government capital outlay (adjusted for defence spending), they have an important role to play in India’s growth story. This paper provides a composite measure of quality of public expenditure of Indian States using a dynamic factor model (DFM) which tracks the evolution of quality of public expenditure over the years. Further, the empirical analysis of the expenditure quality of select States over the period 2005-06 to 2019-20 shows that an improvement in expenditure quality of States is associated with higher GSDP growth, underlining the crucial role of States’ expenditure quality in realising higher growth. These results assume critical importance as there has been a distinct shift in the compositional pattern of State government expenditure in favour of capital expenditure since 2020-21. As against the 30-year average of States’ capital outlay at 1.9 per cent of GDP, their capital outlay is budgeted at 2.9 per cent of GDP in 2022-23 (BE), which bodes well for economic growth (RBI, 2023). The Central government has also been promoting capital expenditure at the sub-national level – it has extended the scheme for ‘Special Assistance to States for Capital Investment’ in 2023-24 with an enhanced allocation of ₹1.3 lakh crore. Under this scheme, the Centre has approved capital investment proposals of ₹56,415 crore in 16 States as of June 26, 2023. It has also been front-loading tax transfers to boost States capex – in 2022-23, the Centre released one extra instalment of devolution in August and another in November, as against the norm of releasing additional instalments towards the end of the year; in 2023-24, one advance instalment has already been released in June. If States manage to use the available fiscal headroom to step up productive expenditures, the beneficial impact on growth would ensue. References Adam, C., & Bevan, D. (2001), “Non-linear Effects of Fiscal Deficits on Growth in Developing Countries”, Department of Economics, University of Oxford. Adam, C. S., Bevan, D. L., Gupta, S., & Radelet, S. (2003), “Staying the Course: Maintaining Fiscal Control in Developing Countries [with Comments and Discussion]”, In Brookings trade forum (pp. 167-227). Brookings Institution Press, January. Alqadi, M & Ismail, S. (2019), “Government Spending and Economic Growth”, Journal of Global Economics. Banka, A. (2022), “Assessment of the Quality of State Expenditures in India”, Indian Economic Service, Government of India. Barrios, S & Schaechter, A. (2008), “The Quality of Public Finances and Economic Growth. Directorate General of Economic and Monetary Affairs. European Commission”, European Economy - Economic Papers. Behera, B. K., & Mallick, H. (2022), “Does Fiscal Deficit Matter for Economic Growth Performance of Indian States?: An Empirical Analysis”, Indian Public Policy Review, 3(6 (Nov-Dec)): 16-44. Bleaney, M., Gemmell, N., & Kneller, R. (2001), “Testing the Endogenous Growth Model: Public Expenditure, Taxation, and Growth over the Long run”, Canadian Journal of Economics, 34(1): 36-57.. Bose, S. & Bhanumurthy, N. (2015), “Fiscal Multipliers for India”, The Journal of Applied Economic Research. Bose, N., Haque, M. E., & Osborn, D. R. (2007), “Public Expenditure and Economic Growth: A Disaggregated Analysis for Developing Countries”, The Manchester School, 75(5): 533-556. Busatto, L. M. (2011), “The Quality of Public Expenditure and its Influence on Economic Growth: Evidence from the State of Rio Grande Do Sul”, Minerva Program, Spring 2011. Campodonico, B., Francisco, J., Cassinelli, P., & Mesones, J. (2014), “The Impact of Public Expenditures in Education, Health, and Infrastructure on Economic Growth and Income Distribution in Peru”, Social Science Research Network, February. Cashin, P. (1995), “Government Spending, Taxes, and Economic Growth”, Staff Papers, 42(2): 237-269. . Chingoiro, S. & Mbulawa, S (2016), “Economic Growth and Infrastructure Expenditure in Kenya: A Granger- Causality Approach”, International Journal of Social Science Studies, Vol 4. No 9. September. Colombier, C. (2011), “Does the Composition of Public Expenditure Impact Economic Growth? Evidence from Switzerland using a Robust Cointegration Approach,” Applied Economic Letters, April.. Cooray, A. V. (2009), “Government Expenditure, Governance and Economic Growth”, Faculty of Business and Law. Cordes, T., Kinda, T., Muthoora, P, & Weber, A. (2015), “Expenditure Rules: Effective Tools for Sound Fiscal Policy?”, Working Paper WP/15/29, International Monetary Fund. Das, S. (2021), “Towards a Stable Financial System”, Nani Palkhivala Memoria Lecture delivered on January 16. European Commission (2012), “The Quality of Public Expenditures in the EU”, Occasional Paper, 125, December. Greene, W. H. (2008), “Econometric Analysis”. Upper Saddle River, N.J.: Prentice Hall, 6th Ed. . GoI (2021). Fifteenth Finance Commission Report, Government of India. Haque, M. (2019). Deficit Financing in Contemporary Economies: Effects and Implications. Journal of King Abdulaziz University-Islamic Economics. Jain, R. and Kumar, P. (2013), “Size of Government Expenditure Multipliers in India: A Structural VAR Analysis”, RBI Working Paper 07 / 2013, September. Jha, R., Biswal, B., & Biswal. U.D. (2006), “An Empirical Analysis of the Impact of Public Expenditure on Education and Health on Poverty in Indian States”, Australian National University Working Paper. Kesavarajah, M. (2019), “Does Composition of Public Expenditure Matter for Economic Growth? Lessons from Sri Lanka,” Staff Studies, 49(2). Kneller, R., Bleaney, M. F., & Gemmell, N. (1999), “Fiscal Policy and Growth: Evidence from OECD Countries”, Journal of Public Economics, 74(2): 171- 190.. Koroma, S. E. (2016), “Piloting the Methodology for Estimating Government Expenditure in Agriculture in Uganda”, Food and Agriculture Organization of the United Nations. Kucharski, L., & Kwiatkowski, E. (2020), “The Role of Labour Inputs in Contemporary Trends of Economic Growth”, Polityka Społeczna, 16(1 (ang)), 2-7.. Leigh, A. & Neill, C. (2011), “Can National Infrastructure Spending Reduce Local Unemployment? Evidence from an Australian Roads Program”, Economics Letters. Elsevier. Vol. 113. Issue 2. November. Masduki, U., Rindayati, W., & Mulatsih, S. (2022), “How can Quality Regional Spending Reduce Poverty and Improve Human Development Index?”, Journal of Asian Economics, 82, 101515. Masih, D. G. (2019), “Fiscal Constraints of Central Government of India: Some New Dimensions”, International Journal of Research in Engineering, IT And Social Sciences, 8. Mekdad, Y., Dahmani, A., & Louaj, M. (2014), “Public Spending on Education and Economic Growth in Algeria: Causality Test”, International Journal of Business and Management, Vol. II, 3. Misra, S., Behera, S. R., Seth, B. & Sood, S. (2021), “Fiscal Framework and Quality of Expenditure in India”, RBI Bulletin, June. Mohanty, R. K., & Bhanumurthy, N. R. (2018), “Assessing Public Expenditure Efficiency at Indian States”, National Institute of Public Finance and Policy, New Delhi, NIPFP Working Paper, 225. Patra, M.D. (2023), “The Dawn of India’s Age”, Inaugural address delivered at the Indira Gandhi Institute of Development Research (IGIDR) Alumni Conference, Mumbai on May 10. Rath, D.P., Padhi, I., Suresh, A.K., & Behera, S.R. (2023a), “Cyclical Stance of Fiscal Policy: An Investigation of the Indian Case”, Indian Journal of Economics, University of Allahabad, 410, (in press). Rath, D.P., Behera, S.R., & Sharma, S. (2023b), “State-level Fiscal Multipliers in India: Local Fiscal Multiplier Approach (submitted for publication in the Journal of Quantitative Economics). Reserve Bank of India (2022), “Report on Currency and Finance 2022-23”, Reserve Bank of India, May. Reserve Bank of India (2023), “State Finances: A Study of Budgets of 2022-23”, Reserve Bank of India, January. Sever, I., Drezgic S. & Blazic, H. (2011), “Budget Spending and Economic Growth in Croatia – Dynamics and Relationships Over the Past Two Decades”, Zbornik radova Ekonomskog fakulteta u Rijeci: časopis za ekonomsku teoriju i praksu, Vol. 9(2): 291–331. Stock, J. H., & Watson, M. W. (1989), “New Indexes of Coincident and Leading Economic Indicators”, NBER Macroeconomics Annual, 4: 351-394.. Stock, J. H., and M. W. Watson. (1991), “A Probability Model of the Coincident Economic Indicators. In Leading Economic Indicators: New Approaches and Forecasting Records, ed. K. Lahiri and G. H. Moore, 63–89. Cambridge: Cambridge University Press. Stock, J. H., & Watson, M. W. (2016), “Dynamic Factor Models, Factor-augmented Vector Autoregressions, and Structural Vector Autoregressions in Macroeconomics”, In Handbook of Macroeconomics (Vol. 2, pp. 415-525). Elsevier. Tung, L. T. (2018), “The Effect of Fiscal Deficit on Economic Growth in an Emerging Economy: Evidence from Vietnam”, Journal of International Studies, 11(3). Wahab, M. 2011, “Asymmetric Output Growth Effects of Government Spending: Cross-sectional and Panel Data Evidence”, International Review of Economics & Finance, 20(4): 574-590. Zhang, X., Zong, G. A. N. G., & Xiao, D. O. N. G. (2020), “Effects of Government Healthcare Expenditure on Economic Growth Based on Spatial Durbin Model: Evidence from China”, Iranian Journal of Public Health, 49(2): 283. Zoran, T. (2017), “Analysis of the Impact of Public Education Expenditure on Economic Growth of European Union and BRICS”, Economic Analysis, Vol. 48, No. 1-2: 19-38.
|