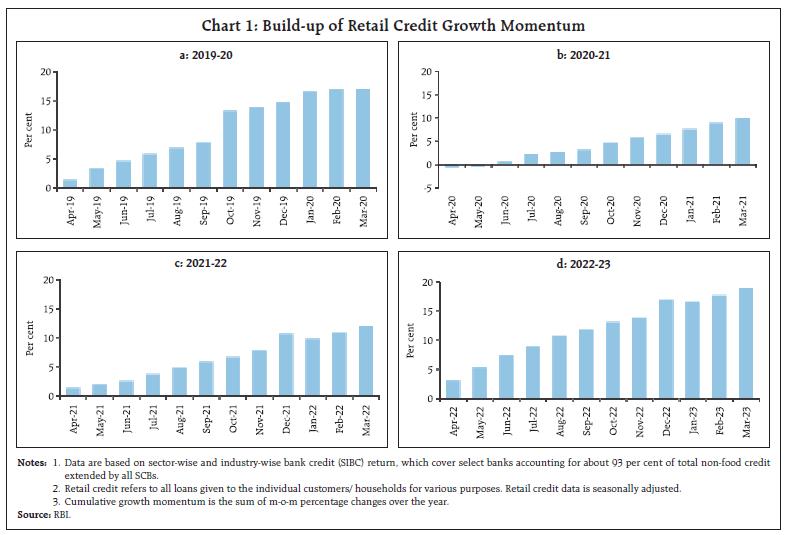
by Sujeesh Kumar^ and Manjusha Senapati^ Retail bank credit played a significant role in the recovery of the aggregate bank credit growth in recent years, particularly after the COVID pandemic. This shift towards retail loans by banks is estimated to be cyclical in nature. Empirical analysis suggests that the retail credit expansion is sensitive to asset quality, as well as interest rates. Robust credit risk assessment may help sustain strong and risk-free growth in retail and overall bank credit portfolio. Introduction Accelerated bank credit growth to the industrial sector largely drove the overall bank credit growth till 2013-14. Later, the credit growth started slowing down, being impacted by the increased non-performing assets (NPAs) of the banks. On the other hand, the contribution of retail loans to overall credit growth started increasing and currently is the highest among all the sectors.1 During the COVID period, the average contribution of retail loans to overall credit growth was much higher than industrial/services sector credit, and even in the post-COVID period, the release of higher pent-up household spending could sustain this contribution. The retail credit outstanding at the end of March 2023 was ₹40.85 lakh crore, more than double of that in March 2018. The share of retail loans by the scheduled commercial banks (SCBs) in aggregate credit had increased from 24.8 percent in March 2018 to 30.7 percent in March 2022 and further to 32.1 percent in March 2023 – the highest among the sectors. The month-on-month (m-o-m) cumulative growth momentum build-up for the financial years 2019-20 to 2022-23 covering pre-COVID period and post-COVID recovery period revealed that there was sustained growth of retail loans in 2022-23. SCBs gained the pre-COVID momentum in 2022-23 gradually with the ebbing of the pandemic period (Table 1 and Chart 1). Some recent empirical studies show that in the second half of the last decade, the expansion of credit to the non-industrial sectors, mainly lending to housing and credit cards segments, was driving the overall non-food credit growth (Kumar et al., 2021; Sengupta and Vardhan, 2022). The latest statistics on retail lending portfolios of the banks signalled increased focus by the banks on the retail credit sector. Though the retail segment played a significant role in the bank credit recovery process, concentration of bank portfolio in retail loan segment may have larger macroeconomic and financial sector implications. Studies for advanced economies show that a shift towards asset-backed credit, which produces high credit levels for real estate and the financial sector, causes financial sector instability (Bezemer et al., 2023). Moreover, this shift needs to produce credit for the real sector investment. Higher retail loans result in purchasing discretionary items and deferred payments (through credit card spending). | Table 1: Retail Credit Portfolios of SCBs | | Period | Pre-COVID period | COVID and post-COVID period | | Mar-18 | Mar-19 | Mar-20 | Mar-21 | Mar-22 | Mar-23 | | Credit Outstanding (in ₹ lakh crore) | 19.08 | 23.03 | 27.26 | 30.09 | 33.86 | 40.85 | | Growth (y-o-y, per cent) | 17.8 | 20.7 | 18.4 | 10.3 | 12.6 | 20.6 | | Share in Total Credit (per cent) | 24.8 | 26.8 | 28.6 | 30.0 | 30.7 | 32.1 | Notes: 1. Data are based on sector-wise and industry-wise bank credit (SIBC) return, which cover select banks accounting for about 93 per cent of total non-food credit extended by all SCBs.
2. Retail credit refers to all loans given to the individual customers/ households for various purposes.
Source: RBI. |
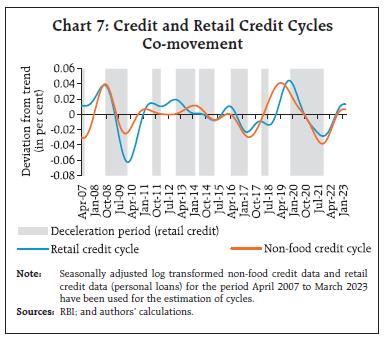
 The resulting credit concentration in the retail segment can be a source of systemic risk (RBI, 2022). In the long term, such concentration or co-movement of portfolio strategies can still result in the emergence of systemic risks. Another retail loan portfolio concentration risk can arise from loan stacking, wherein borrowers can avail of loans from many lenders, which over time can adversely affect the borrower’s capacity to repay. Against this background, the article analyses the trends of retail lending and the role it played in the recovery of credit growth during the COVID pandemic period. It is examined whether ‘retail shift’ – the phenomenon reflecting the relative increase in disbursements to retail credit in bank loan portfolio – observed recently in banks’ loan portfolio is permanent or cyclical in nature. The factors determining the retail credit growth are analysed in a panel regression framework using quarterly data for the period Q1:2007-08 to Q3:2021-22. The article has six sections. After introduction, section II presents a brief literature review of retail credit studies. Section III depicts the domestic trends in retail credit growth and its components. Section IV analyses the retail credit dynamics from the perspective of the surveys conducted by the RBI and the cyclicality of retail credit viz-a-viz overall bank credit. Section V presents an empirical analysis of determinants of retail credit and its sub-components using quarterly data and section VI concludes. II. Review of Literature The literature on Indian retail credit analysis has focussed on the reasons for the widespread use of retail lending by Indian banks. Some of the factors cited for the increased share of retail loans in the overall loan portfolio of the banks were an increase in economic prosperity and a consequent increase in purchasing power which boosted retail credit (Gopinath, 2005). It was argued that the growing middle-class population and rising income levels, combined with the demographic change of smaller household sizes, had boosted demand for retail credit in India. A high proportion of the younger cohort population was an asset for the country’s economic development (Bag, 2012). Technological innovations relating to the increasing use of credit/debit cards, ATMs, direct debits, and phone banking also contributed to the growth of retail banking. On the supply side of credit, there were some regulatory changes wherein all consumer lenders were required to share their customer data with accredited credit bureaus, which vastly improved coverage of credit bureaus and made it easier for newer players to enter the consumer-lending business and expanding the customer segments they were serving (Sengupta and Vardhan, 2021). Few studies have concentrated on retail customer behaviour and banks’ risk management practices. There felt a need for constant innovation in devising retail loan products and their delivery to maintain the retail market presence, which acted as a growth trigger (Rao, 2014). A long-run equilibrium causal relationship existed between real consumption expenditure and economic growth, from real private consumption expenditure to economic growth (Mishra, 2011). A similar study for the Sri Lankan economy confirmed that consumption expenditure positively impacted economic growth during the study period from 1975 to 2014 (Aslam, 2017). However, another view was that consumption-led credit growth can help improve economic growth while, at the same time, it would result in increased risks. In a prolonged slow-down period or low growth period, both bank and consumer behaviour could lead to increased variability of economic performance and banks would have pressure on their capital. Banks may cut credit growth to retain their ratings resulting in lower credit available for consumption, thereby hurting growth (Roy, 2006). Macroeconomic impact of increasing household debt levels was examined and found that a 1 percentage point increase in the household debt-to-GDP ratio tends to lower growth in the long run by 0.1 percentage point (Lombardi et al., 2017). The negative long-run effects on consumption tend to intensify as the household debt-to-GDP ratio exceeds 60 per cent. Studies which examined the impact of COVID on bank behaviour maintained that the share of household credit has become more concentrated in credit cards and other personal loans in the post COVID period (Gupta, 2022). The risk arising from this concertation was that the consumer credit-financed splurge would slow down eventually which might have serious repercussions for the debt-servicing capability of already indebted households leading to their future consumption below disposable income. Banks and financial intermediaries must be vigilant and substantially upgrade their risk capabilities with respect to governance, assurance functions and risk culture (Das, 2020). Given this background, there is a need to further investigate trends of retail bank loans and contributions of its components to enhance our understanding in this area, particularly in the post-COVID period. The article complements the extant literature in two ways. First, it uses quarterly data to empirically analyse the determinants of retail credit growth, and second, it delves down deeper empirically into major sub-components of retail credit to understand the dynamics better. It will help to inform the impact of higher retail loans in banks’ overall loan portfolio and how the response evolves when bank-wise as well as macroeconomic variables are considered. Addressing the matter will better facilitate the analytical assessment of the policy debate around these issues. III. Retail Bank Credit Trends in India The rise of retail loans did not occur in the post-COVID period suddenly. The share of industries was substituted by the retail segment during the last decade itself. Gradually, a ‘retail-shift’ was observed in terms of credit growth dynamics (Chart 2). However, retail segment played a major role in the recovery of the overall credit growth in the post-COVID period. Bank-wise, there was reduced dispersion of retail credit growth in the post-COVID period, which implies that the credit growth was robust across the banks (Chart 3). The higher credit growth in the segment might be result of ‘herding behaviour’ displayed by banks in diverting loans from industry to retail segment (RBI, 2022). The better asset quality2 in the retail segment also appears to be contributing to banks’ increased focus on retail credit. However, this is not a risk-free segment and not a panacea for asset quality concerns in non-retail loans (Vishwanathan, 2018). 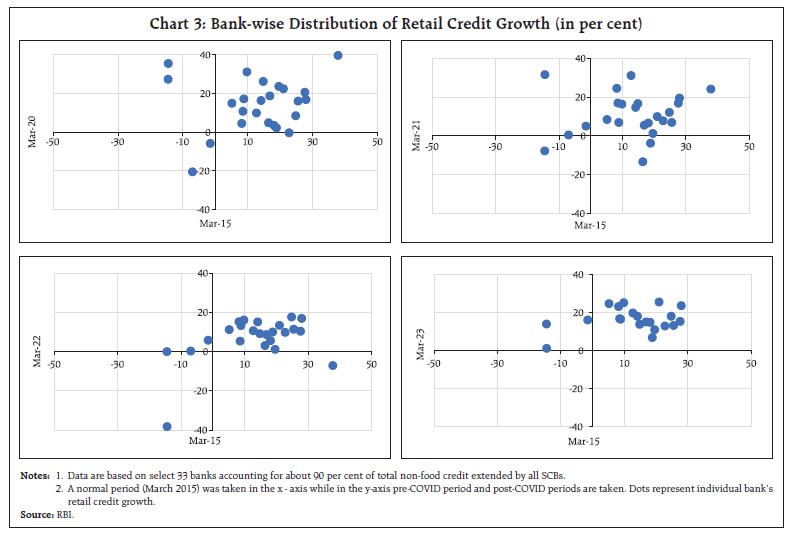 The growth contribution of the key sectors within the retail segment3 has changed after the onset of the COVID pandemic. Housing segment (having highest share in retail loans) was contributing around 10.6 percentage points to the annual retail credit growth of 20.7 per cent in March 2019 (pre-COVID period). It came down to 7.4 percentage points in March 2023 (in retail credit growth of 20.6 per cent). Vehicle loans, having the second highest share in the retail loans, which were contributing 5 percentage points in the pre-COVID period, are now accounting for 3 percentage points (Chart 4). Loans against gold jewellery had a small share (2.2 per cent) in the retail loans segment but gained importance during the pandemic. The RBI had increased the loan to value ratio (LTV) for gold loans in August 2020 from 75 per cent to 90 per cent. However, with the ebbing of the pandemic, the demand for gold loans from banks slowed down. 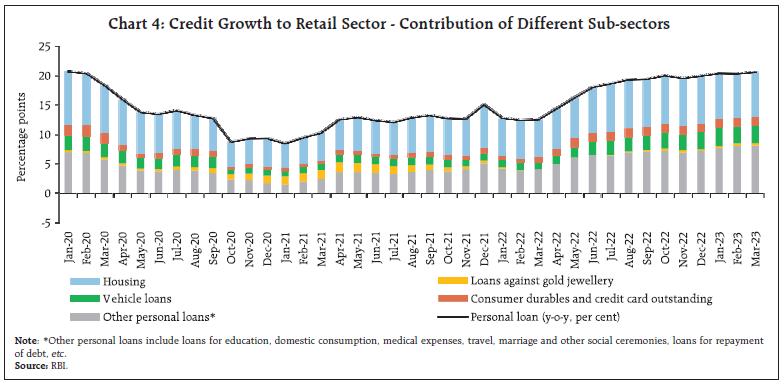 The next question is whether the increase in retail loans is structural or cyclical, and if such trend will continue in the coming years, which is discussed in the following section. IV. Is High Growth in Retail Loans to Continue? IV.1 Directional Movements from RBI Surveys As the sentiments of households represents the aggregate outcome of both their expectations and assessment of the current situation of the economy— increased sentiment of households generally increases consumer loan growth (Zuzana et al., 2022). The RBI survey on consumer confidence4 measures current perceptions and one year ahead expectations on general economic situations. The statistically significant correlation (0.62) between consumer sentiments on current economic situations and retail credit growth reflects this nexus (Chart 5). 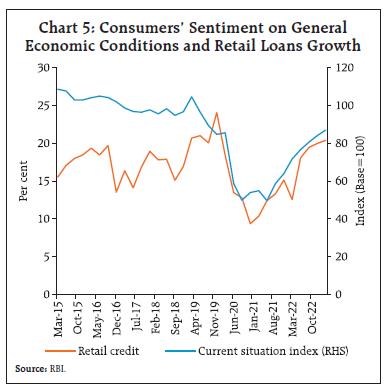 According to the bank lending survey5 conducted by the RBI, banks’ assessment of retail credit demand in Q4:2022-23 and the expectations for future demand (in Q3:2023-24) for credit moderated (Chart 6a and 6b). The actual retail credit growth moved in tandem with the credit assessment and retail credit expectations (Chart 6c and 6d). As the directional movements of sentiments of the consumers have the deterministic role on retail credit, tracking these measures would give insights into upcoming retail credit dynamics. Expectations for the retail loan demand in Q1:2023-24 show moderation and the retail loans growth may also moderate going forward. IV.2 Retail Credit Growth – Whether Cyclical in Nature? To policymakers, cycles are of foremost significance since the positive and negative deviations from the trend growth path provide the trigger for policy actions (Banerjee, 2012). The estimated retail credit cycle6 and non-food credit cycle using monthly data from April 2007 to March 2023 exhibit co-movement where expansionary and contractionary phases of retail credit cycle moved in tandem with the non-food credit cycle (Chart 7). The retail credit growth during expansionary phase averaged to 15.7 per cent whereas in the contractionary phase it averaged to 14 per cent, with contractionary phase being longer than the expansionary phase. The faster revival of the retail credit growth contributed to the overall credit growth recovery. The estimated cycles also reveal that the higher retail credit growth registered recently may be cyclical—the ‘retail-shift’ may not be structural. With the expected revival of capex cycle, the retail credit growth may slow down. Given the assessment on the retail credit dynamics so far, it would be interesting to empirically analyse the impact of the bank-specific characteristics on sectoral credit growth and provide insights into the main drivers of retail credit growth considering these bank-specific and macroeconomic variables. V. Empirical Analysis V.1 Data and Methodology To empirically analyse the role of the various factors affecting bank credit, particularly retail credit and its major components, quarterly data on key banking health variables (viz, asset quality and profitability) and macroeconomic variables (overall economic activity) are considered for the period Q1:2007-08 to Q3:2021-22 for a balanced panel of 27 SCBs, comprising all 12 public sector banks (PSBs), 11 major private sector banks (PVBs) and 4 major foreign banks (FBs), based on their share in credit in the respective groups. The ratio of interest income from advances to total advances is taken as a proxy for lending rate. 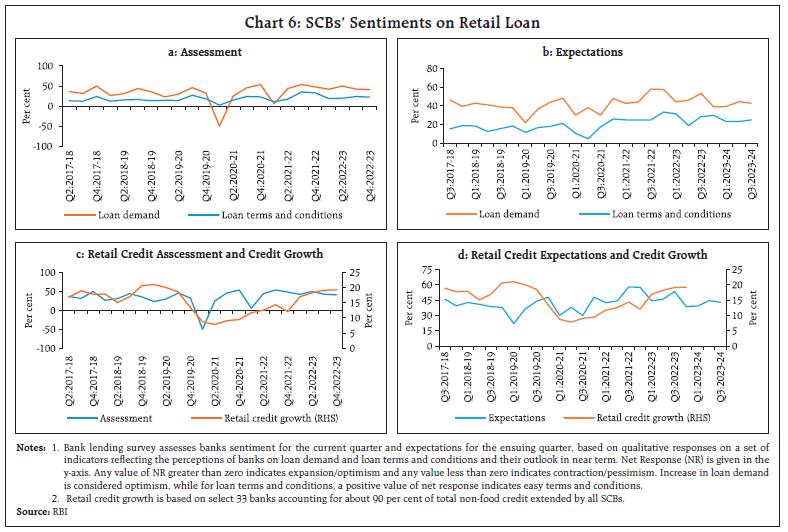
 To control for outliers, bank-wise data was winsorised (5 per cent from each side). Bank credit and other macroeconomic data are sourced from the Database on Indian Economy (DBIE), RBI. Basic descriptive statistics of bank-wise indicators for the pooled data, and the macroeconomic variables used in the analysis are given in Table 2. On average, retail loan growth exceeded overall loan growth marginally during the sample period, and within retail, housing and vehicle loans outpaced retail loans growth. On the other hand, NPA ratios in the retail segment were lower than the overall NPA ratio. V.2 Empirical Results The empirical analysis is undertaken for both retail credit and overall bank credit to assess the relative role of the various factors. In view of the panel nature of the data and involvement of the lagged dependent variables, the system generalised method of moments (GMM) approach of Arellano and Bover (1995) and Blundell and Bond (1998), is used to estimate equations 1-2. The GMM model, which is generally used for panel data, provides consistent results in the presence of different sources of endogeneity, namely “unobserved heterogeneity, simultaneity and dynamic endogeneity” (Wintoki et al., 2012). Two lags of credit growth are included to account for persistence. A positive relationship between bank credit growth and lagged GDP growth is expected. According to Aysan et al. (2010), high economic growth signifies high consumption and investment which can translate to higher demand for credit by both firms and households. A negative relationship between bank credit growth and interest rates are expected where increased interest rates reduce demand for credit. A bank’s higher NPA ratio is expected to have a negative impact on bank credit growth as banks become more cautious not to lend to risky borrowers to keep NPA ratios low. Profitable banks tend to grant more credit as they can mitigate the monetary transmission channel through bank lending (Bustemante et al., 2019). 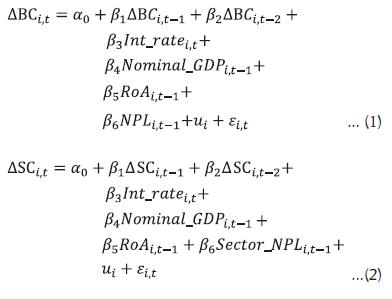 | Table 2: Descriptive Statistics | | Variable | In per cent | | Mean | SD | Min | Max | | Total Loan Growth | Overall | 11.7 | 8.0 | -6.1 | 28.0 | | Between | 3.1 | 7.2 | 20.1 | | Within | 7.4 | -8.9 | 29.8 | | Retail Loan Growth | Overall | 12.2 | 11.9 | -18.6 | 38.7 | | Between | 4.4 | 1.3 | 21.3 | | Within | 11.1 | -18.5 | 40.5 | | Housing Loan Growth | Overall | 12.6 | 11.8 | -19.2 | 44.1 | | Between | 4.9 | -1.2 | 22.8 | | Within | 10.8 | -24.7 | 52.8 | | Vehicle Loan Growth | Overall | 13.4 | 15.8 | -36.6 | 49.0 | | Between | 9.6 | -20.0 | 19.8 | | Within | 14.6 | -41.2 | 52.3 | | NPA Ratio (all loans) | Overall | 4.2 | 2.8 | 1.2 | 12.8 | | Between | 1.3 | 1.5 | 6.3 | | Within | 2.5 | 0 | 11.4 | | Retail NPA Ratio | Overall | 2.8 | 1.1 | 1.1 | 5.6 | | Between | 0.7 | 1.8 | 4.3 | | Within | 0.9 | 0.5 | 5.8 | | Housing NPA Ratio | Overall | 2.4 | 1.1 | 0.8 | 4.9 | | Between | 0.7 | 1.1 | 4.0 | | Within | 0.9 | 0.1 | 5.4 | | Vehicle NPA Ratio | Overall | 2.7 | 1.3 | 0.8 | 6.5 | | Between | 0.8 | 1.4 | 3.8 | | Within | 1.1 | 0.0 | 6.5 | | Return on Assets | Overall | 1.0 | 0.6 | -0.1 | 2.2 | | Between | 0.4 | 0.4 | 1.7 | | Within | 0.4 | -0.3 | 2.6 | | Interest Rate | Overall | 3.5 | 0.3 | 2.9 | 4.1 | | Between | 0.2 | 3.2 | 4.0 | | Within | 0.3 | 2.7 | 4.3 | | Nominal GDP Growth | Overall | 12.7 | 4.1 | 4.6 | 21.7 | Notes: 1. SD: Standard deviation; Min: Minimum; Max: Maximum.
2. Summary statistics reported are with 5% Winsorisation.
Sources: RBI; and authors’ estimates. | where, ‘i’ refers to the ith bank and ‘t’ refers to the time (quarter). BC is the Bank credit, and SC is the credit in the specific sector, i.e., retail, housing and vehicle loans. The analysis suggests that bank credit growth as well as sectoral bank credit growth is negatively related to lending rate and asset quality, and the impact is statistically significant. Stressed asset quality encourages banks to increase their investments in government securities thereby curtailing loan funds (Singh et al., 2022). On the other hand, higher profitability of the banks as well as higher economic activity boosts retail credit (Table 3). VI. Conclusion Retail bank credit has emerged as a major contributor to the overall bank credit growth, especially after the onset of the COVID pandemic. The SCBs’ expectations of retail credit demand moderated and loan terms and conditions expected to be tightened in Q3:2023-24. Moreover, based on the estimated retail credit cycle, it seems that the ongoing ‘retail-shift’ is not permanent, but rather cyclical in nature and the credit growth may not continue to be high. Empirical analysis using quarterly data for the period Q1:2007-08 to Q3:2021-22 suggests that the retail credit segment and its major constituents (housing and vehicle) are sensitive to interest rates as well as the asset quality of the banks’ loan portfolio. Housing loans are more sensitive to both interest rates and asset quality than vehicle loans for the same period. So far, the relatively better asset quality in the sector may have fueled retail credit growth. Given the global headwinds and increasing uncertainties about monetary policy actions across geographies, it is necessary to assess trends in retail credit at a granular level on a continuous basis to evaluate the impact of financial sector developments on the overall economy. | Table 3: Determinants of Bank Credit | | Explanatory Variables | Dependent Variables (Growth Rates) | | Bank Loans | Retail Loans | Housing Loans | Vehicle Loans | | (1) | (2) | (3) | (4) | | Dependent Variable (-1) | 0.82*** | 0.72*** | 0.71*** | 0.49** | | Dependent Variable (-2) | -0.07 | 0.02 | 0.04 | -0.15 | | Interest Rate | -3.73*** | -2.80** | -3.56** | -1.81** | | Nominal GDP Growth Rate (-1) | 0.15** | 0.28** | 0.11* | 0.21* | | RoA (-1) | 0.07 | 0.02* | 0.05* | 0.02 | | NPA Ratio (-1) | -0.96*** | | | | | Retail NPA Ratio (-1) | | -0.77** | | | | Housing NPA Ratio (-1) | | | -2.40* | | | Vehicle NPA Ratio (-1) | | | | -2.23** | | Constant | 0.07** | 0.08** | 0.08** | 0.22** | | No of observations | 1343 | 1343 | 1316 | 1263 | | AR (1) Test | 0.01 | 0.01 | 0.01 | 0.00 | | AR (2) Test | 0.45 | 0.07 | 0.34 | 0.09 | | Sargan Test | 0.69 | 0.77 | 0.89 | 0.05 | Notes: 1. *, **, and *** denote significance at 10, 5 and 1% level.
2. Figures in parentheses indicate lagged values.
3. Dummy variables for major crisis periods (in March 2018 and September 2020) were not found to be significant. | References Arellano, M. and Bover, O. (1995), “Another look at the instrumental variable estimation of error-components models”, Journal of Econometrics, 68(1): 29–51. Aslam, L. M. (2017), “Does consumption expenditure induce the economic growth? An empirical evidence from Sri Lanka”, World Scientific News 81(2). 221-234. Aysan. A., Dalgic .C.A. and Demicri. M. (2010), “Macroeconomic, Sector Specific and Bank Specific Determinants of Net Interest Rate Margin: What Matters More For An Emerging Market Economy?”, EcoMod 259600015. Bag, D. (2012), “Growth of Retail Credit and Its composition in Indian banking: A Macro Evaluation”, International Journal of Computing and Corporate Research, 2(3). Bannerjee, K. (2012), “Credit and Growth Cycles in India: An Empirical Assessment of the Lead and Lag Behaviour”, RBI Working Paper. Bezemer,D., Collins,J. Lerven,F. and Zhang ,L.(2023), “Credit policy and the ‘debt shift’ in advanced economies”, Socio-Economic Review, Vol. 21, No. 1, 437–478. Blundell, R., and Bond, S. (1998), “Initial conditions and moment restrictions in dynamic panel data models”, Journal of Econometrics, 87(1): 115–143. Bustamante, J., Walter, C. Rafael N. (2019), “Determinants of Credit Growth and the Bank Lending Channel in Peru: a Loan Level Analysis”, BIS Working Papers No 803. Das, S. (2020), “Indian Economy at a Crossroad: A view from Financial Stability Angle”, RBI Bulletin, July. Gopinath, S. (2005). “Retail Banking - Opportunities and Challenges”, RBI Bulletin, June. Gupta, I. (2022), “India’s Household Leverage and the COVID-19 Crisis Ramifications for the Post-pandemic Recovery Phase”, Economic and Political Weekly, Volume 57, Issue 18. Kumar, P., Senapati, M., and Prakash, A. (2021), “Changes in Sectoral Bank Credit Allocation: Developments Since 2007-08”, RBI Bulletin, September. Lombardi M. J., Mohanty M and I. Shim, (2017), “The Real Effects of Household Debt in the Short and Long Run”, BIS Working Papers No. 607. Mishra, P.K. (2011), “Dynamics of the relationship between real consumption expenditure and economic growth in India”, Indian Journal of Economics and Business, 10(4). Rao, R.S. (2014), “The Role of Retail Banking in Indian Economy”, International Journal of Engineering Research and General Science, 2(2). Reserve Bank of India (2022), Report on Trend and Progress of Banking in India, 2021-22. Roy, M. (2006), “A Review of Bank Lending to Priority and Retail Sectors”, Economic and Political Weekly 41(11) 1035-1040. Sengupta, R. and Vardhan, H. (2021), “Consumerisation of banking in India: Cyclical or structural?”, Ideas for India, July 23, 2021 Sengupta, R., and Vardhan. H. (2022), “India’s credit landscape in a post-pandemic world” Indira Gandhi Institute of Development Research, Working Papers 2022-019, Indira Gandhi Institute of Development Research, Mumbai, India. Singh, S., Wahi, G. and Kapur M. (2022), “Banks’ Credit and Investment Dynamics: Assessing Portfolio Rebalancing and Crowding-out”, RBI Working papers, No. 09. Vishwanathan,N.S. (2018), “It is not Business as Usual for Lenders and Borrowers”, RBI Bulletin, May. Wintoki, M. B., Linck, J. S. and Netter, J. M. (2012). “Endogeneity and the dynamics of internal corporate governance”. Journal of Financial Economics, (105)3, 581–606. Zuzana, R., Dominika, E. and Hodula, M (2020). “The Power of Sentiment: Irrational Beliefs of Households and Consumer Loan Dynamics”, Working Paper Series, no.10/2020, Czech National Bank.
|