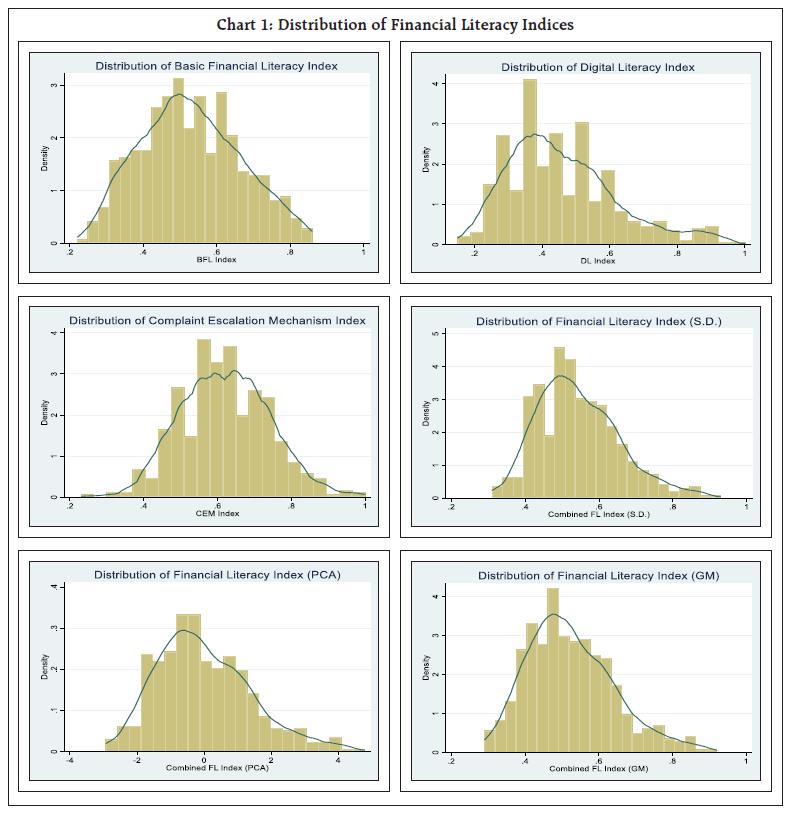
by Sakshi Awasthy^, Rakhe Balachandran#, Barkha Gupta^, Rajas Saroy^, Ashish Khobragade^, Gunveer Singh*, Rekha Misra^, Sarat Chandra Dhal^ Financial literacy is important to make financial inclusion meaningful in leading to economic well-being. This article derives insights from a survey conducted among the household financial decision-makers who are yet to be covered by financial literacy programmes (FLPs). Financial literacy is heterogenous across financial aspects and demographic segments. Higher financial literacy is associated with individuals who are economically well-off, educated, younger and have access to smartphones. While basic financial concepts are reasonably understood, there is scope for raising awareness regarding digital aspects, complaint escalation mechanisms and overall, comprehensive financial knowledge. Introduction Financial literacy is defined as a combination of financial awareness, knowledge, skills, attitude, and behaviour necessary to make sound financial decisions and achieve individual financial well-being (OECD, 2012; RBI, 2021). From a generalised perspective, financial literacy encompasses three components; (a) financial awareness and knowledge of financial products and institutions (Carpena et al., 2011); (b) financial capability involving money management and financial planning (Xu and Zia, 2012), and (c) financial skills required to understand complex concepts like interest compounding, inflation, and risk diversification (Lusardi and Mitchell, 2014). With the growing availability of complex products, consumers are confronted with baffling choices in the financial arena. Without necessary financial literacy, consumers often miss the downside risks associated with these products and get exposed to financial losses. Further, financial education plays a vital role in creating demand-side response by enabling greater awareness and access to appropriate financial products and services through regulated entities; thereby strengthening the financial resilience of households (Das, 2020; 2021). Thus, financial literacy constitutes a pre-condition for financial inclusion and a necessary condition for economic well-being. Documenting financial literacy is important as it would reveal the financial aspects and population segments that deserve targeted policy attention. Driven by this perspective, this article presents facts on the financial literacy of rural masses belonging to remote villages. In India, financial literacy forms an important developmental agenda for the Government, the Reserve Bank of India (RBI), and other financial sector regulators. The RBI has taken various initiatives in the pursuit of creating a financially aware India including, inter alia, the setting up of the National Centre for Financial Education (NCFE) in collaboration with other financial sector regulators, the Centre for Financial Literacy (CFL) project - an innovative way to impart financial education through community approach, and public awareness campaigns via various media channels. Adopting a multi-stakeholder approach, the NCFE has laid out the National Strategy for Financial Education (NSFE) for 2020-2025, with the objectives of inculcating financial literacy concepts and augmenting safe use of digital financial services while managing risks. To stocktake financial literacy, a survey was conducted in eight randomly selected villages of West Bengal, having a population of less than 2000, with questions focussing on financial awareness and knowledge of financial concepts/products/institutions. Since the selected sample is representative of more than 2.5 lakh villages (in terms of literacy), takeaways from the study could be useful in fine-tuning existing policies to impart financial and digital literacy in the hinterlands. However, the respondents did not receive any Financial Literacy Programmes (FLPs) at the time of this survey, either from the RBI or scheduled commercial banks or CFL. Hence, the extent of financial literacy revealed in this study does not, in any way, reflect the effectiveness of FLPs. In a highly literate economy, financial literacy should be distributed with negative skewness, i.e., with the majority of the participants at the right end of the distribution. In contrast, a slightly positively skewed financial literacy curve, revealed in this study, indicates that there is scope for improving financial literacy in the far-off villages. The level of awareness is relatively reasonable on basic financial concepts, albeit, low on digital aspects, complaint escalation mechanisms and overall comprehensive financial knowledge. Empirical analysis using beta regression and linear models underscores the significance of demographic drivers of financial literacy, viz., economic background, age, education and occupation. In sum, along with the horizontal expansion of including various demographic segments and financial aspects under the FLPs, vertical deepening in terms of enhancing detailed financial knowledge is also important to make financial literacy meaningful for economic well-being. The remainder of the study is presented in seven sections: a review of the literature (II), features of the questionnaire (III), details of the study area and sample selection (IV), the estimation of financial literacy indices (V), survey findings (VI), regression results for covariates of financial literacy (VII) and conclusion (VIII). II. Review of Literature The role of financial literacy is extensively addressed in the literature. Besides ensuring a household’s well-being and economic stability, financial literacy has been identified as a growth augmenting factor (Huston, 2010; Beckmann, 2013). Households with higher levels of financial literacy are more likely to plan for retirement (Banks et al., 2010); participate in financial markets with a more sophisticated investment outlook (Christelis et al., 2010); and accumulate more wealth (Behrman et al., 2010). On the other hand, the absence of the necessary financial knowledge has been associated with costly borrowing and high debt load for economies (Klapper and Panos, 2011). Research has shown that financial mistakes are often an upshot of lower financial knowledge and underdeveloped cognitive ability, warranting focussed policy emphasis on developing financial prowess (Agarwal et al., 2009). Among various factors impacting financial literacy, age, education, gender, occupational status, and income have gained prominence in the literature (Morgan and Trinh, 2017). Women have lower levels of financial knowledge than men in most countries, while both younger and older populations showcased lower financial know-how than their middle-aged counterparts. There exists a positive relationship between income and financial literacy, as well as between education and financial knowledge (Singla and Mallik, 2021). Further, studies have also found that retired or self-employed individuals possess lower financial literacy than their salaried counterparts (Choudhary and Kamboj, 2017). Besides, urban people possess higher financial literacy than the rural populace (Klapper and Panos, 2011). Such variations in socio-demographic characteristics also have a bearing on attitude, beliefs, confidence level, and willingness of an individual to learn financial concepts (Australian Securities and Investments Commission, 2011). A segment of the literature has also assessed the pathways through which FLPs can influence financial behaviour, economic performance, and social welfare of households. Although the relevant literature is vast, there is mixed evidence on the effect of FLPs in influencing economic behaviour. Survey data-based analysis indicates positive correlations between FLPs and behaviours, however, there exists a dearth of causal experimental analysis eliciting a clear positive impact (Carpena et al., 2015). Some studies have concluded a modest impact of FLPs on financial behaviour (Fernandes et al., 2014), and a quick dissipation of impacts (Bruhn et al., 2014). Lack of consensus on the effectiveness of FLPs can be ascribed to heterogeneity in financial literacy measures across studies and possible omitted variable bias that make comparisons tricky (Fernandes et al., 2014). Hence, target-specific interventions rather than a one-size-fits-all policy are deemed better at accounting for baseline differences in individual behaviour. III. Survey Design and Questionnaire The study uses a detailed questionnaire to document financial literacy, defined as ‘knowledge of banking concepts/products/institutions, including digital banking and complaint escalation mechanisms, that are required to make informed, safe and convenient banking decisions and to protect oneself from financial frauds’. The financial literacy material of the Financial Inclusion and Development Department (FIDD), RBI, was utilised to design the questionnaire. The questions were divided into sections on basic financial literacy, digital financial literacy, and literacy on frauds and complaint escalation mechanisms. At the outset, the purpose of the survey was explained to the respondents. Participation in the survey was optional and the participants were not rewarded. The confidentiality statement, that ‘the individual specific information collected through the survey will only be used for research and policy purposes’, was spelt out to the participants before starting the survey. Computer-assisted personal interviews (CAPIs) were conducted for the survey using tablets so that the collected data is immediately saved to a server, thus, avoiding possible manual data entry mistakes. To minimise investigator-induced bias, a training programme was conducted, where the purpose of each question, along with the manner of posing the questions was detailed. The survey was monitored in the field to ensure consistency of the questioning method across enumerators, to avoid inducing any answers from the respondents and to prevent sharing of any additional information with the respondents. Further, various steps were taken to address questionnaire-induced bias, including pre-testing the survey questionnaire through pilots, and translating the questionnaire into local language (Bengali). All questions were close-ended to make data collection and processing easier, and had the option ‘Do Not Know’ to avoid imposing any given answer on the participants. This helps in conceptually differentiating between a wrong answer and a ‘Do Not Know’, while measuring financial literacy. Similarly, all the multiple-choice questions (MCQs) had the option of ‘Others’, so that the respondent is not constrained by the limited choices provided in the questionnaire. Further, all the options of MCQs were presented before the participants in the same order to avoid bias in responses that may stem from differential impact on the thought process of respondents. Consumption expenditure is used as a proxy for income, as respondents were seen sidestepping questions on income in the pilot. However, data on monthly consumption expenditure is beset with the problem of recall error. While weekly consumption expenditure data is usually free from recall error, extrapolating these data to the monthly level is not conceptually sound as it implicitly assumes uniform consumption pattern across the weeks of a month. In the pilot survey, it was noticed that most of the households purchased monthly groceries from a local grocery shop (kirana shop), and these items were comparable across shops in different villages. It was also observed that participants were more confident about providing their monthly grocery expenditure than providing expenditure on specific items. Hence, in the main survey, a question on monthly grocery expenditure was included to approximate consumption expenditure. To supplement the data on consumption expenditure, information on housing conditions and household assets was collected. Data on housing conditions included number of bedrooms, whether there is a separate kitchen and living/dining room, and material used for constructing the roof, wall, and floor of the house. Data on household assets collected information regarding the possession of various assets such as fridge, television, bicycle, etc. The questionnaire also collected detailed information on demographic and social characteristics of the households. The respondents can induce bias in multiple ways in primary survey-based studies. To capture unbiased information on the usage of banking channels, it was ensured that only the main financial decision-maker of the household was interviewed. If the main respondent was not available at the time of the survey, a member who was aware of all the major financial decisions of the household was interviewed. Further, when some respondents are uninterested in the survey and decide to respond a specific option in the MCQs (e.g., first option or third option for all questions irrespective of the financial literacy aspect), it distorts the correct estimation (viz., either underestimation or overestimation) of financial literacy. To address this, correct answers were randomly placed in all the MCQs, such that the average estimations are not affected. Further, participants could select more than one answer in MCQs to distinguish between the participants who were guessing the answers from those who had clear knowledge, thus, minimising the respondent-induced bias. A section on verification questions on each financial aspect was also introduced to approximate the correct level of financial literacy. To illustrate, in the basic financial literacy section, it was enquired whether the respondent is aware of savings/current account. In the verification section, it was further enquired whether the respondent knows which type of account (savings/current) provides interest. These verification questions were deliberately placed towards the end of the survey to ensure unbiased answers to these questions, irrespective of answers in the other financial literacy sections. IV. Study Area and Sample Selection For the selection of the sample district from West Bengal, literacy rates and labour force participation rates (LFPRs) of districts at the all-India level were considered from the Census 2011. First, for analytical convenience, literacy rates and LFPRs of each district of West Bengal were standardised using the averages of the mean and standard deviation of these two variables at the all-India level. Following this, weighted arithmetic means of standardised literacy rate (60 per cent) and LFPR (40 per cent) were calculated for each district of West Bengal. Finally, among the six districts of West Bengal that had weighted mean within the range of 0±0.2, Paschim Medinipur was selected after considering the survey logistics. For the selection of blocks from Paschim Medinipur, the distance of each block from the average literacy rates and LFPRs of the district was calculated. Kharagpur II is the block closer to the district average in terms of literacy (60 per cent) and labour participation rate (40 per cent). Next, the distance of other blocks from Kharagpur II on these criteria was calculated. From among the various blocks that were closer to Kharagpur II, Garbeta II was selected after considering the survey logistics. Four villages each from Kharagpur II and Garbeta II with a population of less than 2000 were selected randomly. To ensure the random selection of households from these villages, different paras (meaning ‘cluster of households’ in Bengali) in the villages were identified. Village-level paras are often differentiated by caste or community. Hence, to bring down the sample-induced bias, households were selected from each para of the sample villages. Within the paras, to ensure a random selection of households, every 3rd household was included in the sample. This was done as a second-best option in the absence of a reliable village-level household list that can be used as a sampling frame. The total sample size was 505 households across eight villages and the survey was conducted in the last two weeks of September 2022. The primary considerations for selecting West Bengal for the survey was the relatively low banking penetration in the eastern areas and survey logistics. Even though the sample villages belong to West Bengal, the validity of the results need not be restricted to the State alone. To illustrate, the average literacy rate of sample villages is 0.70, whereas the average literacy rate of villages having less than 2000 population at the all-India level is 0.57. There are around 2,58,429 villages that fall right to this mean literacy rate, i.e., 0.57, and whose average literacy rate is 0.68. The average LFPR of these right-tail villages at 0.46 is also close to that of the sample villages at 0.44. Further, another important covariate of financial literacy, the gender ratio, is also comparable between these right-tail villages (0.97) and the sample villages (0.97). Hence, the insights from this survey-based study on eight random villages can be roughly representative of more than 2.5 lakh villages in the country. V. Estimation of Financial Literacy and Economic Indices Based on the data collected through the questionnaire, the financial literacy index for each survey participant was calculated. While doing this, all ‘YES’ answers received a score of one and all ‘NO’ answers received a score of zero in all the ‘YES’ or ‘NO’ (Y/N) questions. In questions with options of ‘YES’, ‘NO’, and ‘DO NOT KNOW’ (YND), while the right answer received a score of one, the wrong answer received a score of minus one and ‘DO NOT KNOW’ received a score of zero. Thus, a confident wrong answer is penalised more than a ‘do not know’. For MCQs, only the right answer received a score of one. If the right answer was selected along with a wrong answer, negative marking was applied to the score of one. Illustratively, if there are a total of four answer options, each wrong answer is assigned a negative score of 0.25, and the selection of the right answer along with a wrong answer result in a score of one minus 0.25, and so on. This allowed capturing of the partial knowledge accurately. Thus, the indices based on Y/N questions were in the range of zero to one, while indices based on YND and MCQs were in the range of minus one to plus one. The indices based on YND and MCQs were normalised within the range of zero to one, to work out three combined indices on Basic Financial Literacy (BFL), Digital Financial Literacy (DFL), and Complaint Escalation Mechanism (CEM). The percentage of questions in each category was used as weights in these three indices (Table 1). Followed by this, three variants of the Combined Financial Literacy (CFL) index were worked out. In CFL-SD, the standard deviations were used for computing weights to combine the sub-indices of BFL, DFL, and CEM, following the methodology of Global Gender Gap Index of the World Economic Forum {Table 2}. This weightage will provide a lower weight to the sub-index with higher standard deviation. In CFL-GM, the geometric mean of three sub-indices was taken to arrive at the final combined index, following the methodology of Human Development Index of the United Nations Development Programme. This method reduces substitutability across the three sub-indices in the final index. In CFL-PCA, the principal component analysis (PCA) was employed and the first component was taken as the final index. For calculating the economic index, the information on housing conditions, household assets and consumption patterns was combined using PCA. | Table 1: Construction of BFL, DFL and CEM sub-indices of Combined Financial Literacy Index (CFL) – By Question Type | | Combined Indices | Basic Financial Literacy (BFL) | Digital Financial Literacy (DFL) | Complaint Escalation Mechanism (CEM) | | Yes/No Questions | 0.41 | 0.40 | 0.10 | | Yes/No/Do not know Questions | 0.37 | 0.55 | 0.60 | | Multiple Choice Questions | 0.22 | 0.05 | 0.30 | Sample Profile The total sample size was 505 households spread across eight villages of Paschim Medinipur district. The study sample is relatively young with a mean age of 39 and a standard deviation of 12.8. The number of respondents having education higher than matriculation is low, even though the literacy rate is high in the sample. Two-thirds of the sample are males. The sample shows a good representation of different caste groups. All economic indicators point to the low economic status of households in the sample. To illustrate, among the housing characteristics, only 38 per cent have a separate kitchen and 21 per cent have a separate living/dining room in their houses. The monthly grocery expenditure is positively skewed, even though the distribution of households with more than four members is comparable across the expenditure categories, except ‘less than ₹1,000/-’. The frequency of consumption of different food items indicates that the relatively expensive food items like fruits and mutton are consumed by a relatively lower percentage of the sample as compared to the frequency of consumption of other items like vegetables, fish, and eggs even after adjusting for households who permanently do not eat some of these food items (Annex I-a, I-b and I-c). | Table 2: Construction of CFL-SD Index | | | Mean | Std. Dev. | 0.01/Std. Dev | Weights used in index | | BFL | 0.53 | 0.13 | 0.073 | (0.073/0.219) = 0.34 | | DFL | 0.46 | 0.16 | 0.062 | (0.062/0.219) = 0.28 | | CEM | 0.62 | 0.12 | 0.083 | (0.083/0.219) = 0.38 | VI. Survey Findings The financial literacy landscape of the sample villages displays a mixed picture. The preferred CFL-SD index is distributed with a mean of 0.54 with the lowest value being 0.31 and the highest value being 0.93. Since in this index, higher weightage is given to the sub-index with lower standard deviation, community closeness in literacy is given higher weightage and vice versa. Hence, CEM received the highest weightage followed by BFL and DFL in this index. In CFL-SD, 364 observations (72.1 per cent) fall within one standard deviation of the mean. Yet, overall financial literacy is slightly positively skewed in the whole sample as against a negatively skewed distribution expected in a highly financially literate economy. Interestingly, the positive skewness is more prominent in the DFL as compared to other indices, indicating low digital financial literacy (Table 3 and Chart 1). | Table 3: Descriptive Statistics - Financial Literacy Indices | | Variable | Obs | Mean | Std. dev. | Min | Max | | BFL | 505 | 0.53 | 0.14 | 0.22 | 0.86 | | DFL | 505 | 0.46 | 0.16 | 0.15 | 1 | | CEM | 505 | 0.62 | 0.12 | 0.23 | 1 | | CFL_SD | 505 | 0.54 | 0.11 | 0.31 | 0.93 | | CFL-PCA | 505 | -3.78e-09 | 1.40 | -2.93 | 4.79 | | CFL_GM | 505 | 0.52 | 0.12 | 0.29 | 0.92 | | Note: BFL: Basic Financial Literacy Index; DFL: Digital Financial Literacy Index; CEM: Index on Frauds and Complaint Escalation Mechanism; CFL-SD: Combined Financial Literacy Index using an inverse of Standard deviation as weights; CFL-PCA: Combined Financial Literacy Index as the first component from Principal Component Analysis; CFL-GM: Combined Financial Literacy Index as the geometric mean of three sub-indices. |
 The awareness regarding nomination in the bank accounts and passbook is very high in the sample, especially on why the regular updating of the passbook is important. The awareness thins down on cheques, different types of bank accounts, and interest rates. A relatively higher percentage of respondents were aware of savings accounts (51.0 per cent) as compared to current accounts (17.2 per cent). Forty-one per cent reported that they knew what an interest rate is, however, only 38 per cent responded that a higher interest rate on deposits is beneficial. While 67 per cent had heard about cheques, only 26.5 per cent could answer whether ‘a cheque has an expiry date’. While 10 per cent had heard about overdraft, none of them could answer the concept of overdraft correctly (Annex II). Eighty-five per cent of the respondents knew about ATM/Debit cards, yet only 63 per cent answered that they could not withdraw coins from ATMs and only 34 per cent could explain how to withdraw money from ATMs. Kisan credit card (KCC) is more popular (73.3 per cent) in rural areas as compared to general purpose credit card (GCC) [28.7 per cent]. Only 10.9 per cent could answer which card does not allow borrowing of money from among the KCC, GCC and debit cards. Awareness regarding one-time password (OTP) was relatively low with 47 per cent reporting that they had heard about it, and only 35 per cent of the respondents providing the correct answer to ‘where can you find the OTP’. A relatively higher percentage of respondents (42.4 per cent) were aware that they could conduct banking transactions through smartphones as compared to using feature phones (15.1 per cent). Even though 35 per cent of the respondents reported that they knew internet banking, only nine per cent could correctly tell the information required to conduct an internet banking transaction. While 23 per cent reported that they knew what a Unified Payments Interface (UPI) ID is, when asked which among the four mediums - IFSC code, QR code, UPI ID and mobile number - cannot be used to send money through UPI, only nine per cent could answer correctly (Annex III). Literacy on possible fraud and complaint escalation mechanisms is essential to manage one’s bank account safely. Most of the respondents were aware that they are not supposed to reveal their bank account details to anyone else, including handing over the chequebook. Respondents were also aware that they should not click on any link that they receive through digital platforms offering big gifts/ lottery/job offers. However, roughly 42 per cent were either confused or believed that banks/RBI can indeed call them directly asking for the bank credentials. Regarding the complaint escalation mechanism, around 76 per cent confidently stated that in case they lose money from their bank account/ATM, they should immediately inform their bank branch, while 25 per cent stated along with informing the branch, they would also inform the police. However, only 23.5 per cent knew that they could escalate the complaint to banking lokpal/Ombudsman if the bank is not promptly helping them. Moreover, a majority reported that the banking ombudsman is available at the bank branch (Annex IV). VII. Financial Literacy – Significant Covariates In line with the existing literature, the major socio-demographic-economic and financial variables are taken as independent variables. Given the bounded and continuous nature of the outcome variable (CFL Index) within the standard unit interval (0,1), the beta regression model (Ferrari and Cribari-Neto, 2004) is employed for empirically estimating the association between demographic characteristics and financial literacy levels (Model 1). In these cases, beta regression is considered superior to ordinary least squares (OLS) as the latter assumes homoscedasticity of errors that may not be satisfied as variability of such indices (scores) reduces as the mean approaches the bounds (Kieschnick and McCollough, 2003), leading to biased and out-of-range predictions. For robustness checks, two other variants of the CFL index are modelled, as detailed in section V, computed using (a) geometric mean (Model 2) and (b) principal component analysis (Model 3) on the BFL, DFL and CEM sub-indices. Since the index constructed using PCA breaches the (0,1) constraint, the OLS regression is used to estimate this model. To account for heteroscedasticity, robust standard errors are used across the models. The zero-order correlation matrix with all the variables is provided in Table 4. | Table 4: Zero-order Correlation Matrix | | Variables | Age | HH size | Education | Occupation | Smartphone | Eco Index | | Age | 1.00 | | | | | | | HH size | -0.05 | 1.00 | | | | | | Education | -0.22 | 0.05 | 1.00 | | | | | Occupation | -0.44 | -0.04 | 0.22 | 1.00 | | | | Smartphone | -0.45 | 0.09 | 0.42 | 0.27 | 1.00 | | | Eco Index | 0.01 | 0.08 | 0.25 | 0.07 | 0.23 | 1.00 | | Note: HH size – Household size and Eco Index – Economic Index | Financial literacy levels vary significantly by the socioeconomic profile of the populace (Xu and Zia, 2012). The results show that higher educational attainment is associated with improved financial literacy (Table 5). Compared to the base of farming as an occupation, homemakers are relatively less financially literate. Age is negatively associated with financial awareness in the sample, suggesting that the younger generation tends to be more well-versed in financial concepts. On the economic front, better financial security in the household is linked to higher levels of financial literacy. Interestingly, smartphones emerge as a key enabler of literacy, indicating that access to internet-enabled handsets can open avenues for improving financial knowledge. The size of the household does not significantly impact financial literacy scores. These inferences hold across rest of the models regardless of the model type and methodology, thus, validating the robustness of results (Table 5). | Table 5: Regression Results for Socioeconomic Determinants of Financial Literacy | | | (1)
Model 1 | (2)
Model 2 | (3)
Model 3 | | Dependent variable | CFL_SD | CFL_GM | CFL_PCA | | Method | Beta Regression | Beta Regression | OLS | | Age | -0.004***
(0.001) | -0.005***
(0.001) | -0.001***
(0.001) | | Occupation | | | | | Labour | -0.061**
(0.032) | -0.057*
(0.034) | -0.018
(0.011) | | Self-employed | 0.040
(0.040) | 0.058
(0.042) | 0.021
(0.014) | | Salaried class | 0.098*
(0.062) | 0.113*
(0.064) | 0.037
(0.023) | | Homemaker | -0.111**
(0.044) | -0.131***
(0.048) | -0.045***
(0.016) | | Not working | -0.051
(0.045) | -0.056
(0.049) | -0.019
(0.017) | | Level of education | 0.062***
(0.009) | 0.068***
(0.009) | 0.023***
(0.003) | | Economic Index^ | 0.062***
(0.009) | 0.064***
(0.011) | 0.023***
(0.003) | | Household size | 0.009
(0.009) | 0.009
(0.009) | 0.003
(0.003) | | Smartphone | 0.085***
(0.031) | 0.088***
(0.032) | 0.029**
(0.011) | | Intercept | -0.341***
(0.072) | -0.398***
(0.075) | 0.487***
(0.026) | | Number of observations | 504 | 504 | 504 | | BIC | -960.59 | -913.32 | -931.01 | | AIC | -1015.48 | -968.21 | -981.68 | | Log pseudolikelihood | 520.74 | 497.11 | - | | Wald Chi-square (11) | 326.18*** | 354.24*** | - | Note: (a) Robust standard errors in parenthesis with significance levels: * p < 10 per cent, ** p < 5 per cent, and *** p < 1 per cent.
(b) Reference categories for occupation: Farming; for smartphone: no access.
(c) Level of education is on the scale 1 (never attended school and cannot read and write), 2 (never attended school but can read and write), 3 (primary), 4 (matriculation), 5 (higher secondary), 6 (diploma course), 7 (graduation), and 8 (post-graduation).
(d) ^ Economic Index is constructed by using Principal Component Analysis (PCA) on three sub-indices – asset ownership, consumption expenditure, and housing facilities.
(e) Model selection criteria for Models 1 and 2 show that the appropriate link function is complementary log-log (cloglog) with the lowest Bayesian Information Criterion (BIC). | VIII. Conclusion This study provides a snapshot of the extent of financial literacy in rural West Bengal. The stocktaking of financial literacy would be beneficial in revealing gaps and adopting a targeted approach. Given that the selected sample is representative of more than 2.5 lakh villages (in terms of literacy), takeaways from the study could be useful in fine-tuning existing policies to impart financial and digital literacy in the hinterlands. However, this study does not reveal the effectiveness of FLPs since the sample villages did not receive any literacy programmes. Using a detailed questionnaire that comprised questions on basic financial concepts/products/ institutions, digital aspects and complaint escalation mechanisms, it is found that the distribution of the financial literacy index (CFL) in the sample is slightly positively skewed as against a preferable negatively skewed distribution. While basic financial concepts are reasonably understood, there is scope for raising awareness regarding digital aspects, complaint escalation mechanisms, and overall, comprehensive financial knowledge. This is evident in the relatively normally distributed BFL as compared to DFL. Empirical analysis using beta regression and linear models validates the demographic drivers of financial literacy and shows that the FLPs could benefit from targeting individuals with limited educational attainment and lower income levels, with a special focus on older age groups in rural areas. Going ahead, along with the horizontal expansion of including various demographic segments and financial aspects under the FLPs, vertical deepening in terms of enhancing detailed financial knowledge is also important to make financial literacy meaningful in leading to economic well-being. References Agarwal, S., Driscoll, J. C., Gabaix, X., & Laibson, D. (2009). The age of reason: Financial decisions over the life cycle and implications for regulation. Brookings papers on Economic Activity, (2), 51-117. Singla, A., & Mallik, G. (2021). Determinants of financial literacy: Empirical evidence from micro and small enterprises in India. Asia Pacific Management Review, 26(4), 248-255. Australian Securities and Investments Commission. (2011). Financial literacy and behavioural change. Research Report 230, Australian Securities and Investments Commission, Sydney. Retrieved from https://www.moneysmart.gov.au Banks, J., o’Dea, C., & Oldfield, Z. (2010). Cognitive function, numeracy and retirement saving trajectories. The Economic Journal, 120(548), F381-F410. Beckmann, E. (2013). Financial literacy and household savings in Romania. Numeracy, 6(2), 9. Behrman, J. R., Mitchell, O. S., Soo, C. K., & Bravo, D. (2012). How financial literacy affects household wealth accumulation. American Economic Review, 102(3), 300-304. Carpena, F., Cole, S. A., Shapiro, J., & Zia, B. (2011). Unpacking the causal chain of financial literacy. World Bank Policy Research Working Paper, (5798). Carpena, F., Cole, S., Shapiro, J., & Zia, B. (2015). The ABCs of financial education. Choudhary, K., & Kamboj, S. (2017). A study of financial literacy and its determinants: Evidence from India. Asian Journal of Accounting Perspectives, 10(1), 52-72. Das, Shaktikanta (2020), ‘National Strategy on Financial Education 2020-25’, RBI Bulletin, January. Das, Shaktikanta (2021), ‘Financial Inclusion – Past, Present and Future’, RBI Bulletin, August. Fernandes, D., Lynch Jr, J. G., & Netemeyer, R. G. (2014). Financial literacy, financial education, and downstream financial behaviors. Management Science, 60(8), 1861-1883. Ferrari, S., & Cribari-Neto, F. (2004). Beta regression for modelling rates and proportions. Journal of applied statistics, 31(7), 799-815. Huston, S. J. (2010). Measuring financial literacy. Journal of consumer affairs, 44(2), 296-316. Kieschnick, R., & McCullough, B. D. (2003). Regression analysis of variates observed on (0, 1): percentages, proportions and fractions. Statistical modelling, 3 (3), 193-213. Klapper, L., & Panos, G. A. (2011). Financial literacy and retirement planning: the Russian case. Journal of Pension Economics & Finance, 10(4), 599-618. Lusardi, A., & Mitchell, O. S. (2011). Financial literacy and planning: Implications for retirement wellbeing (No. w17078). National Bureau of Economic Research. Lusardi, A., & Mitchell, O. S. (2014). The economic importance of financial literacy: Theory and evidence. Journal of economic literature, 52(1), 5-44. Morgan, P. J., & Trinh, L. Q. (2019). Determinants and impacts of financial literacy in Cambodia and Viet Nam. Journal of Risk and Financial Management, 12(1), 19. OECD. (2012). High-level Principles on National Strategy for Financial Education. RBI (2021). National Strategy for Financial Education: 2020-2025 Xu, L., & Zia, B. (2012). Financial literacy around the world: an overview of the evidence with practical suggestions for the way forward. World Bank Policy Research Working Paper, (6107). Van Rooij, M., Lusardi, A., & Alessie, R. (2011). Financial literacy and stock market participation. Journal of Financial Economics, 101(2), 449-472.
Annex I-a: Socio - Demographic Characteristics | (Per cent) | | Education | Not literate | Literate and up to primary | Secondary / Matriculation (10th) | Higher Secondary | Graduate/ Postgraduate | | 5.9 | 32.3 | 35.5 | 15.1 | 10.3 | | Gender | Female | Male | | | | 33.3 | 66.7 | | | | Religion | Hindu | Prefer not to answer | Others | | 96.4 | 3.2 | 0.4 | | Caste | SC | ST | OBC | General | | 26.9 | 16.4 | 14.1 | 41.6 | Annex I-b: Housing Conditions | (Per cent) | | Number of bedrooms | One
(35.8) | Two
(44.4) | Three
(12.3) | More than three
(7.5) | | Separate kitchen | Yes
(38.4) | No
(61.6) | | | | Separate living/dining room | Yes
(21.0) | No
(79.0) | | | Annex I-c: Consumption Pattern | (Per cent) | | | Less than ₹1,000/- | ₹1,001/- to ₹2,000/- | ₹2,001/- to Rs. 3,000/- | More than ₹3,001/- | | | Monthly grocery expenditure | 20.2 | 42.6 | 17.0 | 20.2 | | Percentage of HHs with more than 4 members | 32.4 | 39.1 | 39.5 | 42.2 | | | Farmer | Homemaker | Casual labour | Salaried | | Occupation | 37.4 | 22.2 | 13.3 | 5.9 | | Percentage of households that consumed | Daily | Two to three times a week | Once a week | We do not eat it | Did not eat in the week prior to the survey | | Fruits | 4.2 | 23.0 | 12.9 | 5.0 | 55.5 | | Cake, sweets | 2.8 | 17.6 | 15.6 | 5.9 | 58.0 | | Chicken | 0.8 | 14.5 | 35.5 | 2.6 | 46.7 | | Mutton | 0.2 | 1.4 | 5.2 | 13.9 | 79.4 | | Vegetables | 91.3 | 8.7 | - | - | - | | Fish | 11.7 | 46.9 | 29.5 | 1.0 | 10.9 | | Eggs | 6.5 | 36.8 | 30.5 | 3.4 | 22.8 | | Milk | 30.9 | 19.2 | 6.7 | 10.7 | 32.5 |
|