The global economy is transfixed in the cross-currents of slowing growth and high inflation, and an uneasy calm prevails in the global financial markets as they await clearer signals from policy authorities on banking regulation and supervision, and contours of deposit insurance. In April and the first half of May 2023, domestic economic conditions have sustained the quickening of momentum seen in the last quarter of 2022-23. Headline inflation eased below 5 per cent in April 2023, for the first time since November 2021. Corporate earnings are beating consensus expectations, with banking and financial sectors posting strong revenue performance, aided by robust credit growth. In the first quarter of 2023-24, growth is expected to be driven by private consumption, supported by reviving rural demand, and renewed buoyancy in manufacturing on easing of input cost pressures. Introduction With inflation dipping and stalling globally after its prolonged upward surge, central banks have either moderated or paused their rate actions. Along with forceful resolution of financially distressed banks, this has brought an uneasy calm to global financial markets as they await clearer signals from policy authorities regarding the future course of bank regulation and supervision, and the contours of deposit insurance. The window of relief has, however, allowed markets to regain verve. Equities and bonds have clawed back lost ground although bank shares underperformed the broader equity indices. Once risk-on sentiment returned, corporate bond spreads narrowed. Currencies have traded in a narrow range with the US dollar having retreated from its monotonic rise through most of the year gone by. Portfolio flows are returning to emerging markets, and this has supported their currencies. The global economy is transfixed in the cross hairs of these complex pulls. At the start of the second quarter of 2023, i.e., in April, global growth was resilient going by high frequency indicators, sustaining the momentum it had gained in the first quarter of the year. On a month-on-month (m-o-m) basis, retail sales growth has picked up in March. Purchasing managers’ indices (PMIs) pointed to strong output growth in April – at its highest since mid-2022. This resilience has been driven mainly by services, including tourism and financial services, while manufacturing continued to struggle, and new export orders remained muted. Goods producing firms are mainly filling order backlogs while unwinding safety stocks of inputs. Stocks of finished goods have begun to rise, and capacity continues to be strained. Services will, hence, be the immediate growth driver and this presages the sustained strength of employment. The constellation of risks raises policy challenges amidst a renewed disconnect between markets and central bank communication. Broader issues have opened up around the scope for fiscal consolidation in 2023 if growth slows, and the risk this may pose to the disinflationary stance of monetary policy. High debt levels sit on the cross-currents of these tensions as borrowing costs become sensitive to the tightening of financial conditions. Another challenge is the interaction between financial stability and macroeconomic stability: should monetary policy makers consider financial stability risks in their decision making? Or is monetary policy too blunt an instrument and, therefore, should be resolutely committed to macroeconomic stabilisation, while central banks employ other tools such as liquidity management and prudential policies to fulfil their responsibility for financial stability? For now, central banks have chosen the second path, but if financial stress intensifies again and broadens this time – analysts believe that commercial real estate is the ‘next shoe to drop’1 – it could impose a binding constraint on the conduct of monetary policy. Normalising central banks’ pandemic-bloated balance sheets is intertwined into this dilemma. The World Economic Forum’s fourth edition of the Future of Jobs Survey released on April 30, 2023 brings together perspectives across the 2023-27 timeframe of 803 companies collectively employing more than 11.3 million workers across 27 industry clusters and 45 economies from all world regions. Over 85 per cent of these organisations identify adoption of new and frontier technologies, broadening digital access and environmental, social and governance (ESG) standards as most likely to drive transformation. More than 75 per cent of companies are looking to adopt big data, cloud computing and artificial intelligence (AI), while 86 per cent expect to incorporate digital platforms and apps into their operations in the next five years. E-commerce and digital trade are expected to be adopted by 75 per cent of businesses. The second-ranked technology encompasses education and workforce technologies, with 81 per cent of companies looking to adopt these technologies by 2027. Big data analytics, climate change and environmental management technologies, and encryption and cybersecurity are expected to be the biggest drivers of job growth. Agriculture technologies, digital platforms and apps, e-commerce and digital trade, and AI are all expected to result in significant labour-market disruption. Employers anticipate a structural labour market churn of 23 per cent of jobs in the next five years - emerging jobs added and declining jobs eliminated. A higher-than-average churn is expected in supply chains, transportation, media, entertainment and sports industries, and lower-than-average churn in manufacturing, retail and wholesale trade. Respondents expect structural job growth of 69 million jobs and a decline of 83 million jobs. This corresponds to a net decrease of 14 million jobs, or 2 per cent of current employment. Organisations estimate that 34 per cent of all business-related tasks are currently performed by machines, representing a negligible 1 per cent increase in the level of automation since 2020. Respondents predict that 42 per cent of business tasks will be automated by 2027. Six in 10 workers will require training before 2027, but only half of workers are seen to have access to adequate training opportunities today. Overall, new insights emerge on how labour markets are expected to evolve over the next five years as they get continually shaped by powerful forces. Workplaces are changing rapidly and so are skill requirements. Significant disruption is expected to be experienced from macroeconomic trends and technological progress in the next five years. It is said that technology will limit the jobs of the future to jobs related to technology. Job creation will likely be driven by green transition and localisation of supply chains. Healthcare may turn out to be resilient to the imminent churn as populations age. Clerical and secretarial skills are expected to decline the fastest. Learning and training on the job, and accelerating automation of work processes are likely to be the main drivers of workforce strategies. Employers are looking for people who possess behavioural skills suitable for 2023-27. People with these skills will be better prepared to meet the challenges and opportunities of the next five years. These fundamental shifts have major implications for India as it progressively positions itself on the tableau of global developments to exploit its demographic dividend and macroeconomic advantage to which we now turn. The United Nations estimates that India has become the most populous country in the world in April this year in what has been termed as ‘heralding a major shift in the global order’2, and as ‘1.4 billion opportunities’.3 With more than 40 per cent of the population below the age of 25 - one in 5 in the world4 - 200 million young people will enter the labour force over the next two decades5 on a base when the labour force is already growing more rapidly than the population. How can this be converted into a comparative advantage in securing our developmental aspirations? It has been pointed out that our population presents an exciting opportunity which can be realised only if we are successful in providing it with economic opportunity.6 This can be achieved by skilling up the work force in an institutional environment that enables work flexibility in tune with changing technologies and demand patterns. Raising labour productivity and increasing female participation in the workforce can equip India to harness the fruits of demographic dividend. The World Economic Forum’s report alluded to earlier envisions a labour market churn in India akin to global trends over the next five years – new jobs created over jobs eliminated will constitute 22 per cent of the current labour force. India’s job growth will be driven by 61 per cent of broader applications of ESG standards followed by increased adoption of new technologies (59 per cent), and broadening digital access (55 per cent). India is poised on the crest of a tide in its history.7 It has the opportunity to leverage its human resources to become an economic powerhouse. The most heartening development is the easing of headline inflation below 5 per cent in April 2023, occurring as it has for the first time since November 2021, vindicating the monetary policy decision of April 8, 2023 and the stance. This has come as a welcome relief. Surveys of fast moving consumer goods (FMCG) are finally reporting some improvement in spending, and this is gradually spreading out to rural areas. Private consumption, the mainstay of aggregate demand in India, has been impacted by price pressures since the second half of the year gone by, especially discretionary spending. In turn, this has impacted corporate India’s revenue performance and profitability. In the national accounts that will be released at the end of this month, this will likely have pulled down value added in industry and even some services. In April and the first few days of May 2023 domestic economic conditions have sustained the quickening of momentum seen in the last quarter of 2022-23. Going by lead indicators such as mandi arrivals and cumulative procurement of wheat so far, the rabi harvest may set a new record, which should provide a boost to the rural economy. Moreover, mandi arrivals of paddy in the kharif marketing season (October 2022 to date) have been the highest in eight years. Although mandi prices of paddy are slightly lower than the minimum support price, retail prices are firming up at a time when both global rice prices and India’s exports of rice are looking up. The services sector is on a roll, with big jumps in international and domestic air passenger traffic. India has moved up six places on the World Bank’s Logistics Performance Index (April 2023 release) on account of better infrastructure, international shipments and reduced dwell time in ports. The services PMI scaled a 13-year high in April 2023 on new business growth, and optimism is sustained into the future. With the reading of March 2023 almost flatlining, industrial production slowed considerably in 2022-23, especially manufacturing. Consumer durables remained weak all through the year except the first quarter. Capital goods and infrastructure goods, on the other hand, showed strong growth reflecting the uptick in construction activity. Industrial production had started to pick up from November 2022 and a rising trend was forming; but the March 2023 reading has disappointed, especially with electronic exports having risen by 50 per cent in 2022-23. India is also riding the wave of an electric two- and three-wheeler revolution and the Indian Premier League is taking over world cricket and becoming the world’s second most lucrative sports league.8 Corporate earnings results surprised consensus expectations on the upside in the January-March 2023 quarter. Revenue growth of non-financial companies moderated in a combination of volume and price dynamics, but their profitability improved due to easing cost pressures. In a situation of slowing global demand, information technology (IT) sector companies experienced moderation in earnings growth. Managements of leading IT companies provided cautionary outlooks of a recessionary environment. Companies operating in the metals space also experienced slowing down of their profitability (y-o-y) in consonance with falling prices and hence, slowing realisations. For all other companies, easing input cost pressures translated into higher profitability; however, the effects of falling costs may flow with a lag into income statements, especially of corporates carrying high-cost inventory on their balance sheets. In the FMCG sector, which is a bellwether indicator of consumption demand, several companies have outperformed expectations — profitability growth has swung to the upside, aided by easing of input cost pressures. In the face of price pressures and consequent ebbing of consumer demand, several companies are focusing on moving up the value chain and on higher margin products – commonly referred as ‘premiumisation’. The auto sector continued to register resilient demand, although it reported constraints on exports. The banking and financial sector remained resilient, with another quarter of strong revenue growth aided by strong credit growth. Matched with the RBI’s sectoral deployment of credit data, this indicates that this was mainly contributed by agriculture and allied activities, trade and personal loans segments. Furthermore, the treasury portfolio of the Indian banking sector appears to have been insulated from the monetary policy tightening cycle. In addition, provisioning costs have remained low as asset quality has steadily improved. Set against this backdrop, the remainder of the article is structured into four sections. Section II covers the global economic developments. Section III provides an assessment of domestic macroeconomic conditions. Section IV outlines the financial conditions in India, while Section V concludes. II. Global Setting The global economy continued to demonstrate resilience in April and May 2023 with surveys of sentiments on underlying activity beating expectations in most jurisdictions. Emerging market economies (EMEs) appear to be positioned ahead of their advanced peers in charting a path of the multiple shocks that characterised the years gone by. Risks to global growth in 2023 stem from elevated inflation, tighter financial conditions, and the lingering effects of the conflict in Ukraine. Factoring in these headwinds, our model-based nowcast points to a deceleration in global growth in Q1: 2023 (Chart 1). ![Chart 1: Global GDP Growth Nowcast[adjusted series, (q-o-q)]](https://www.rbi.org.in/scripts/images/01STECO22052023_1.jpg) Among high frequency indicators, the global composite PMI increased to a 16-month high of 54.2 in April 2023 from 53.4 in the previous month with output, new orders and employment registering a broad-based pick-up. While the global manufacturing PMI remained unchanged at 49.6 in April 2023, the global services PMI at 55.4 in April expanded at the quickest pace since November 2021 on the back of new business scaling a 13-month high (Chart 2). The Baltic Dry Index9, a high frequency indicator of world trade volume, remained mostly range-bound in April after a threefold increase during February-March (Chart 3). 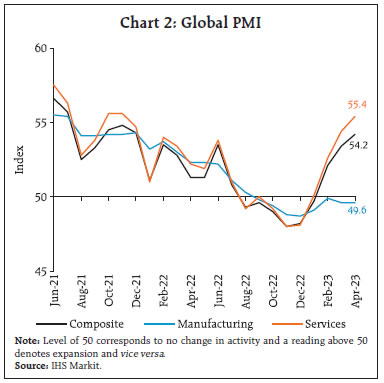 Global commodity prices firmed up in April, led by increase in energy prices, particularly of crude oil and coal, but more recently, they are weighed down by fears of recession in the advanced economies (AEs) [Chart 4a]. Food prices recorded a marginal pick-up in April, led by steep increases in sugar and meat prices, while cereals, dairy and vegetable oil prices continued to drop. Despite a month-on-month (m-o-m) increase of 0.6 per cent, the Food and Agriculture Organization (FAO) Food Price Index remained in a deep deflation [(-) 19.7 per cent, y-o-y] in April 2023 (Chart 4b). 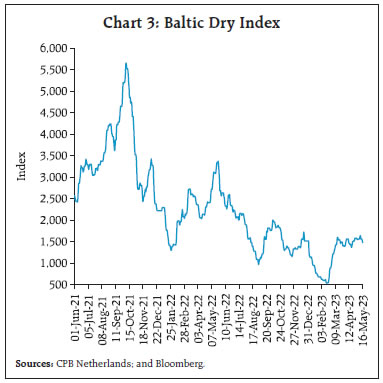 In April, crude oil prices rose to average US$ 84.1 per barrel, driven by the production cut announced by the Organization of the Petroleum Exporting Countries (OPEC)+. These prices, however, retreated subsequently amidst concerns of global recession, with Brent prices falling close to US$ 75 per barrel by early May (Chart 4c). Gold prices rebounded sharply as renewed fears about the stability of banks stoked safe-haven demand (Chart 4d). Inflation continued to edge down grudgingly across most economies. In April, the headline CPI inflation (y-o-y) in the US eased marginally to 4.9 per cent (the lowest since April 2021) from 5.0 per cent in March. Inflation based on the US personal consumption expenditure (PCE) index also eased to 4.2 per cent in March from 5.1 per cent in February (Chart 5a). In the UK, CPI inflation moderated to 10.1 per cent in March from 10.4 per cent in February while Japan’s CPI (all items less fresh food) inflation remained steady at 3.1 per cent in March. In the Euro area, inflation edged up marginally to 7.0 per cent in April 2023 from a 13-month low of 6.9 per cent in March. Among the EMEs, Russia’s inflation eased further to 2.3 per cent in April from 3.5 per cent in March, driven down by a favourable base effect. Inflation eased further in Brazil (4.2 per cent), and China (0.1 per cent) in April while it edged up marginally in South Africa to 7.1 per cent in March (Chart 5b). Despite the sequential moderation in headline inflation, core inflation persists at high levels, lifted by strong service price increases and wage pressures, especially in the AEs (chart 5c and 5d).
Global financial markets staged a recovery from late March as fears of contagion from the recent banking turmoil in the US and Europe receded (Chart 6a). Markets, however, remained rangebound in April - early May as the focus turned to the pace and magnitude of future rate hikes. The ensuing low volatility can also be attributed to the dominance of option sellers causing intraday reversions that keeps market prices unchanged for several days. After touching the five per cent mark on March 07, 2023 the US two-year treasury yield declined in April, tracking indications of slowdown in the labour market. The two-year treasury yield softened further on cues from the May 3, 2023 Federal Open Market Committee (FOMC) meeting about a potential pause in rate action. However, it later edged up due to debt ceiling concerns (Chart 6b). The US dollar shed 0.8 per cent in April as weaker-than-anticipated jobs data, concerns over the debt ceiling and banking sector risks piled on fears of a likely recession in the US, however, the losses were recouped in the first half of May. The Morgan Stanley Capital International (MSCI) currency index for the EMEs also moderated by 0.3 per cent as capital flows remained volatile (Chart 6c and 6d). Central banks in the AEs and EMEs have either reduced the magnitude of hikes or paused in their rate hike cycles (Chart 7a and 7b). The US FOMC increased its policy rate by 25 basis points on May 3, 2023 and indicated that further actions“-- will take into account the cumulative tightening of monetary policy, the lags with which monetary policy affects economic activity and inflation, and economic and financial developments”. The Bank of England and the Reserve Bank of Australia also raised their policy rates by 25 bps each in May. In its April meeting, the Sveriges Riksbank increased its key rates by 50 basis points while the ECB raised the three key rates by 25 bps in May. 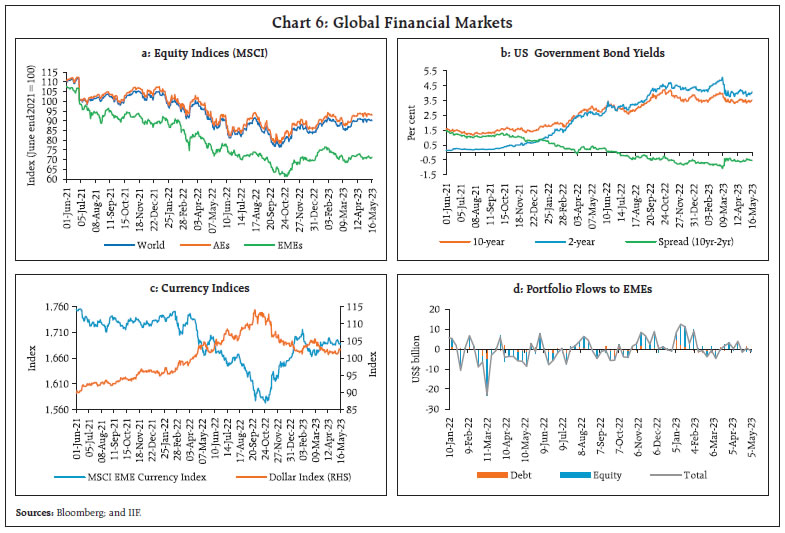
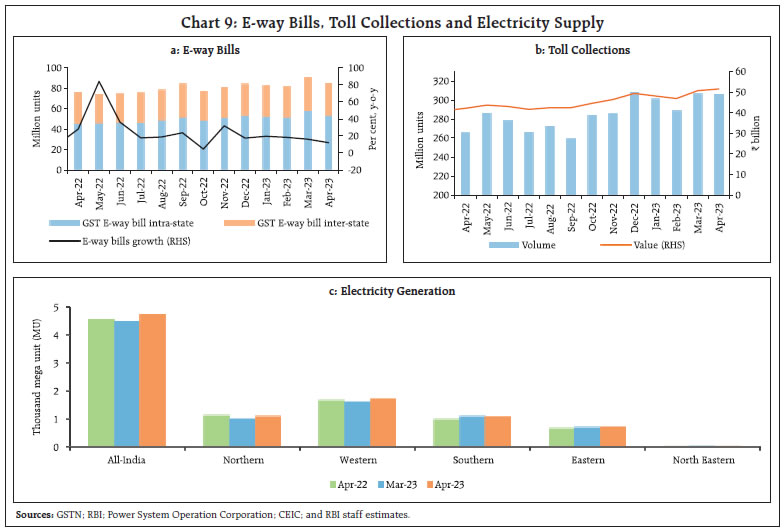
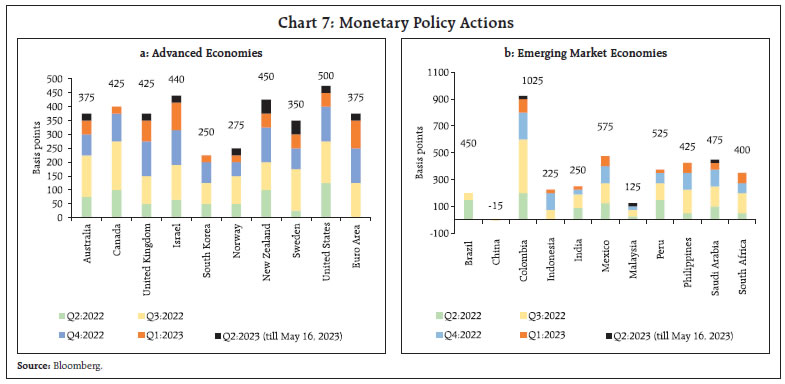 Most EME central banks have also pivoted to relatively less aggressive monetary policy actions (Chart 7b). In April and May 2023, the Central Bank of Argentina raised its policy rates by 1900 bps in three steps of 300 bps, 1000 bps and 600 bps, while the Central Bank of Colombia implemented a 25 bps increase. In May 2023, the Bank Negara Malaysia also raised its policy rate by 25 basis points for the first time in 2023. III. Domestic Developments The Indian economy has sustained the momentum in 2023-24 so far. The index of supply chain pressure for India (ISPI) continued to remain at levels below historical average since July 2022 (Chart 8a). Overall economic activity, as captured by our economic activity index (EAI), remains resilient (Chart 8b). Based on partial data available for April 2023 and assuming an implied GDP growth of 5.1 per cent for Q4:2022-23, the economic activity index nowcasts GDP growth for Q1:2023-24 at 7.6 per cent (Chart 8c). Aggregate Demand Among lead indicators of demand conditions, E-way bill volumes at 84.4 million in April 2023 clocked their second highest level after the March 2023 peak (Chart 9a). Toll collections reached a record of ₹52 billion in April 2023, aided by an expansion of toll plazas under the FASTag programme (Chart 9b). Electricity generation also accelerated in April due to rising temperature (Chart 9c). Automobile sales recorded a robust expansion of 16.1 per cent y-o-y in April 2023 indicating a smooth shift to BS VI Phase 2 emission norms (Chart 10a). Electric vehicles sales crossed the 1 lakh mark for the seventh consecutive month in April 2023. Annual growth in the sales of two-wheeler and three-wheeler accelerated in April 2023, with three-wheelers sales more than doubling over last year and reaching closer to the pre-pandemic levels (April 2019). Tractor sales, on the other hand, declined in April 2023 as high demand generating festivals of Navaratri and Gudi Padwa got preponed to March (Chart 10b). 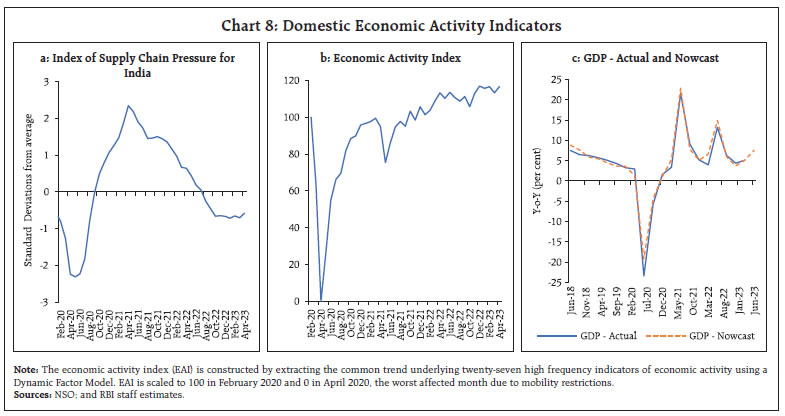
 Vehicle registrations moderated in April 2023 as the implementation of the second phase of BS VI norms led to higher prices for the retail consumers (Chart 10c). The daily average consumption of petroleum products fell 7.2 per cent m-o-m in April 2023, from a record-high registered in the previous month due to adverse weather conditions that affected the consumption of gasoline, asphalt and minor petroleum products (Chart 10d). In the tourism sector, the hotel occupancy rate was at 63 per cent in March 2023 compared to the post-pandemic record high of 71 per cent in February (Chart 11a). Despite a sequential fall, the average room rate (ARR) grew 40 per cent (y-o-y) in March, leading to a growth in revenue per available room (RevPAR) by 44 per cent y-o-y (Chart 11b). As per the data available from the Centre for Monitoring Indian Economy (CMIE), the all-India unemployment rate was at 8.1 per cent in April 2023, with a higher rate of unemployment being observed in urban areas (Chart 12a). There was also a 2.2 percentage point sequential rise in the labour force participation rate (LFPR) to 42.0 per cent (highest since February 2020) [Chart 12b]. The significant addition of workers to the labour force reflects increasing confidence in employment opportunities. The employment outlook in the organised sector, as polled by the purchasing managers in manufacturing and services, also looked up in April (Chart 13).
The demand for work under the Mahatma Gandhi National Rural Employment Guarantee Scheme (MGNREGS) increased both sequentially and on a y-o-y basis (Chart 14). This pick-up could be attributed to factors such as the lower demand for labour for farm sowing in the summer and the recent wage revision by the Government under MGNREGS.10 India’s merchandise exports declined by 12.7 per cent y-o-y in April 2023 to a six-month low of US$ 34.7 billion, marking the third consecutive monthly contraction. On a sequential basis, exports fell by 16.2 per cent over March (Chart 15).
Among the 30 major commodities, 19 commodities accounting for 73.7 per cent in the export basket recorded a y-o-y contraction in April. The drag on exports from petroleum products, gems and jewellery, engineering goods, organic and inorganic chemicals, and readymade garment (RMG) of all textiles, was partly offset by growth in electronic goods, drugs and pharmaceuticals, rice, and oil meals (Chart 16). Non-oil exports contracted for the fifth consecutive month. During 2022-23, the year gone by for which a clearer picture now emerges, merchandise exports grew by 6.7 per cent, driven by petroleum products, while non-oil exports declined (Chart 17a). Exports of petroleum products were buoyed by the price effect, resulting in a growth of 44.4 per cent in value terms despite a 0.4 per cent fall in volume terms (Chart 17b). Merchandise imports fell to a twenty-month low of US$ 49.9 billion in April 2023, recording a sequential contraction of 16.9 per cent and a y-o-y decline of 14.1 per cent on account of easing commodity prices and a fall in demand for discretionary items such as gems and jewellery (Chart 18). At a disaggregated level, 23 major items accounting for 82.1 per cent of the import basket in April 2023, registered contraction. Petroleum, oil and lubricants (POL), coal and chemicals dragged down overall imports whereas machinery, iron and steel and pulses contributed positively (Chart 19a). Merchandise imports also reached an all-time high of US$ 714.2 billion in 2022-23, increasing by 16.5 per cent y-o-y. 24 items out of the 30 major imported commodities, accounting for 84.9 per cent of import basket registered an expansion in 2022-23. India’s merchandise trade deficit touched a twenty-month low of US$ 15.2 billion in April 2023. During 2022-23, the merchandise trade deficit had widened by US$ 72.6 billion as compared to the level in 2021-22, with Russia and Indonesia jointly accounting for over a fifth of the build-up in the trade deficit (Chart 19b).
The goods and services tax (GST) collections (Centre plus States) in April 2023 stood at ₹1.87 lakh crore (highest monthly collection since the launch of GST in July 2017) and recorded a growth rate of 11.6 per cent y-o-y. This could be attributed to the higher year-end economic activity as the April data cover transactions that took place in March (Chart 20). As per the accounts data for April-February of 2022-23, States’ gross fiscal deficit (GFD), as a proportion to the full year budget estimates (BE), was lower than a year ago (Chart 21a and 21b). The increase in revenue collection by 14.1 per cent was broad-based. On the expenditure front, growth in revenue and capital expenditure (capex) moderated (Chart 22). During April-February 2023, States incurred 61 per cent of their budgeted capex, with a tendency to back-load this component of expenditure to end of the financial year in March 2023. The consolidated states’ GFD to gross state domestic product (GSDP) ratio budgeted at 3.2 per cent for 2023-24 (as per data for 26 States) is within the target of 3.5 per cent set by the Centre.11 The lower GFD-GSDP ratio is due to moderation in revenue expenditure, even as capex is expected to increase.
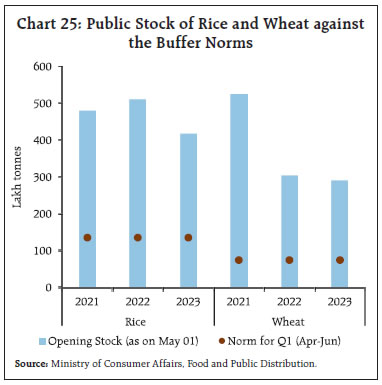
Aggregate Supply As per the long-range forecast by India Meteorological Department (IMD) released on April 11, 2023, the Southwest Monsoon (SWM) rainfall during June-September 2023 is likely to be normal at 96 per cent of the long period average (LPA) with a model error of ±5 per cent.12 However, the forecast indicates wide geographical variation with some of the major agriculture producing regions likely to fall in below normal monsoon category (Chart 23a). The Southern Oscillation neutral condition in the equatorial pacific region is expected to turn into an El Niño condition during the monsoon season, which generally affects the rainfall adversely. However, the visible impact of El Niño is expected to be seen only post-June 2023 and hence, the initial phase of the monsoon is expected to be normal. As per IMD’s forecast released on May 16 2023, the onset of SWM over Kerala is likely to be slightly delayed and is now expected on June 4, 2023.13 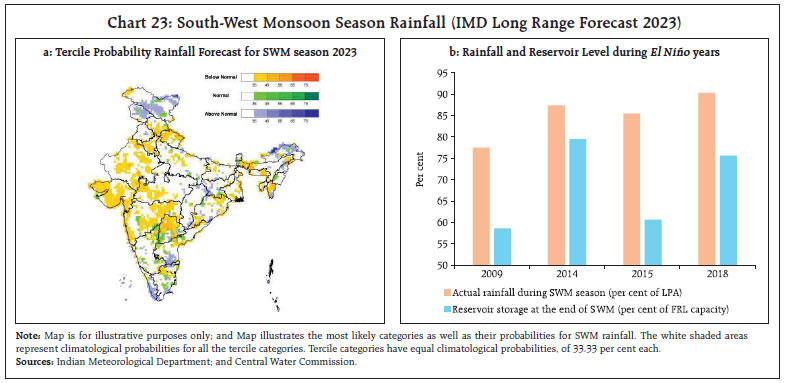 Historically, rainfall at the end of the SWM season has been below normal in the last four El Niño years. This might also impact the reservoir levels across the country, which is critical for irrigation of rabi crops during winter (Chart 23b). Nevertheless, the positive Indian Ocean Dipole (IOD) conditions are expected to counter the impact of El Niño in the later phase of the monsoon in 2023. As on May 16, 2023 the public procurement of rice during the kharif marketing season (KMS) 2022-23 (Oct-Sep) was lower by 1.8 per cent y-o-y. As on May 16, 2023, the procurement of wheat during the rabi marketing season (RMS) 2023-24 (Apr-Mar) so far, at 260.1 lakh tonnes, has surpassed the total procurement of last year by 38.4 per cent (Chart 24). Public stocks of rice and wheat with the Food Corporation of India (FCI) and other government agencies as on May 1, 2023 were 3.1 and 3.9 times the buffer norms, respectively (Chart 25). The procurement target for rice during the KMS 2022-23 is set at 51.8 million tonnes and for wheat, it is at 34.15 million tonnes during RMS 2023-24. 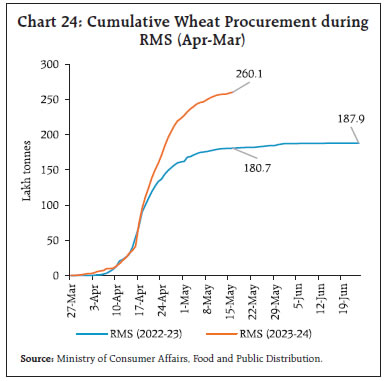
 Market arrivals of wheat, which were affected in March by the delay in harvesting of rabi crops caused by unusually higher rains and hailstorms, picked up in April. As a result, wheat mandi prices continued to moderate (m-o-m) in April. Price pressures, however, persisted in respect of paddy, partly reflecting higher export demand. Summer season rainfall (March – May) as on May 16, 2023 was higher than the normal rainfall, which augurs well for zaid (summer) crops and overall reservoir levels throughout the country. As on May 11, 2023, water storage in 146 reservoirs monitored by the Central Water Commission (CWC) stood at 34 per cent of the full reservoir capacity – marginally lower than last year’s level, but 22.5 per cent higher than the 10-year average. Storage in 92 out of 146 major reservoirs was higher than the decadal average (Chart 26). The index of industrial production (IIP) grew by 5.1 per cent in 2022-23, led by a robust expansion in the production of electricity followed by mining and manufacturing. As per the use-based classification, the expansion was led by capital goods, infrastructure goods and primary goods while the growth in consumer durables and non-durables remained subdued at 0.5 per cent each. The index value of all use-based categories except consumer durables surpassed pre-pandemic (2019-20) levels in 2022-23 (Chart 27).
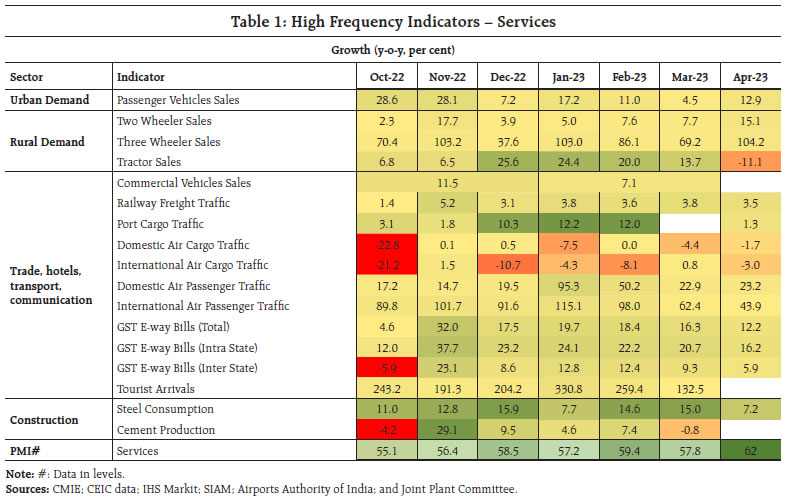
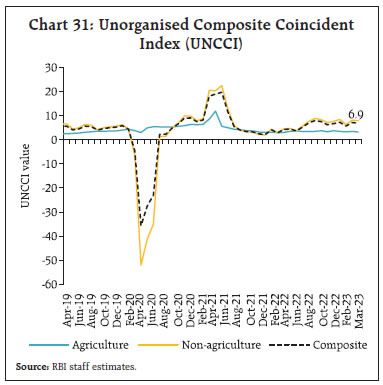
The headline PMI for manufacturing reached a four-month high of 57.2 in April 2023, with a broad-based expansion in all sub-indices (Chart 28a). Output in the service sector expanded at the fastest rate in nearly 13 years at 62.0 in April 2023 (highest since July 2010), led by a pick-up in new business growth and favourable market conditions (Chart 28b). In the services sector, transport indicators moderated in April. Growth in cargo traffic at major ports decelerated to 1.3 per cent due to contraction in iron ore, raw fertilisers and POL cargos (Chart 29a). Annual growth in railway freight earnings decelerated driven by a decline in food grains carriage (Chart 29b). Among construction sector activity indicators, steel consumption growth decelerated to 7.2 per cent in April (y-o-y) while cement production witnessed a marginal contraction in March (Chart 30). High-frequency indicators in the service sector for April 2023 point to economic activity keeping pace. Automobile sales also recorded robust growth with acceleration in both two and three wheelers’ sales. Domestic and international air passenger traffic continued to post double digit growth (Table 1). Nearly half of the measured economic activity in India takes place in the unorganised or informal sector appropriate measurement of which remains a major challenge.14 A monthly composite index for the unorganised sector activity (UNCCI)15, which tracks economic activity in this sector, points towards an improvement in unorganised non-agricultural activity during Q4:2022-23 (Chart 31). 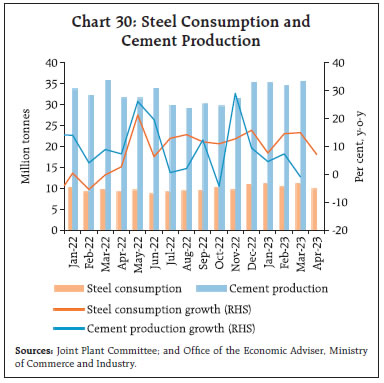
 In terms of regional policy initiatives, Haryana launched the ‘Haryana Kaushal Rozgar Nigam Limited’ (HKRNL) Enterprises Portal that will provide an online platform for the industries in the state for recruitment. Punjab took the initiative to earmark 10 per cent amount of compensation meant for crop loss due to any sort of natural calamity for the benefit of farm labourers. To ensure ease of doing business and remove compliance burden for manufacturing and trade establishments, Delhi approved 70 reforms aimed at digitisation and expediting approvals for various government related services. Tamil Nadu will start geo-tagging handlooms and power-looms to help devise policies and schemes that will aid genuine weavers, besides helping them avail of government schemes to upgrade looms to produce value-added fabric. Inflation Headline inflation, measured by y-o-y changes in the all-India consumer price index (CPI), moderated sharply to 4.7 per cent in April 2023 from 5.7 per cent in March.16 The decline in inflation was broad-based across food, fuel and core (excluding food and fuel) groups, which was also reflected in their falling contribution to overall inflation (Chart 32a and Chart 32b). The fall in headline inflation was on account of the combined impact of monetary policy tightening, supply augmenting measures and a favourable base effect. 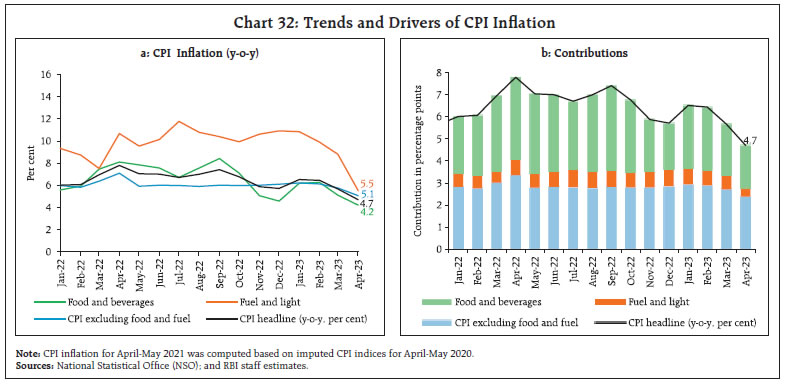 CPI food inflation (y-o-y) moderated sharply to 4.2 per cent in April 2023 from 5.1 per cent in March on account of a large favourable base effect of around 145 bps, which was more than offset by a positive price momentum of around 55 bps. Within this group, inflation moderated sharply in fruits, cereals, milk, eggs, spices, non-alcoholic beverages and prepared meals. While edible oils saw a sharper deflation than a month ago, prices of vegetables, meat and fish registered a lower rate of deflation in April vis-à-vis March. On the other hand, inflation in prices of pulses and sugar edged up (Chart 33). Inflation in the fuel and light group declined to 5.5 per cent in April from 8.8 per cent in March, mainly on account of deflation in kerosene prices (PDS and other sources). Core inflation softened to 5.1 per cent in April from 5.8 per cent in March with a large favourable base effect of around 120 bps more than offsetting a positive price momentum of around 55 bps. This is the sharpest monthly fall in core inflation since May 2022. The moderation was broad-based, with inflation in six out of nine sub-groups (recreation and amusement; clothing and footwear; housing; household goods and services; health; and transport and communication) decelerating. Inflation in pan, tobacco and intoxicants, education, and personal care and effects, on the other hand, registered an increase (Chart 34). In terms of regional distribution, rural inflation at 4.68 per cent was marginally lower than urban inflation (4.85 per cent) in April 2023. Majority of the states registered inflation in the range of 4-6 per cent, with only Tripura experiencing inflation in excess of 8 per cent (Chart 35).
High frequency food price data for May (May 1-12) point to an increase in cereal prices, mainly due to rice (chart 36a). While pulses prices, especially tur dal, registered an uptick, edible oil prices declined (Chart 36b and 36c). Among key vegetables, prices of onions and tomatoes registered softening while potato prices increased (Chart 36d). During May so far, while retail selling prices of petrol and diesel and LPG prices remained steady in the four major metros, kerosene prices continued to decline (Table 2). Input costs inflation measured by wholesale price index (WPI) for industrial inputs and farm inputs moderated further in April 2023 (Chart 37). The decline in industrial inputs costs primarily reflected moderation in prices of non-food articles, high speed diesel (HSD) and electricity while farm inputs cost largely moderated on the back of fall in prices of fertilisers, HSD and electricity. The PMI for April 2023 indicated a sequential pick-up in input costs across manufacturing and services sectors. Selling prices also edged up, especially, for services (Chart 38a and 38b). The wedge between input and output prices rose by 0.7 and 1.3 percentage points, respectively, for manufacturing and services. | Table 2: Petroleum Products Prices | | Item | Unit | Domestic Prices | Month-over-month
(per cent) | | May-22 | Apr-23 | May-23^ | Apr-23 | May-23^ | | Petrol | ₹/litre | 110.14 | 102.92 | 102.92 | 0.0 | 0.0 | | Diesel | ₹/litre | 98.27 | 92.72 | 92.72 | 0.0 | 0.0 | | Kerosene (subsidised) | ₹/litre | 58.81 | 49.20 | 47.55 | -9.2 | -3.3 | | LPG (non-subsidised) | ₹/cylinder | 1001.76 | 1113.25 | 1113.25 | 0.0 | 0.0 | ^: For the period May 1-12, 2023.
Note: Other than kerosene, prices represent the average Indian Oil Corporation Limited (IOCL) prices in four major metros (Delhi, Kolkata, Mumbai and Chennai). For kerosene, prices denote the average of the subsidised prices in Kolkata, Mumbai and Chennai.
Sources: IOCL; Petroleum Planning and Analysis Cell (PPAC); and RBI staff estimates. |
IV. Financial Conditions After easing considerably in the first half of April 2023, liquidity conditions tightened during the second half due to a build-up of government cash balances. Subsequently, barring transient easing on month-end spending by the Government, liquidity conditions mostly remained tight during the first half of May 2023. Accordingly, the average total absorption under the liquidity adjustment facility (LAF) declined to ₹1.3 lakh crore during April 16 to May 15, 2023 from ₹2.0 lakh crore during March 16 to April 15, 2023. Placement of funds under the standing deposit facility (SDF) reduced to ₹0.95 lakh crore from ₹1.6 lakh crore during March 16 to April 15, 2023. Reflecting these developments, there was a muted response from banks to the fortnightly variable rate reverse repo (VRRR) auction conducted on April 21 and May 4 with offers of ₹20,480 crore and ₹8,447 crore, respectively, against the notified amount of ₹50,000 crore. Recourse to the marginal standing facility (MSF) was also higher in the second half of April through May 15 (average of ₹0.22 lakh crore) than during March 16 through April 15, 2023 (₹0.11 lakh crore). Overall, the net absorption under the LAF amounted to ₹0.92 lakh crore during this period, similar to ₹0.93 lakh crore during mid-March through April 15, 2023 (Chart 39). The weighted average call rate (WACR) gradually firmed up towards the upper bound of the LAF corridor in the second half of April. In sync, other overnight money market rates also hardened. On an average basis, the WACR, the triparty repo and market repo rates traded 17 bps, 19 bps and 18 bps, respectively, above the policy repo rate during April 16 to May 15, 2023 (Chart 40a). Yields on 3-month treasury bills (T-bill), certificates of deposit (CDs) and commercial paper (CPs) for non-banking financial companies (NBFCs) largely traded above the MSF rate during April 16 to May 3, 2023 (Chart 40b). In the primary market, fund mobilisation through CDs issuances at ₹0.27 lakh crore during 2023-24 (up to May 05) was marginally lower than ₹0.33 lakh crore at this time in the previous year. On the other hand, CP issuances at ₹1.5 lakh crore during 2023-24 (up to May 15) was unchanged as compared with the corresponding period a year ago. Bond markets extended gains, reflecting strong demand for government securities on expectation of a likely shift of stance after the Monetary Policy Committee’s (MPC) largely unanticipated move to pause on the policy repo rate. The decline in the US treasury yields also supported market sentiments (Chart 41).
The yield on the 10-year benchmark G-sec (7.26% GS 2033) softened sharply from 7.22 per cent on April 14 to 7.00 per cent on May 3, 2023, its lowest level since September 2022. Subsequently, yields traded in a narrow range with the 10-year G-sec closing at 6.99 per cent on May 15, 2023. The yield differential across various maturities narrowed towards early May 2023 (Box 1).
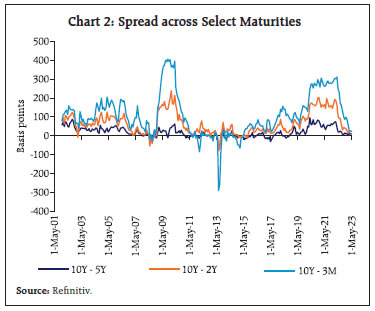
Box 1: Yield Convergence in the Government Securities Market: Signal or Noise? On May 12, 2023 yields on government securities (g-secs) ranging from 91-day treasury bills (t-bills) to the benchmark 10-year maturity security converged to a narrow range of 5 basis points17 (bps) (Chart 1). As a result, term spreads in the g-secs market, which had been widening since the second half of 2019 and sharply so during the initial stages of the pandemic before they started to ease from the beginning of 2022, have compressed to multi-year lows. Illustratively, the yield spread between the 91-day t-bill and the 10-year security has shrunk from around 300 bps at end-2021 to around 5 bps; between 2-year and 10-year g-secs from around 200 bps to around 12 bps; and between 5-year and 10-year g-secs from around 65 bps to under 6 bps [Chart 2]. This phenomenon occurs at a multi-year frequency as, for instance, during the euro debt crisis; the taper tantrum; and in the latter half of 2008 amidst the global financial crisis. Referred to as a ‘bear flattening’18 of the yield curve, this is associated with the transitioning between yield curve regimes that typically occurs in consonance with policy rate cycles (Chart 3). 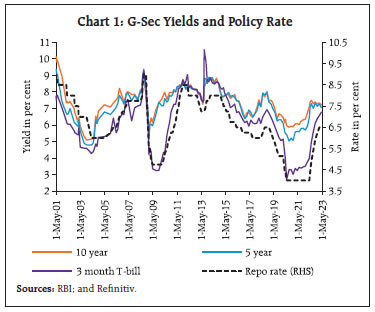
 The recent convergence reflects the confluence of policy actions by the Reserve Bank of India (RBI), spillovers from global monetary policy developments, elevated crude oil prices and safe haven flights. Domestic drivers include strong demand from long-term investors, mainly insurance companies, pension funds and provident funds. From March 2023, additional drivers of yield convergence are the forceful resolution of banking distress in some jurisdictions, the moderation or pause in monetary policy actions and the return of risk off sentiments. Short-term yields have been pushed up by sporadic tightening of domestic liquidity conditions due to skewed distribution of liquidity among market participants on account of asymmetric deposit mobilisation and differential liquidity and risk management practices followed by banks, increase in currency demand related to rabi harvest operations, moderation in government spending and tax outflows.  From a policy perspective, the key issue is: is this an idiosyncratic development, or is it signalling market expectations regarding the macroeconomic and financial outlook? At this stage, only conjectural prognosis can be attempted, given the paucity of data points defining actual outcomes. First, the flattening of the yield curve read in conjunction with survey-based evidence19 suggests that inflation expectations are getting re-anchored after suffering multiple and overlapping shocks during 2022. Second, it reflects consensus expectations of slower growth in 2023-24 relative to a year ago – the RBI expects real GDP growth to moderate from 7.0 per cent in 2022-23 to 6.5 per cent in 2023-24, with risks evenly balanced around this baseline projection. Third, it may be indicating that financial conditions in debt markets – for which the g-secs yield curve is a benchmark – are neutral and, therefore, not a constraint for businesses looking to raise long-term resources. This sounds like a positive for the prospects of private capex decisions, which can catalyse a ‘bull steepening’20 of the yield curve signalling that inflation is vanquished and India is positioned on a growth trajectory that is consistent with its aspirations. | Taking cues from G-sec yields, corporate bond yields softened during the second half of April 2023 while the average risk premia in the bond market (5-year AAA minus 5 year G-sec) was largely unchanged during the same period (Table 3). Reserve money (RM) excluding the first-round impact of change in the cash reserve ratio (CRR) grew by 7.7 per cent on a y-o-y basis as on May 12, 2023 (9.1 per cent a year ago) [Chart 42]. Currency in circulation (CiC), the largest component of RM, grew by 7.6 per cent (y-o-y), down from 9.6 per cent a year ago, partly reflecting the faster adoption of digital modes of payment. During 2023-24 so far (up to May 12, 2023), the expansion in RM was driven mainly by net foreign assets (NFA), contributing to around 100.7 per cent which, in turn, tracked variations in the Reserve Bank’s operations in foreign exchange markets (Chart 43). | Table 3: Financial Markets - Rates and Spread | | Instrument | Interest Rates
(per cent) | Spread (basis points)
(Over Corresponding Risk- free Rate) | | Mar 16, 2023 – Apr 13, 2023 | Apr 17, 2023 – May 15, 2023 | Variation
(in bps) | Mar 16, 2023 – Apr 13, 2023 | Apr 17, 2023 – May 15, 2023 | Variation
(in bps) | | 1 | 2 | 3 | (4 = 3-2) | 5 | 6 | (7 = 6-5) | | Corporate Bonds | | (i) AAA (1-year) | 7.97 | 7.71 | -26 | 68 | 60 | -8 | | (ii) AAA (3-year) | 7.98 | 7.81 | -16 | 74 | 73 | 0 | | (iii) AAA (5-year) | 7.97 | 7.73 | -22 | 68 | 61 | -7 | | (iv) AA (3-year) | 8.67 | 8.51 | -15 | 143 | 143 | 1 | | (v) BBB-(3-year) | 12.32 | 12.16 | -15 | 508 | 508 | 1 | | Note: Yields and spreads are computed as monthly averages. |
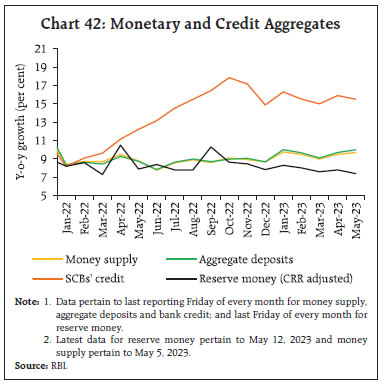 Money supply (M3) grew at 9.7 per cent as on May 5, 2023 the same as a year ago, primarily driven by its largest component – aggregate deposits with banks. Scheduled commercial banks’ (SCBs) credit growth remained strong at 15.5 per cent as on May 5, 2023, albeit down from the peak of 17.8 per cent recorded in October 2022 due to an unfavourable base effect and moderation in credit growth to the industrial sector. Furthermore, the 3-year seasonally adjusted annualised growth21 for SCBs’ deposits and credit, which showed diverging trends during the pandemic, moved in sync with each other since October 2022 reflecting growing traction in credit demand conditions in the post-pandemic period (Chart 44). The incremental credit-deposit (C-D) ratio, which had surged to 142.2 per cent in November 2022, moderated to 112.6 as on April 21, 2023. 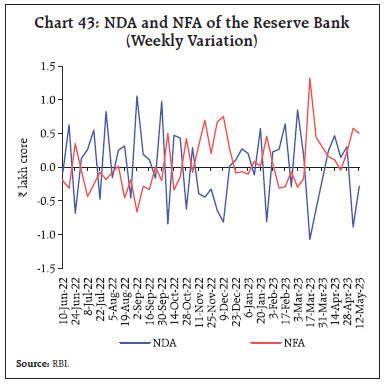 In response to the repo rate hike of 250 bps since May 2022, banks have revised their repo-linked benchmark rates upwards by the same magnitude. Also, the weighted average domestic term deposit rate (WADTDR) on fresh deposits and outstanding deposits rose by 245 bps and 113 bps, respectively, during May 2022 to March 2023 (Table 4). During May 2022 to April 2023, SCBs increased their median 1-year marginal cost of funds-based lending rate (MCLRs) by 145 bps. Consequently, the weighted average lending rate (WALR) on fresh rupee loans and outstanding loans rose by 181 bps and 100 bps, respectively, during May 2022 to March 2023. 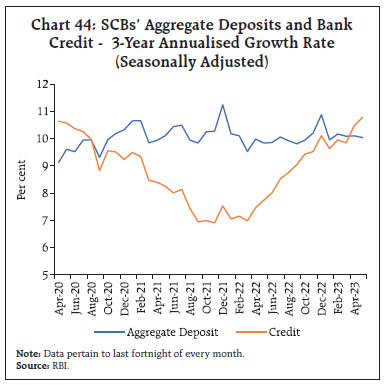
| Table 4: Transmission to Banks’ Deposit and Lending Rates | | (Variation in basis points) | | Period | Repo Rate
(bps) | Term Deposit Rates | Lending Rates | | WADTDR | EBLR | 1-Yr. MCLR
(Median) | Fresh Rupee Loans | Outstanding Rupee Loans | | Retail Deposits | Retail and Bulk Deposits | | -1 | -2 | -4 | -5 | -6 | -7 | -8 | -9 | | Easing Phase Feb 2019 to Mar 2022 | -250 | -259 | -188 | - | -155 | -232 | -150 | | Tightening Period May 2022 to Mar 2023 | 250 | 245 | 113 | 250 | 140 | 181 | 100 | | May 2022 to Apr 2023 | 250 | - | - | 250 | 145 | - | - | Note: 31 domestic banks have increased their EBLRs by 250 bps as at end-April 2023.
WALR: Weighted Average Lending Rate. WADTDR: Weighted Average Domestic Term Deposit Rate; MCLR: Marginal Cost of Funds-based Lending Rate; EBLR: External Benchmark based Lending Rate.
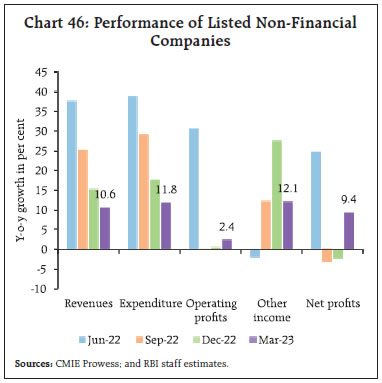
Source: RBI. | During May 2022 to March 2023, transmission across bank groups indicates that the increase in the WADTDR on fresh rupee deposits and WALR on fresh rupee loans were higher in the case of public sector banks, while the WADTDR on outstanding deposits and WALR on outstanding loans were higher for private banks (Chart 45). Corporate performance during Q4:2022-23 based on the available results22 indicate that even though aggregate sales growth exhibited moderation, companies have expanded their operating profits as the expenditure growth also slowed down (Chart 46). Other income, which measures income from non-core business activities such as treasury management also grew during the quarter. Overall, net profit growth returned to the positive territory after two consecutive quarters of contraction. 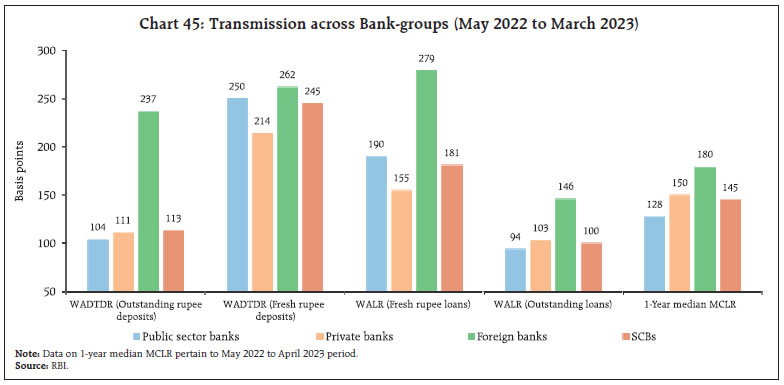
 Banking and other financial sector companies registered an acceleration in their revenue growth in Q4:2022-23, but their profitability growth moderated owing to rise in expenditure23 (Chart 47).24 Other income which inter alia captures gain/loss arising on account of change in valuations of securities, fees and commissions, also registered healthy growth. In addition to rising cost of funds, employee costs also increased sharply, as several companies focussed on their expansion plans. Provisioning related expenditure grew marginally. Net profit growth remained in the positive zone, although it moderated from the preceding quarters.  Domestic equity markets remained buoyant in April and early May following the release of better-than-expected corporate earnings results for Q4:2022-23 (Chart 48). Strong domestic manufacturing purchasing managers’ indices (PMI) and goods and services tax (GST) collections data for the month of April 2023 reaffirmed positive sentiment. Furthermore, the US Fed’s hint of a potential pause in the rate hike cycle and moderation in US CPI inflation resulted in increased risk appetite. Overall, the BSE Sensex increased by 4.6 per cent during 2023-24 so far to close at 61,730 on May 19, 2023, outperforming most of the global peers. 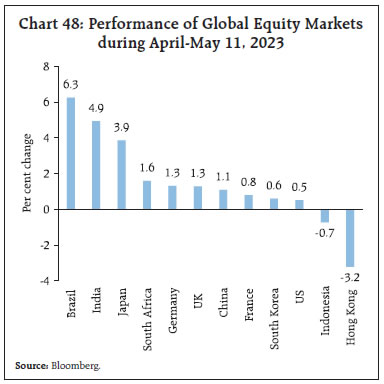
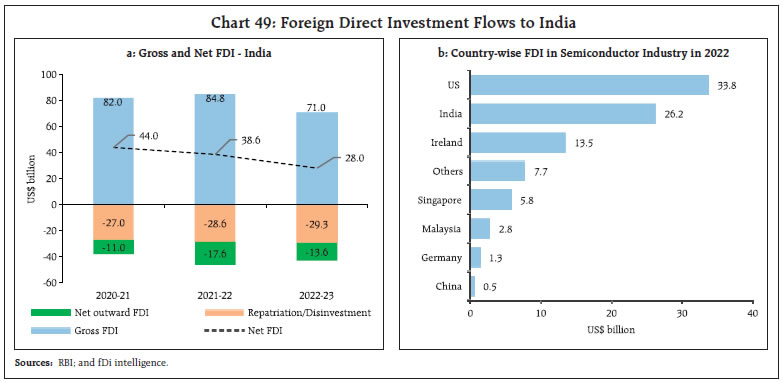 Gross inward foreign direct investment (FDI) flows stood at US$ 71.0 billion in 2022-23, registering a decline of 16.3 per cent on a y-o-y basis (Chart 49a). Net FDI declined to US$ 28.0 billion in 2022-23 as compared with US$ 38.6 billion a year ago, mainly due to moderation in gross FDI inflows and an increase in repatriation. Manufacturing, computer services and communication services recorded the highest decline in FDI inflows compared with the preceding year. The major contributors towards the fall in inflows during the same period were the US, Switzerland, and Mauritius. As reported by fDi Intelligence, India was the second largest recipient of FDI (US$ 26.2 billion) in the semiconductor industry for the year 2022, second only to the US (US$ 33.8 billion) [Chart 49b]. Massive investments in capital-intensive chip FDI projects are underway, in line with the Government of India’s efforts to develop the industry. Foreign portfolio investors (FPIs) turned net purchasers in domestic financial markets in April (Chart 50), primarily in the equity segment (US$ 1.9 billion), which was supplemented by an inflow in the debt segment (US$ 0.2 billion). Financial services, capital goods, and oil, gas and consumable fuels saw the highest net portfolio investment during April 16-30, 2023. In May (up to 15th), net purchases of FPIs were to the tune of US$ 2.2 billion. External commercial borrowing (ECB) registrations that had picked up gradually during the first three quarters of 2022-23, moderated in Q4. Amidst rising global interest rates and greater uptick in domestic credit growth, ECB registrations fell by one-third to US$ 26.6 billion during 2022-23. ECB inflows at US$ 23.8 billion during 2022-23 were marginally higher than outflows, recording a modest net inflow (Chart 51). Other than an increase in on-lending/sub-lending that displaced refinancing, ECBs raised during 2022-23 were clearly intended for financing modernisation, new and infra projects, import of capital goods and for local sourcing of capital goods (Chart 52). With tightening global financial conditions and concomitant rise in international reference benchmark rates, the overall cost of ECB loans went up steeply by 516 bps between March 2022 and March 2023. Notwithstanding the temporary policy increase in all-in-cost limits between July 6 and December 31, 2022, the weighted average interest margin (WAIM) remained range bound (Chart 53). Around 72 per cent of ECB agreement amounts were explicitly hedged or were rupee denominated loans and loans from foreign parents (Chart 54).
Net accretions to non-resident deposits increased to US$ 8.0 billion in 2022-23 from US$ 3.2 billion a year ago, led by net inflows to Non-Resident Ordinary (NRO), Foreign Currency Non-Resident [FCNR(B)] accounts and Non-Resident (External) Rupee Accounts [NR(E)A]. Foreign exchange reserves increased by US$ 75.0 billion since October 21, 2022 and stood at US$ 599.5 billion on May 12, 2023, sufficient to cover 10.0 months of projected imports for 2022-23 and 97.8 per cent of total external debt (chart 55a). Since the onset of COVID-19, India’s foreign exchange reserves have increased by US$ 100.6 billion (end March 2023 over end-March 2020). This is the second highest increase among the top ten countries ranked by foreign exchange reserve holdings (Chart 55b).
The Indian rupee (INR) appreciated by 0.3 per cent (m-o-m) vis-à-vis the US dollar in April 2023 and remained one of the least volatile among major currencies (Chart 56). The INR depreciated by 1.8 per cent (m-o-m) in terms of the 40-currency real effective exchange rate (REER) in April 2023 (Chart 57). Payment Systems Following the robust expansion in March 2023 due to the annual closing of accounts, digital payments have maintained steady growth across various modes in April (Table 4). The Unified Payments Interface (UPI) has emerged as the second most favoured method for the repayment of digital loans, closely trailing the National Automated Clearing House (NACH).25 Allowing the use of the UPI platform for facilitating payments financed by bank credit is further expected to bolster digital uptake, while simultaneously paving the way for more innovative and inclusive credit disbursals.26 Additionally, credit card spending recorded a sharp rise, reaching an all-time high of ₹1.37 lakh crore in March 2023 and indicating an overall growth of 47 per cent (y-o-y) in 2022-23. Provisional data show credit cards maintaining a high growth (y-o-y) profile in April (32 per cent). The adoption of e-commerce and point-of-sale transactions have been driving forces in this surge in spending. 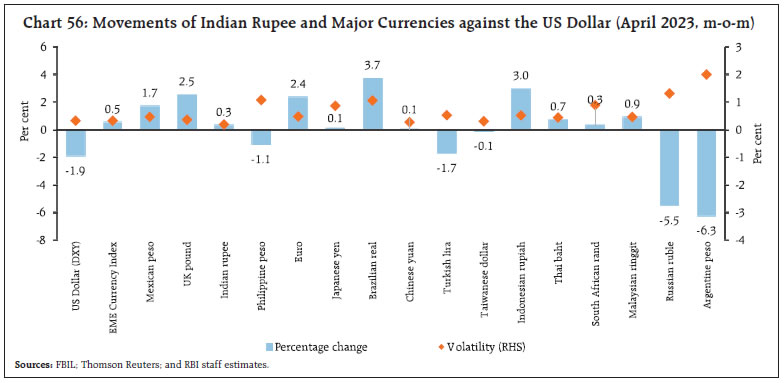
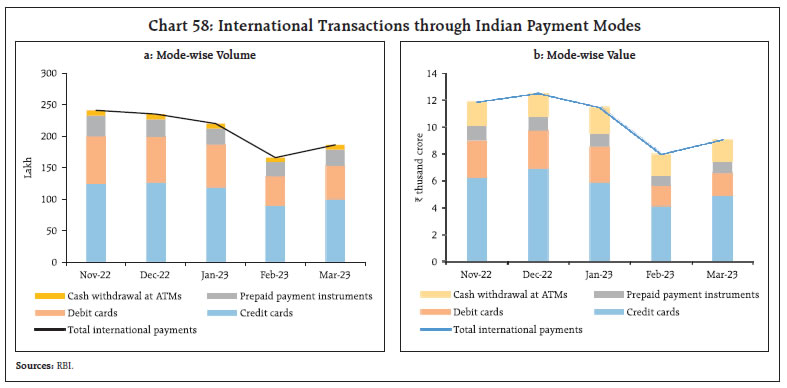
 India crossed the milestone of US$ 100 billion worth of inward remittances in 2022. The digitalisation of cross-border payment rails can harness this growth momentum by enhancing the ease and cost-effectiveness of these flows. The ongoing efforts to boost the interoperability of the UPI with other fast payment systems27 and partner with global digital payment facilitators to expand acceptance of the UPI and RuPay cards worldwide28 will add to the array of policy measures aimed at taking the local payment modes global. Emblematic of these initiatives, international transactions through domestic payment channels have shown a sequential uptick in March 2023. Card payments (through debit and credit cards) comprise a significant share in these payments in both volume and value terms, followed by prepaid payment instruments (Chart 58). 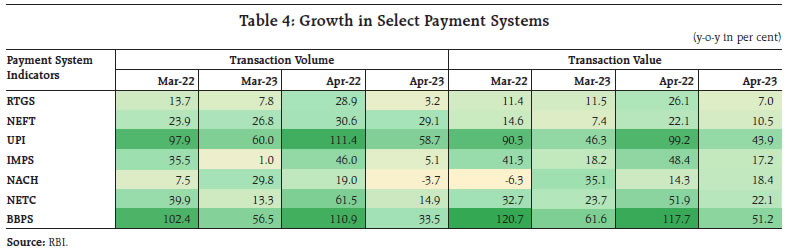
 Over 50 per cent of Indians (i.e., 759 million) are currently active internet users, exhibiting the growing integration with technology. It is projected that the internet user base will expand to 900 million by 2025, buoyed by the deepening of internet services in rural India.29 In the FinTech sector, funding shows early signs of a turnaround with investments worth US$ 1.2 billion recorded in January-March 2023, a sharp growth of 126 per cent over the previous quarter’s level of US$ 523 million. Funds raised, however, stood 55 per cent lower than the US$ 2.6 billion recorded in the same quarter of the previous year.30 Terming this deceleration as a “short-term correction in an otherwise long-term positive trajectory”, India is seen as among the largest FinTech markets globally by 2030, driven by financial inclusion prospects and demographic advantage.31 Conclusion Against this backdrop, what does the immediate future in terms of the first quarter of 2023-24 look like? The RBI’s projections released in April 202332 indicate that real GDP may grow by 7.8 per cent year-on-year (y-o-y), which works out to 13.7 per cent above its pre-pandemic level (the corresponding quarter of 2019-20). This projection embeds a negative momentum [(-) 1.7 per cent] on a seasonally adjusted quarter-on-quarter (q-o-q) basis. This is typical of first quarter outturns, but the good news is that the magnitude of negative momentum is less than what it was in the first quarters of the preceding two years.33 Thus, a gradual normalisation of the hit from the pandemic and the war is setting in. GDP growth in the first quarter of 2023-24 is expected to be driven by private consumption, supported by revival in rural demand that is underway on the back of the encouraging developments in both the kharif marketing season of 2022-23 and the rabi marketing season of 2023-24, the sustained buoyancy in services, especially contact-intensive sectors, and moderating inflationary pressures. Investment activity is also expected to improve, drawing strength from the thrust on capital expenditure in public spending and moderation in commodity prices. Moreover, with capacity utilisation in manufacturing straining at trend levels and above it in some industries, private capital spending will need to get stronger to add additional capacity as demand picks up. The manufacturing sector as a whole is expected to gain from softening input cost pressures. If services exports maintain their recent high profile, the drag from net external demand should moderate through April-June 2023. Domestic service sector activity will continue to be led by the rebound in contact-intensive services and the resilience in construction activity. To close this edition of the State of the Economy on a positive note, the April 2023 monetary policy documents have projected inflation to fall to 5.1 per cent in Q1: 2023-24 from 6.2 per cent in the just preceding quarter. Although the q-o-q change, or momentum, is expected to be higher than in the past quarter - primarily due to the seasonal uptick in food prices - large favourable base effects due to high inflation a year ago following the Ukraine war are expected to counterbalance it and yield the projected moderation in headline inflation. The CPI inflation print for April 2023 indicates that momentum is turning out to be softer than anticipated on account of a fall in wheat prices, the fifth consecutive monthly decline in prices of oils and fats and the third consecutive monthly decline in the prices of eggs. The prices of vegetables and fruits are also weathering the summer heat better and their momentum is lower than their historical record for this time of the year. Kerosene prices are on the decline and importantly, core inflation – CPI excluding food and fuel – is treading on softer momentum (seasonally adjusted) relative to the persistent elevation over the past 10 months. Rice prices could see a significant correction if sales from buffer stocks, which are three times larger than the norm, are undertaken. The pass-through of wholesale price movements – in deflation in April – could also contribute to the softening of retail inflation going forward. Summing up, policy frameworks have to be forward-looking, given the lags in the transmission of policy impulses to the rest of the economy. Forecasts play a central role in these frameworks. They provide a glimpse of the future, based on everything we know today and our best judgement, and perform the role of intermediate variables – they capture a reflection of the goal variables. More often than not these reflections can be hazy, obscured by uncertainties and unknowns and when that happens, it becomes standard operating procedure to denigrate the forecasts. Illustratively, the economist Ezra Solomon once remarked that “the only function of economic forecasting is to make astrology look respectable.”34 Economic forecasting is an inexact science, but its criticism has to be tempered by an understanding of what forecasts actually represent. They are conditioned on the best smell test of all available information at a particular point in time. As new information arrives, judgment has to be recalibrated. As John Maynard Keynes is credited to have remarked: “when the facts change, I change my mind. What do you do, Sir?”.35 Since 2020, economists have had to take positions on epidemiology, military scenarios, supply chains, logistics and international politics in order to make their forecasts. Yet one thing is certain – scarred and scathed by the pandemic and the war, the Indian economy is slowly but surely recovering. Yet there is no room for complacency. An environment of low and stable prices is necessary for strengthening the foundations and resilience of this recovery. Eternal vigil with a readiness to act is its price. On this, a final ‘refrain’ in the poetic sense of the word36 – we can do no better than quote the words of Governor, Shri Shaktikanta Das37: “We remain firm and resolute in our pursuit of price stability which is the best guarantee for sustainable growth”.
|