Global economic conditions are beset by heightened uncertainty as financial conditions remain volatile and financial markets are on edge. In India, aggregate demand conditions remain resilient, supported by a rebound in contact-intensive services. Expectations of a bumper rabi harvest, the fiscal thrust on infrastructure, and the revival in corporate investment in select sectors augur well for the economy. In response to monetary policy actions and supply side measures, headline CPI inflation has gradually declined from its peak of 7.8 per cent in April 2022 to 5.7 per cent in March 2023 and is projected to ease further to 5.2 per cent in Q4: 2023-24. Introduction As the world converged to Washington D.C. in mid-April to take in the spring air with cherry blossoms blooming in a short burst of colour and fading away, the multilateral institutions – the International Monetary Fund (IMF) and the World Bank – issued dire messages about the global economy. One warned of a rocky road ahead as global growth bottoms out in 2023; the other cautioned about a lost decade as an aging workforce, weakening investment and slowing productivity take their toll on global potential growth – “the maximum rate at which an economy can grow without igniting inflation.” Meanwhile, investors have scaled back expectations of global interest rate increases after the sudden failure of some mid-sized banks in certain advanced economies (AEs) and the forced marriage of another that was deemed too-big-to-fail. Trust in the banking sector in these countries is not yet fully restored. The resilience of the global financial system has been severely tested. Sentiment remains fragile, with fears of hidden valuation losses lurking sinisterly in the books of financial institutions. Funding strains confront policy makers, some of whom have put in place emergency liquidity measures that may reverse some part of the quantitative tightening achieved so far. The overarching sense seems to be that central banks and financial regulators must do more to restore confidence and financial stability – their original mandate – rather than excoriate inflation. Accordingly, sharp repricing of monetary policy paths is underway. Consequently, financial conditions remain volatile and financial markets are on edge. The messages from the IMF’s flagship publications imbibed the surrounding uncertainty. Heightened debt risks weighing on the weakest economies and whittled down fiscal buffers were highlighted by the Fiscal Monitor. In this context, it underlined the importance of coordination among creditors on preemptive and orderly debt restructuring. It pointed out that in spite of inflation having reduced some of the burden of burgeoning public debt, fiscal policy must be tightened alongside monetary policy to ease inflation pressures. The other two flagships – the World Economic Outlook (WEO) and Global Financial Stability Report (GFSR) – also recommended that the fight against inflation must continue. Only in the event of systemic financial stress should the overriding priority shift to maintaining confidence in the global financial system, with adequate liquidity to limit contagion. Meanwhile, specific tools need to be deployed to ensure that banks’ governance and risk management is commensurate with risk profiles. Efforts should be directed to strengthen resolution regimes and crisis management frameworks. Monitoring the build-up of risks in banks, non-bank financial intermediaries, real estate sectors and less/lightly regulated pockets of the financial sector is key. The IMF also recognised financial stability risks for emerging and developing economies (EMDEs) stemming from exchange rate volatility and potential capital outflows, and acknowledged the legitimacy of tools such as foreign exchange interventions and capital flow measures. For the longer term, the IMF has underscored the urgency of preventing catastrophic climate change by accelerating green transition. For this purpose, mobilising capital for EMDE climate finance is essential. In its view, strengthening cooperation on common global public goods such as the climate and mitigating fragmentation risks due to industrial policy and subsidies that threaten to shut off economies from the world assume importance. In the context of the latter, the IMF advocated the removal of trade restrictions and other discriminatory measures. For the Indian economy, the multilateral institutions downgraded their earlier forecasts of real GDP growth for 2023-24, citing ‘slower consumption growth and challenging external conditions’ (World Bank, 20231) and upward revisions of GDP data of past years (IMF 20232). This downcasting of growth for India is in line with the lowering of global growth projections as well as those for EMDEs. Yet, India is expected to be among the fastest growing major economies of the world, accounting for 15 per cent of global growth – the second largest contribution, and higher than that of the US and EU put together. Although too early to tell, most recent data arrivals suggest that the multilateral institutions – the IMF, in particular – might encounter forecast errors, with actual outcomes surprising them positively. Aggregate demand conditions in India have remained resilient so far. Urban consumption demand has risen robustly, with the rebound in contact-intensive services providing a strong upside. Rural demand indicators are steadily improving, brightened by expectations of a bumper rabi harvest. Damage to standing crops due to unseasonal rains and hailstorms appears contained. The setting in of El Nino conditions in June and developing into a strong event as predicted by the US National Oceanic and Atmospheric Administration is a downside risk for the prospects for agriculture; however, the Indian Ocean Dipole (IOD), which is the difference in sea surface temperature between the western pole in the Arabian Sea and an eastern pole south of Indonesia is currently neutral and forecast to turn positive. Its influence on rainfall variability in the region is likely to be beneficial for south-west monsoon (SWM) precipitation. Investment activity in India is exhibiting buoyancy on the back of strong composite purchasing managers indices (PMIs) – India has the highest PMI among comparators – the fiscal thrust on infrastructure spending, and revival in corporate investment in certain key sectors. The total flow of resources to the commercial sector, including bank credit, has increased by 37 per cent up to March 2023. Merchandise exports have risen by 6 per cent in 2022-23 and services exports are booming. Taking all these factors into consideration, the risks are evenly balanced around real GDP growth for 2023-24 at 6.5 per cent as projected by the monetary policy committee (MPC) of the Reserve Bank of India (RBI). Even if El Nino impacts value added in agriculture, real GDP growth in India would be well above 5.9 per cent projected in the IMF’s WEO. A dormant actor in the recovery of the Indian economy has been India Inc. After a robust turnaround in 2021-22 from contraction in the preceding two years, corporate revenues and profits moderated in 2022-23, but they remain healthy amidst multiple challenges. This might provide the fillip for the much-awaited revival in the corporate capex cycle in 2023-24. Signs of upturn are becoming evident in industries such as cement, steel, oil and gas, textiles and data centres, to name a few early birds. Supply chain realignments will also help, especially industries such as pharmaceuticals, semi-conductors and renewables. Corporate fortunes will hinge around a durable reduction in inflation which will bring in its train stronger consumer discretionary spending and hence revenue growth, alongside a moderation in interest expenses. Input costs are likely to moderate as international commodity prices ease. On the other hand, the weakening of exports from the second half of 2022-23 could affect industries like two wheelers, auto ancillaries, garments, chemicals, metals and gems and jewellery. The services sector, especially information technology, a wide range of business services, tourism and exports out of global capability centres remain bright spots. The RBI’s industry monitoring group (IMG) conducts a semi-annual survey for the purpose of informing monetary policy formulation. Feedback from various industry bodies, credit rating agencies and banks in the latest round of the survey solicited just ahead of the MPC’s April 2023 meeting indicates that corporate sales are recording double digit growth across several categories, especially consumer durables, aided by increased sales in premium products. On the other hand, consumer non-durables volumes are suffering from high prices, with decline in rural sales and in the unorganised segment of traditional trade (kirana stores), particularly in respect of items of non-food consumption. On the other hand, the e-commerce market estimated at US$ 100 billion in 2022, is poised for robust growth in 2023. Survey evidence points to crowding in of investment in infrastructure-related sectors. The production linked incentive scheme and growth prospects in new age sectors3 is bringing in private investment. Capacity utilisation has breached decadal averages for major capital-intensive sectors as well as contact intensive services sectors, barring the automobile sector in which capacity utilization in two wheelers and three wheelers is lagging. Going forward, the upcoming second phase of BS 6 emission norms from April 1, 2023 and additional mandates on safety features would continue to put pressure on entry level cars. The information technology (IT) sector has remained resolute, aided by cost rationalisation. The micro, small and medium enterprises (MSME) sector is on a path of recovery, with revenues likely to cross pre-pandemic levels in 2023-24, except for export oriented sectors affected by global headwinds. Easing commodity prices may support improvement in profit margins and improve credit profiles in the sector. In the hospitality industry, revenues have recovered across hotel classes, indicating a widespread revival in the industry. Credit ratios are improving across sectors, with upgrades exceeding downgrades. Credit ratings have appreciably improved for real estate, followed by finance companies, power, textiles and engineering. Credit growth remains resilient with rising inquiry levels, although some moderation has set in more recently. Delinquencies are reducing in the 90+ days past due bracket across all categories of consumer credit, barring credit cards and education loans. Set against this backdrop, the remainder of the article is structured into four sections. Section II covers the rapidly evolving developments in the global economy. An assessment of domestic macroeconomic conditions is set out in Section III. Section IV encapsulates financial conditions in India, while the last Section sets out concluding remarks. II. Global Setting Global economic conditions are once again beset by heightened uncertainty. In its World Economic Outlook (WEO) released in April 2023, the IMF projected global growth to decline to 2.8 per cent in 2023 – a downward revision by 10 basis points from its January 2023 projection – from 3.4 per cent in 2022, before settling at 3.0 per cent during 2024-28 (Table 1). Recent financial sector turmoil, persistently high inflation, the ongoing conflict in Ukraine and its spillovers and the lingering effects of the pandemic including new waves of infections, are weighing on global growth. The IMF also highlighted an alternative scenario with severe financial sector stress which could cause global growth to fall to 2.5 per cent in 2023. Global headline inflation under the baseline scenario is likely to fall from 8.7 per cent in 2022 to 7.0 per cent in 2023 (a 40 bps upward revision from the January forecast) while underlying core inflation could remain high for longer. 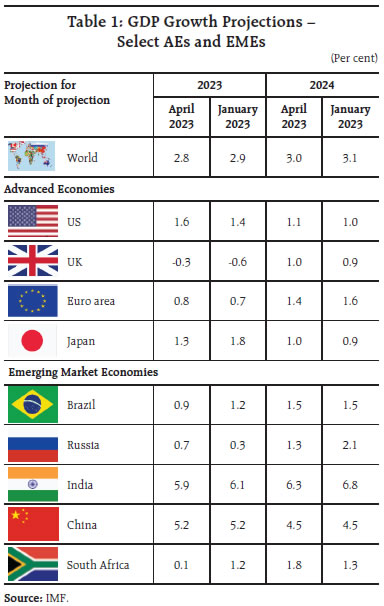
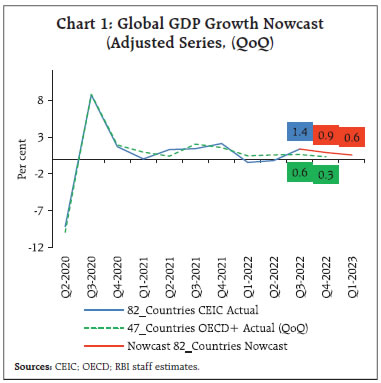 Our model-based nowcast projects a positive global growth momentum of 0.6 per cent in Q1:2023 (Chart 1). Among the high-frequency indicators, the global composite purchasing managers index (PMI) increased to 53.4 in March 2023 from 52.1 in the previous month, driven by the global services PMI, which increased to 54.4 in March from 52.6 in February. On the other hand, global manufacturing PMI declined to 49.6 in March 2023 from 49.9 a month ago due to slower growth of output and employment, and a fall in new orders and stocks of purchases. 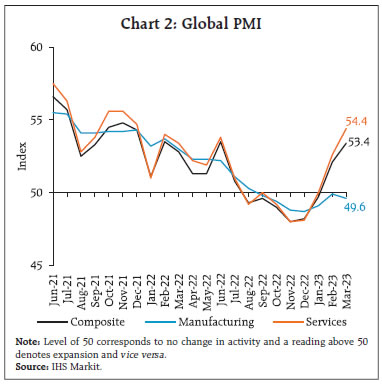
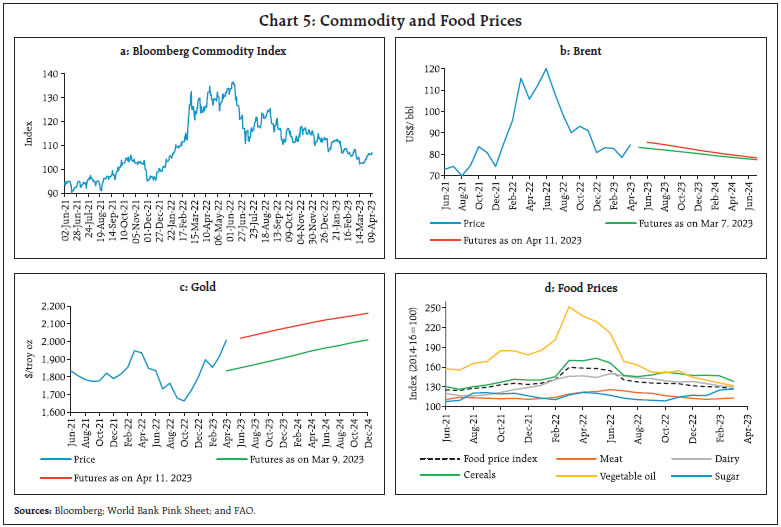
 World trade volume contracted for the third consecutive month in January 2023 by 1.5 per cent (y-o-y) due to negative momentum, despite a favourable base effect (Chart 3a). The Baltic Dry Index – a measure of shipping charges for dry bulk commodities – however, more than doubled, since mid-February, buoyed by higher rates for capesize and panamax vessel segments, with the index growing by over 40 per cent in March 2023 (Chart 3b). The United Nations Conference on Trade and Development (UNCTAD) nowcast for Q1:2023 suggests a rebound in global trade with goods projected to increase by about 1 per cent sequentially, while trade in services is expected to increase by about 3 per cent on the same basis (Chart 4). In March, global commodity prices softened further edging closer to pre-Ukraine war (January 2022) levels as prices of most agricultural commodities, especially grains, moderated post the renewal of the Black Sea Grain initiative4 and supply bottlenecks continued to ease (Chart 5a). Crude oil prices treaded down in March, reaching an average of US$ 78.5 per barrel as global oil supply increased, particularly from the US and Canada. Prices rose in early April following a surprise production cut announcement by the Organization of the Petroleum Exporting Countries (OPEC) [Chart 5b]. Gold prices rebounded on safe-haven demand amidst bank failures in the US (Chart 5c). The Food and Agricultural Organization (FAO) food price index5 declined by 2.1 per cent (m-o-m) in March 2023, led by drops in cereal, vegetable oil and dairy prices, whereas those of sugar and meat increased (Chart 5d). The index has been on a secular decline from its peak recorded a year ago, leading to a y-o-y fall of 20.5 per cent in March 2023. 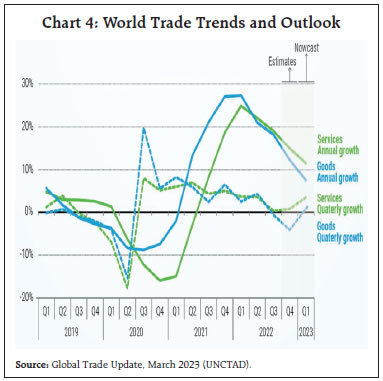
 Consumer price inflation has come off from recent peaks in most economies due to softening energy prices and easing supply chain bottlenecks; yet core inflation remains stubborn. Notwithstanding the recent softening, headline inflation remains well above target across most AEs and EMEs. US headline CPI inflation (y-o-y) eased markedly to 5.0 per cent in March 2023 from 6.0 per cent in February – the lowest level since May 2021 – due to a favourable base effect. Inflation based on the personal consumption expenditure (PCE) index also eased to 5.0 per cent in February from 5.3 per cent in the previous month (Chart 6a). In the Euro area, inflation slowed significantly to 6.9 per cent in March 2023 from 8.5 per cent in the previous month, driven by negative momentum in the energy sub-component. In the UK, however, inflation inched up to 10.4 per cent in February 2023 from 10.1 per cent in January, with high monthly price momentum in food and non-alcoholic beverages. Japan’s CPI (all items less fresh food) inflation eased to 3.1 per cent in February from an over-40-year high of 4.2 per cent in January 2023. Among the EMEs, inflation eased further in Brazil (4.7 per cent), and China (0.7 per cent) in March 2023 while it increased marginally in South Africa in February 2023. In Russia, it fell sharply to 3.5 per cent in March 2023 driven by base effects (Chart 6b). 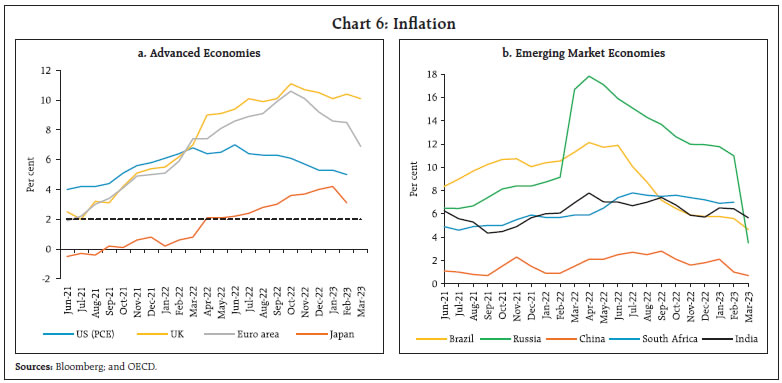 Global financial markets exhibited considerable volatility since March 10, 2023 as financial stability concerns following the collapse of a few banks in the US rattled markets and caused sharp corrections in equity and bond valuations. Markets recouped losses by end-March and continued to trade higher in April so far (up to April 17) as confidence returned on policy actions assuaging concerns of contagion (Chart 7a). The US 2-year G-sec yield touched the 5 per cent mark on March 07, 2023, reaching highs last seen in 2007 as incoming data on employment and inflation suggested a hawkish monetary policy stance going forward. The banking sector stress in March has, however, engendered expectations of a turn in the monetary policy cycle, softening yields (Chart 7b). The US dollar shed 2.3 per cent in March on perceptions of the Fed stepping back from aggressive policy tightening. Concomitantly, the MSCI currency index for EMEs gained momentum by rising 1.6 per cent even though capital flows remained volatile (Chart 7c and 7d). The volatility index (VIX) was considerably lower across jurisdictions relative to its levels in early March 2023 (Chart 8a). Consequently, financial conditions have also partly eased in major economies by the end of March (Chart 8b).  Central banks have pivoted towards a pause or smaller rate hikes as heightened financial market volatility has added further uncertainty to the economic outlook (Chart 9a). In March 2023, the US Federal Open Market Committee (FOMC) increased its target range for the federal funds rate by 25 bps, while providing forward guidance about additional policy tightening in the future. Following the turmoil in the banking sector, the US Fed in March announced a new lending facility – the Bank Term Funding Program (BTFP) – to provide banks liquidity for meeting the needs of all their depositors. Additionally, the Federal Reserve, along with the Bank of Canada, the Bank of England, the Bank of Japan, the European Central Bank and the Swiss National Bank announced coordinated action on March 19, 2023 to enhance the provision of liquidity via standing US dollar liquidity swap line arrangements. Switzerland and Norway raised their key rates in March by 50 bps and 25 bps, respectively. The Reserve Bank of New Zealand and Bank of Israel hiked their policy rates by 50 bps and 25 bps, respectively, in their April meetings, while Australia, Korea and Singapore paused. 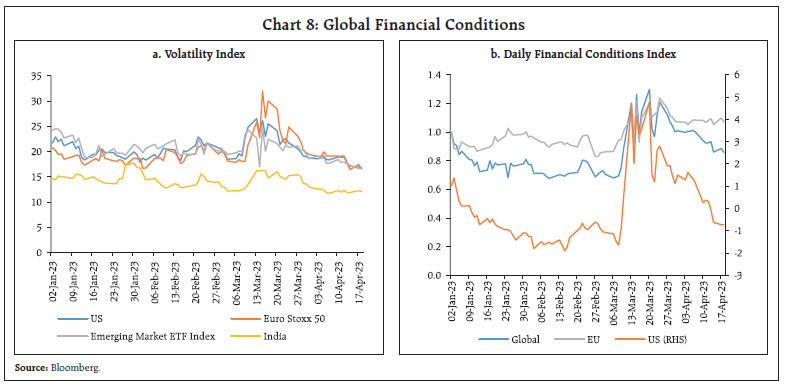
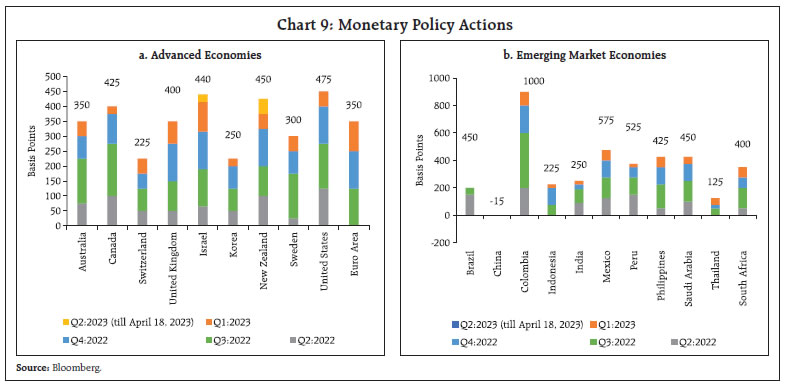 Most EME central banks have also pivoted to relatively less aggressive monetary policy actions (Chart 9b). In March 2023, Mexico and the Philippines raised their policy rates by 25 bps each while South Africa increased by 50 bps. Indonesia, Peru, and Romania in February held their key rates unchanged while Chile kept its policy rate the same in the April meeting. China, on the contrary, continued with its accommodative stance reducing the required reserve ratio (RRR) for financial institutions by 25 bps with effect from March 27, 2023. III. Domestic Developments Amidst an uncertain global outlook, the Indian economy exhibited signs of resilience, as indicated by various high-frequency indicators. Our index of supply chain pressures for India (ISPI) continued to remain at levels below its historical average since July 2022 (Chart 10). The economic activity index (EAI), which tracks the movements of a set of 27 high-frequency indicators, indicated that overall economic activity in Q4:2022-23 may have gathered some momentum in February (Chart 11a). Our nowcast of real GDP growth for Q4:2022-23 is placed at 5.4 per cent (Chart 11b). Aggregate Demand Among the lead indicators of demand conditions, E-way bill volumes and toll collections remained ebullient, scaling new highs in March 2023 (Chart 12a and 12b). Average electricity generation, however, moderated in March 2023, partly on account of the temperature relief provided by unseasonal rains (Chart 12c). In March 2023, the daily average consumption of fuel further edged up to a new peak (Chart 13a). Retail sales of vehicles, as proxied by vehicle registrations, recorded a four-month high in March due to increases in both non-transport and transport vehicles’ registrations (Chart 13c). Two wheeler sales went up by 7.7 per cent y-o-y, with the electric vehicle (EV) segment recording highest ever sales at 1.4 lakhs in March. Sales of motorcycles and three wheelers were also spurred by healthy demand during the Holi festival followed by higher dispatches before BS6 phase II transition (to be implemented from April 2023).6 Tractor sales growth remained in double digits for the fourth consecutive month, aided by better crop prices (Chart 13d).
In the tourism sector, the hotel occupancy rate crossed 70 per cent for the first time since the onset of the pandemic (Chart 14a). Average room rates also increased sharply in February 2023 over a year ago, aiding growth in revenue per available room (RevPAR) [Chart 14b]. Improvements in demand conditions led to capacity augmentation efforts by the business sector as reflected in their investment intentions (Chart 15). There was a surge in the quarterly average of the total cost of projects sanctioned by banks and financial institutions. Households’ assessment of economic conditions reported in the Reserve Bank’s consumer confidence survey (CCS) shows continued rise in consumer confidence from its historic low in mid-2021 (Chart 16). The major takeaways from the Reserve Bank’s enterprise surveys are summarised in Annex 1. According to the Centre for Monitoring Indian Economy (CMIE), the all-India unemployment rate was at 7.8 per cent in March 2023, up from 7.5 per cent a month ago (Chart 17a). The employment rate (ER) and labour force participation rate (LFPR) edged down (Chart 17b).
Employment in the organised manufacturing sector as polled by the PMI for manufacturing weakened in March 2023 for the first time since March 2022 (Chart 18). Services sector employment, however, recorded marginal expansion in March. With the end of rabi sowing, the demand for work under Mahatma Gandhi National Rural Employment Guarantee Scheme (MGNREGS) recorded a slight uptick in March month-on-month (m-o-m). The y-o-y growth rate remains in negative territory, indicating improved rural labour market conditions as compared with a year ago (Chart 19a). To protect rural labourers from the hardships of higher inflation, the daily wages under MGNREGS have been revised by the central government by 2 to 10 per cent (₹ 7 - ₹ 26/day) with effect from April 01, 2023 (Chart 19b).
India’s merchandise7 exports grew by 3.7 per cent on a m-o-m basis, reaching a 9-month high of US$ 38.4 billion in March 2023 (Chart 20). On a y-o-y basis, exports registered a contraction of 13.9 per cent due to an unfavourable base effect. Overall, merchandise exports reached an all-time high of US$ 447.5 billion in 2022-23, growing by 6.0 per cent over their level in the previous year. 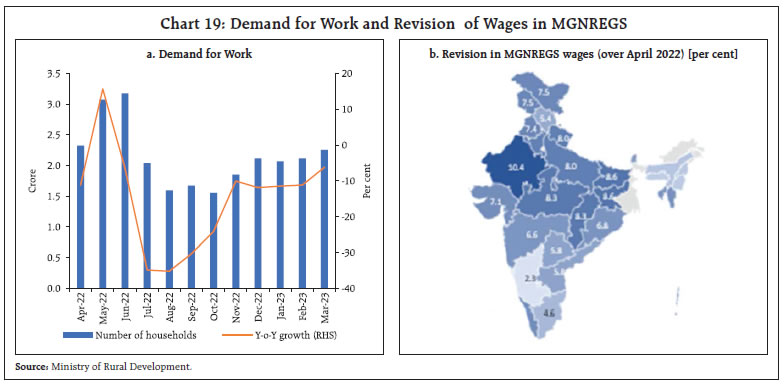
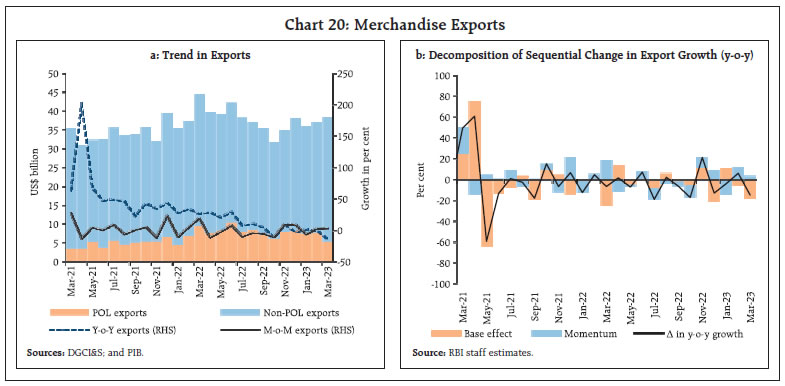 Out of the 30 major commodities, 17 commodities accounting for 68.7 per cent of the export basket witnessed y-o-y contraction in March 2023. Petroleum products, gems and jewellery and engineering goods dragged exports down whereas electronic goods, oil meals and rice supported export growth in March (Chart 21a). Non-oil exports contracted for the eighth consecutive month in March. On an annual basis, petroleum products were the major driver of export growth in 2022-23, with their share in total exports increasing to 21.1 per cent vis-à-vis 16.0 per cent in 2021-22. Among non-oil products, electronic goods, rice and chemicals led export growth whereas engineering goods, cotton yarn, fabrics, plastic and linoleum contributed negatively to exports in 2022-23 (Chart 21b). 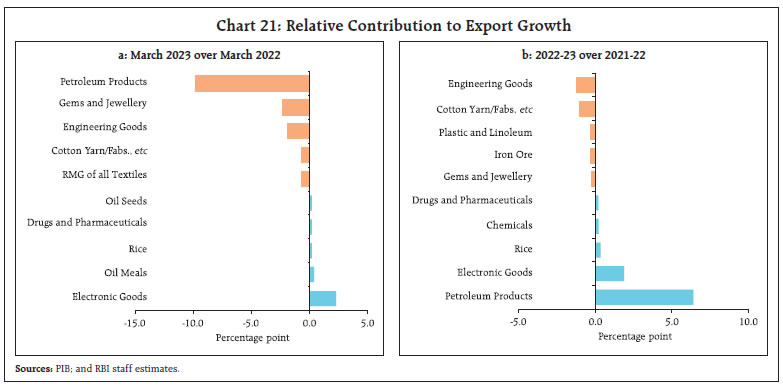 India registered record exports of defence goods in 2022-23, with exports having risen ten-fold in a span of seven years leveraging on policies such as “Atmanirbhar Bharat” (Chart 22). Recent initiatives, including the introduction of an open general export license policy, simplified end-to-end online export authorisation and establishment of defence industrial corridors augur well for India’s defence exports going forward. Despite the recent moderation, India’s merchandise exports recorded a compound annual growth rate (CAGR) of 7.9 per cent between 2015-16 and 2022-23 under the aegis of the previous Foreign Trade Policy (FTP) that was in place till March 2023 (Chart 23). The Government announced FTP 2023 on March 31, 2023 which aims at reducing transaction costs and encouraging ease of doing business through process re-engineering and automation. The FTP will be based on time-tested schemes facilitating exports and is responsive to the emerging requirements of trade.
Merchandise imports at US$ 58.1 billion in March 2023 recorded a positive momentum of 9.1 per cent (Chart 24). On a y-o-y basis, however, they contracted for the third consecutive month on account of a large base effect. At a disaggregated level, 14 major items accounting for 65.5 per cent of the import basket, registered contraction. Petroleum, oil and lubricants (POL), electronic goods and coal were the main items that dragged down overall imports while, gold, machinery, and metalliferous ores and other minerals contributed positively in March (Chart 25a). Overall, merchandise imports also reached an all-time high of US$ 714.2 billion in 2022-23, increasing by 16.5 per cent y-o-y. Annual import growth was supported by POL, coal and transport equipment, while gold, medicinal products, and pearls, precious and semi-precious stones dragged down growth (Chart 25b). 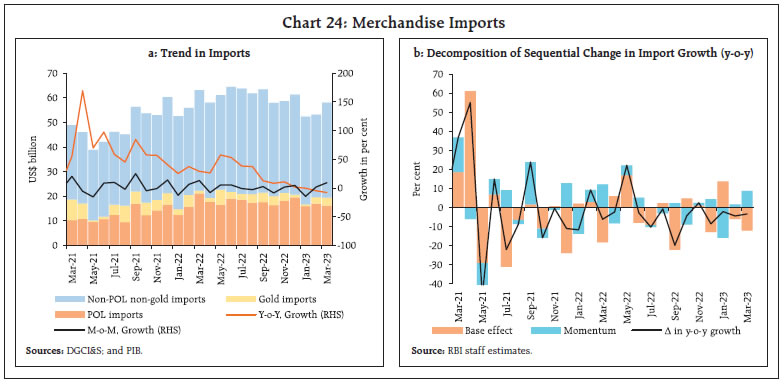 Among agricultural commodities, import dependence on pulses has come down in recent years. The import dependency ratio of imports to total consumption for pulses has reduced to about 8.0 per cent for 2022-23 from 19.0 per cent in 2013-14. Production of pulses has increased significantly in recent years and is expected to have hit a record of 27.8 million tonne in 2022-23, helping India to become Atmanirbhar in pulses by further reducing import dependency while stimulating exports (Chart 26).
Due to the faster sequential increase in imports than in exports, the merchandise trade deficit increased to US$ 19.7 billion in March 2023. In 2022-23, India’s trade deficit increased to US$ 266.8 billion, 1.4 times the level of the previous year. The increase in the deficit was mainly on account of petroleum products, which were 22.0 per cent higher than a year ago (Chart 27). During 2022-23 (April – February 2022-23), the financial position of the central government remained sound, helped by buoyant tax collections under major tax heads such as income tax, corporation tax and the goods and services tax (GST). On the expenditure front, despite the spike in spending on subsidies, the emphasis on capital expenditure has significantly improved the quality of expenditure. This is visible in the year-on-year (y-o-y) growth in capital outlay of 16.7 per cent vis-à-vis a growth of 9.2 per cent in revenue expenditure. This resulted in the reduction of the revenue expenditure-capital outlay (RECO) ratio, an indicator of quality of expenditure (Chart 28a and 28b).
As a result, the gross fiscal deficit (GFD) remained largely the same as in the corresponding period of the previous year (Chart 29). As per the revised estimates (RE) released by the Government on February 1, 2023 revenue and capital expenditure are expected to grow (y-o-y) by 8.1 per cent and 22.8 per cent, respectively, during 2022-23. Revenue and capital expenditure would require to grow by 2.5 per cent and 28.2 per cent, respectively, during March 2023 to meet budgetary targets (Chart 30a and 30b). On the receipts side, gross tax revenue recorded a growth of 12.0 per cent. Collections from excise duty recorded a contraction, attributable to the cut in excise duty on petrol and diesel during May 2022. Both direct and indirect taxes registered a y-o-y growth of 15.9 per cent and 8.1 per cent, respectively (Chart 31).
During April-February 2022-23, non-tax revenue reached 95.0 per cent of the RE for 2022-23, mainly due to higher dividend payment by central public sector undertakings (CPSEs). On the other hand, receipts from disinvestment stood at ₹38,671 crore, which was only 64.5 per cent of the RE for 2022-23. On a y-o-y basis, however, receipts from disinvestment recorded an improvement, led by the successful initial public offer (IPO) of Life Insurance Corporation (LIC) in May 2022. GST collections (Centre plus States) grew by 12.7 per cent (y-o-y) in March 2023. At ₹1.6 lakh crore, they were the second highest since the launch of the GST in July 2017 (Chart 32). Gross GST collections for 2022-23 grew by 21.4 per cent. This reflects an average gross monthly GST collection of almost ₹1.51 lakh crore during 2022-23 vis-à-vis ₹1.24 lakh crore in the previous year.
Aggregate Supply Unseasonal rain in the latter half of March was of the largest magnitude since 2015 (Chart 33a). While it posed a threat to the standing rabi crops, it weakened the heatwaves building up since February 2023 thereby minimising the shrinking of grains as what happened last year. During a similar episode in March 2015, the loss in production8 was marginal in the case of wheat and mustard, but substantial for gram (Chart 33b). Although overall production of wheat did not face significant decline, mandi arrivals were delayed by around 10 to 15 days along with a spike in prices (Chart 34a and 34b). Open market sales (OMS) have cooled down the price of wheat and atta all over the country. The robust procurement of new produce from the ongoing harvest is expected to aid the process further (Chart 34c).9 The target for public procurement of wheat for the upcoming rabi marketing season of 2023-24 is set at 341.5 lakh tonne. As of April 11, 2023 procurement stood at 16.7 lakh tonne (as compared with 20.5 lakh tonne on the corresponding date of the previous year) with the bulk (88.4 per cent) of the procurement being from Madhya Pradesh.
As regards rice, the cumulative procurement in the kharif marketing season (October 01, 2022 – April 11, 2023) stood at 493.3 lakh tonne, 2.4 per cent lower than last year. The public stocks stood at 3.2 times the buffer norm for rice and 1.1 times for wheat as of April 01, 2023. Chana stocks at 1.2-1.3 million tonnes10 are also sufficient to provide a buffer against production shocks. Following an estimated 13.1 per cent y-o-y decline in tur production for 2022-23 (as per second advance estimates), the Government extended its policy of free imports (which was earlier till March 31, 2023) by another year.11 Despite regular arrivals of import, tur prices have remained significantly higher than in the previous year (Chart 35).12 In order to monitor the stock of tur held by entities such as importers, millers, stockists, and traders, the Government has constituted a committee which would be working closely with the State Governments. As per the India Meteorological Department’s (IMD) long range forecast released on April 11, 2023 the south west monsoon (SWM) is likely to be normal this year at 96 per cent of the long period average (LPA) which has boosted kharif crop prospects. The forecast suggests a 49 per cent probability for rainfall to be normal or above for the country as a whole. Currently, La Niña conditions have changed to neutral over the equatorial Pacific region, but El Niño conditions are likely to develop in the second half of the season which is generally associated with deficient SWM rains. However, positive Indian Ocean Dipole (IOD) conditions could offset the impact of El Niño.  In the industrial sector, the headline PMI for manufacturing at 56.4 in March 2023 expanded at the fastest rate in three months led by a pick-up in output and new orders (Chart 36a). Output in the service sector remained in the expansionary zone at 57.8 in March 2023 albeit with a moderation from 59.4 a month ago, due to softening in new business, future activity, and employment (Chart 36b). In the services sector, railway freight earnings remained largely flat in March, as freight traffic of coal and container services recorded expansion where as cement and foodgrain recorded contraction (Chart 37).
In the construction sector, activity remained robust, with steel consumption sustaining growth in March (Chart 38). Steel consumption recorded double-digit growth in March, partly aided by favourable base effects. High-frequency indicators in the service sector exhibited resilience in March 2023 with domestic transport of goods picking up as reflected by growth in railway freight traffic and E-way bill volumes (Table 2). In terms of regional policy initiatives, Karnataka has amended the state labour laws which now allow industries to extend working hours to provide a boost to the local manufacturing sector. Tamil Nadu released its Organic Farming Policy 2023 to ensure agricultural sustainability. Tamil Nadu, Telangana, Madhya Pradesh, and Punjab have announced measures to provide compensation to farmers for crop loss due to unseasonal rains and hailstorms. As part of the State budget, Tamil Nadu has announced a monthly direct cash transfer scheme (₹1,000), targeting about one crore eligible women. Assam also has proposed to transfer ₹1,000 into all bank accounts of women members of self-help groups (SHGs) to incentivise them to maintain an active bank account and prepare a business proposal.
Inflation Inflation, as measured by y-o-y changes in the all-India consumer price index (CPI), moderated to 5.7 per cent in March 2023 from 6.4 per cent in February.13 The decline was broad-based across major groups viz., food, fuel and core (excluding food and fuel) [Chart 39a and 39b]. The fall in headline inflation by 78 bps between February and March was on account of a large favourable base effect (96 bps), which more than offset a positive price momentum of around 23 bps during the month. Within major groups, the m-o-m increase in prices was of the order of 23 bps in food and beverages and 26 bps in the core group; while fuel group price index remained unchanged. In terms of annual inflation, CPI food inflation moderated sharply to 5.1 per cent in March from 6.3 per cent in February on account of a favourable base effect of 132 bps, which overwhelmed a positive momentum of 23 bps. In terms of sub-groups, inflation moderated sharply in the case of milk, cereals, and sugar, driven by negative momentum (Chart 40). Spices, non-alcoholic beverages and prepared meals also recorded lower inflation while edible oils, meat and fish registered deflation. Inflation in pulses, eggs and fruits edged up while vegetables registered lower deflation in March (Chart 41).
Inflation in the fuel and light group declined to 8.9 per cent in March from 9.9 per cent in February, mainly driven by moderation in kerosene (PDS) and firewood and chips price changes. Electricity price inflation remained steady even as LPG price inflation registered an uptick. Core inflation softened to 5.7 per cent in March from 6.1 per cent in February. The moderation was broad-based with 7 out of 9 sub-groups (pan, tobacco and intoxicants; recreation and amusement; clothing and footwear; household goods and services; transport and communication; education; and personal care and effects) recording a deceleration in inflation. Housing and health sub-groups, however, registered an increase. In terms of regional distribution, rural inflation (5.5 per cent) was lower than urban inflation (5.9 per cent) in March 2023 for the first time since May 2022 with the fall in rural inflation coming largely from vegetables and oils (Chart 42). Among the states, Tripura experienced inflation in excess of 8 per cent whereas Chhattisgarh, Delhi, Goa, Himachal Pradesh, Manipur and Meghalaya recorded inflation below 4 per cent (Chart 43). High frequency food price data for the month of April (April 1-12) from the Department of Consumer Affairs (DCA) point to a decline in cereal prices, primarily due to a fall in wheat and atta prices. Pulses prices registered a broad-based increase while edible oil prices, barring groundnut oil, continued to decline. Among key vegetables, prices of onions and potatoes softened, while tomato prices edged up (Chart 44). Retail selling prices of petrol and diesel in the four major metros remained steady in April so far. While LPG prices were kept unchanged in April after an increase observed in March, kerosene prices declined sharply in April (Table 3). Wholesale price index (WPI) based input costs inflation continued to moderate in March 2023 (Chart 45). The decline in input cost pressures was primarily driven by fall in prices of HSD (High Speed Diesel) and electricity.
| Table 3: Petroleum Products Prices | | Item | Unit | Domestic Prices | Month-over- month (per cent) | | Apr-22 | Mar-23 | Apr-23^ | Mar-23 | Apr-23 | | Petrol | ₹/litre | 112.61 | 102.92 | 102.92 | 0.0 | 0.0 | | Diesel | ₹/litre | 100.19 | 92.72 | 92.72 | 0.0 | 0.0 | | Kerosene (subsidised) | ₹/litre | 56.99 | 54.21 | 49.20 | -2.8 | -9.2 | | LPG (non-subsidised) | ₹/cylinder | 960.13 | 1113.25 | 1113.25 | 4.7 | 0.0 | ^: For the period April 1-13, 2023.
Note: Other than kerosene, prices represent the average Indian Oil Corporation Limited (IOCL) prices in four major metros (Delhi, Kolkata, Mumbai and Chennai). For kerosene, prices denote the average of the subsidised prices in Kolkata, Mumbai and Chennai.
Sources: IOCL; Petroleum Planning and Analysis Cell (PPAC); and RBI staff estimates. | Selling prices edged up across manufacturing and services, as indicated by the PMI data for the month of March 2023; however, the pace of expansion remained muted. Input costs across manufacturing and services sector recorded a lower magnitude of expansion in March as compared with a month ago (Chart 46).
Manufacturers’ assessment and expectation14 on cost of raw materials (CRM), as reflected in net responses (NRs)15 in the RBI’s quarterly industrial outlook survey (IOS), closely track movements in wholesale prices of industrial raw materials16 (Chart 47). Similarly, NRs on IOS selling prices (SP) track WPI Manufactured products inflation (weight: 64.2 per cent) quite well (Chart 48). The results of the latest round of survey indicate moderation in the pace of increase in input costs and a concomitant moderation in selling price increases for the manufacturing sector. Households’ inflation perception (current) have shown signs of easing since September 2022; they recorded a 70 basis points (bps) fall in the March 2023 round of the bi-monthly survey (Chart 49). Concomitantly, three-months ahead and one-year ahead inflation expectations also edged down.
IV. Financial Conditions Liquidity conditions tightened during the second half of March 2023 but improved thereafter towards the month-end and at the beginning of April with a pick up in government spending. Overall, average total absorptions under the liquidity adjustment facility (LAF) stood at ₹2.0 lakh crore during March 16 to April 15, higher than ₹1.5 lakh crore during February 16 through March 15, 2023. Notwithstanding large placement of funds under the SDF at the system level, many banks took recourse to the marginal standing facility (MSF), which averaged ₹0.11 lakh crore during March 16 to April 15, reflective of skewed distribution of liquidity within the banking system. There were also continuous net injections during the period March 16-26, averaging about ₹0.65 lakh crore (Chart 50). To ease the liquidity stress, the Reserve Bank undertook a series of measures which included one 5-day fine tuning variable rate repo (VRR) operation on March 24, 2023 injecting ₹55,885 crore. An amount of ₹5,000 crore was also made available to standalone primary dealers (SPDs) under the standing liquidity facility (SLF) on March 31, 2023 at the prevailing repo rate, with funds availed under this facility (₹3,900 crore) repayable on or before April 5, 2023. In the last week of 2022-23 (i.e., March 25-31), government spending increased by ₹2.55 lakh crore which augmented system liquidity. Despite such improvement in liquidity conditions being further bolstered by the Reserve Bank’s liquidity operations, money market rates tightened appreciably on March 31, with the WACR hardening to 7.34 per cent. This tightening can be attributed to several factors: (i) high borrowing demand from some banks and primary dealers (PDs) on account of financial year closure of accounts; (ii) large spike in excess cash reserve ratio (CRR) maintenance by banks on March 31; (iii) banking system-wide outflows because of residual tax and non-tax payments on March 31; (iv) call market volumes shrinking sharply to ₹6,938 crore on March 31 from ₹12,540 crore on March 29 as participants became reluctant to lend because of year-end balance-sheet considerations; and (v) mutual funds – traditional lenders in the tri-party repo segment – turning into borrowers in the wake of large redemption pressures. On an average basis, the WACR, triparty repo and market repo rates stood 5 bps, 5 bps and 10 bps, respectively, above the policy repo rate during March 16 through April 15, 2023 (Chart 51a). 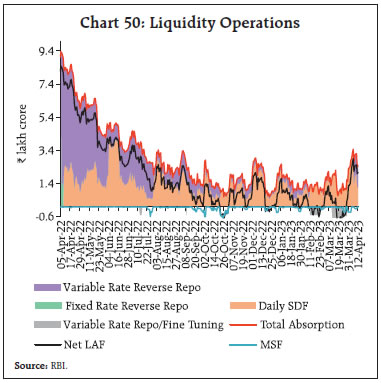 Across the term money segment, rates remained elevated with yields on 3-month treasury bills (T-bill), certificates of deposit (CDs) and commercial paper (CPs) for non-banking financial companies (NBFCs) trading above the MSF rate, reflecting cumulative policy rate hikes, uncertainty and the sharp moderation in domestic surplus liquidity (Chart 51b). In the primary market, fund mobilisation through CDs issuances was strong at ₹6.7 lakh crore during 2022-23, higher than ₹2.3 lakh crore in the previous year. Banks are experiencing additional demand for funds, driven by buoyant credit offtake. During 2023-24 (up to April 7), CD issuances stood at ₹0.11 lakh crore as against ₹0.22 lakh crore in the corresponding period of 2022-23. With the corporate sector increasingly resorting to bank credit for funding requirements, CP issuances moderated to ₹13.7 lakh crore during 2022-23 from ₹20.2 lakh crore in 2021-22. 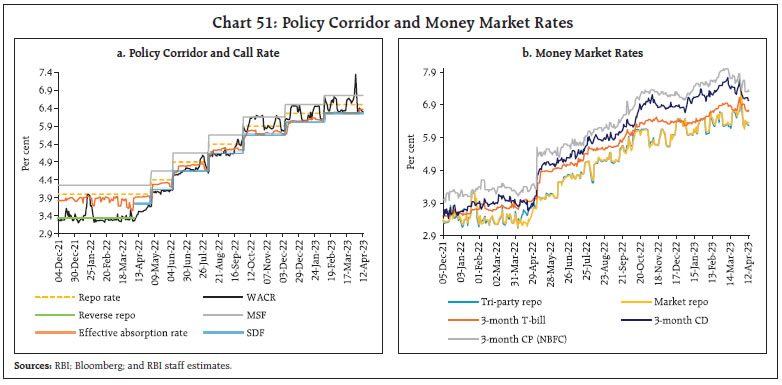 The yield on the 10-year benchmark G-sec (7.26% GS 2033) eased from 7.34 per cent on March 15 to 7.22 per cent on April 13, 2023 (Chart 52a). The flight to safe assets in the wake of the banking crisis in the US resulted in a softening of US treasury yields, with a commensurate impact on domestic yields. Even so, domestic yields largely traded in a narrow range ahead of the release of the monetary policy statement on April 6, 2023. Following the MPC’s decision to pause, the yield on the 10-year G-sec softened from 7.28 per cent to a low of 7.15 per cent on April 6 before closing at 7.20 per cent. The monetary policy decision appeared to be largely unanticipated by the market, as evident from indexed swap (OIS) rates – the 2-month OIS rate declined by 14 bps following the monetary policy announcement. 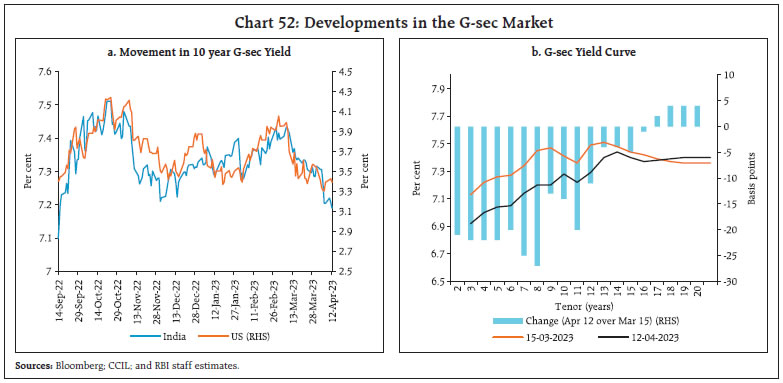 The government borrowing calendar on dated securities for H1:2023-24 released on March 29, 2023 pegged the gross borrowing requirement at ₹8.9 lakh crore – 58 per cent of the total budgeted gross borrowing for the year. The T-bill calendar proposed gross issuance of ₹4.2 lakh crore (net issuance of ₹1.4 lakh crore) for Q1:2023-24. Across the curve, yields softened at the short to mid-end, while they hardened at the longer end (Chart 52b). Corporate bond yields generally eased, while spreads hardened for most of the issuer categories and tenors during the second half of March through April 11, 2023. The average risk premium in the bond market (5-year AAA minus 5 year G-sec) increased sharply during Mar 16, 2023 – Apr 11, 2023 (Table 4). Funds mobilised through corporate bond issuances increased to ₹0.75 lakh crore during February 2023 from ₹0.68 lakh crore in the preceding month. Reserve money (RM), excluding the first-round impact of change in the CRR, grew by 7.5 per cent on a y-o-y basis as on April 7, 2023 (10.1 per cent a year ago) [Chart 53]. Currency in circulation (CiC), the largest component of RM, decelerated to 7.6 per cent from 10.1 per cent a year ago. The moderation in the CiC tracked the increase in digital payments in India in the post-pandemic period through various initiatives of the Reserve Bank, besides a reduction in the ‘dash for cash’ behaviour observed during the peak of the pandemic. | Table 4: Financial Markets - Rates and Spread | | Instrument | Interest Rates (per cent) | Spread (basis points) (Over Corresponding Risk- free Rate) | | Feb 16, 2023 – Mar 15, 2023 | Mar 16, 2023 – Apr 11, 2023 | Variation (in bps) | Feb 16, 2023 – Mar 15, 2023 | Mar 16, 2023 – Apr 11, 2023 | Variation (in bps) | | 1 | 2 | 3 | (4 = 3-2) | 5 | 6 | (7 = 6-5) | | Corporate Bonds | | | | | | | | (i) AAA (1-year) | 8.06 | 8.00 | -6 | 46 | 69 | 23 | | (ii) AAA (3-year) | 8.03 | 8.02 | -1 | 58 | 76 | 18 | | (iii) AAA (5-year) | 7.95 | 8.01 | 6 | 43 | 71 | 28 | | (iv) AA (3-year) | 8.75 | 8.70 | -5 | 130 | 145 | 15 | | (v) BBB-(3-year) | 12.4 | 12.35 | -5 | 495 | 510 | 15 | Note: Yields and spreads are computed as monthly averages.
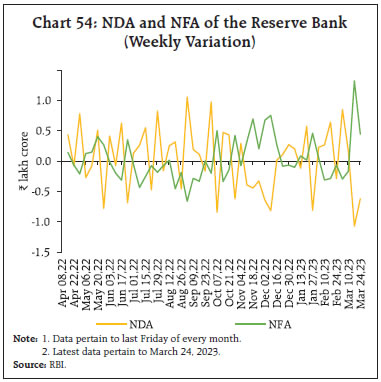
Sources: FIMMDA; and Bloomberg. | During 2022-23 (up to March 24, 2023), the expansion in RM was driven mainly by net foreign assets (NFA) [contributing around 67 per cent], and net domestic assets (NDA) [contributing around 33 per cent] (Chart 54). 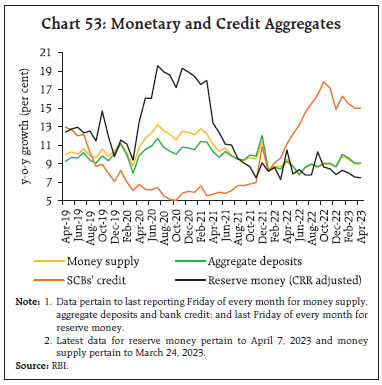
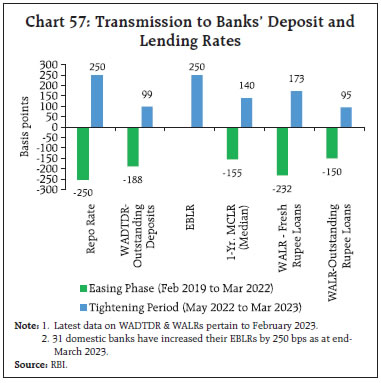
 Money supply (M3) grew by 9.0 per cent (y-o-y) as on March 24, 2023 (8.7 per cent a year ago), primarily driven by its largest component – aggregate deposits with banks – which increased by 9.1 per cent (8.4 per cent a year ago). Scheduled commercial banks’ (SCBs) credit grew in double digits at 15.0 per cent as on March 24, 2023, moderating from the peak of 17.8 per cent recorded in October 2022 due to unfavourable base effects and tapering of the momentum of credit offtake, especially for industry. The deceleration in industrial credit since November 2022 was on account of micro, small and medium enterprises (MSMEs) and large industries, with a decline in credit offtake from the infrastructure segment. Retail loans remained the major driver of overall credit growth, followed by the services sector. Personal loans growth at 20.4 per cent in February was boosted by housing loans, vehicle loans and other small-ticket loans. Consumer durable and credit card loans expanded at a robust pace, reflecting growing consumer demand (Chart 55a and 55b). Credit growth to the services sector was largely contributed by NBFCs. Bank credit growth has been broad-based recording double digit growth across all population groups (rural, semi-urban, urban and metropolitan). There is a rising demand for working capital loans. As on April 07, 2023, SCBs’ credit-deposit ratio stood at 75.8 per cent (71.5 per cent as on April 08, 2022). The incremental credit-deposit (C-D) ratio, which had slipped below 50 per cent around the onset of the pandemic and remained low up to late 2021, surged to 142.2 per cent in November 2022 before moderating to 110.0 as on April 07, 2023 (Chart 56). 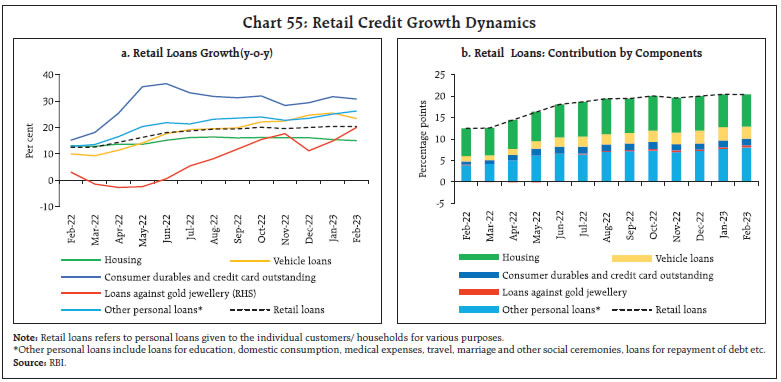 SCBs have adjusted their external benchmark based lending rate (EBLR) to reflect policy rate increases. The 1-year median marginal cost of funds-based lending rate (MCLR) increased by 140 bps during May 2022 - March 2023. The pass-through to weighted average lending rates (WALR) on fresh and outstanding rupee loans increased to 173 bps and 95 bps, respectively, during May 2022-February 2023 (Chart 57). On the deposit side, the weighted average domestic term deposit rate (WADTDR) on outstanding deposits increased by 99 bps during May 2022-February 2023. External benchmark-linked loans dominate outstanding floating rate loans, accounting for a share of 48.3 per cent as at-end December 2022.17 The Government of India revised the rates on small savings instruments (SSIs) in the range of 10-70 bps for Q1:2023-24 vis-à-vis Q4:2022-23. The interest rate on the Public Provident Fund (PPF) remained unchanged (Chart 58). With these adjustments, interest rates on most SSIs are now closely aligned with the formula-based rates. The rates on PPF, post office recurring deposit accounts and the Sukanya Samriddhi account scheme are, however, below the formula-based rates of interest by 26 to 82 bps.18 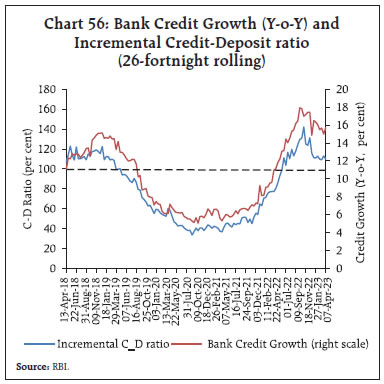
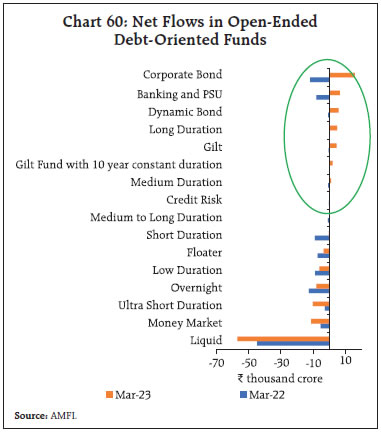
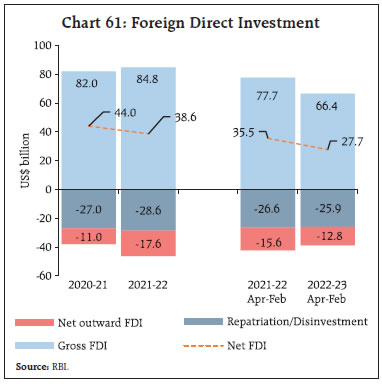
 Domestic equity markets reflected the tremors emerging from the banking turmoil in the US and Europe during the second half of March 2023. Markets recovered towards the month-end, however, as contagion fears receded. In April 2023, positive global cues from lower-than-expected Eurozone inflation, strong domestic manufacturing PMI and encouraging auto sales numbers boosted market sentiments. Furthermore, a pause in the rate hike cycle by the Reserve Bank contributed to the positive momentum. Thereafter, markets declined amid a sell-off in IT sector stocks following announcement of weak Q4: 2022-23 earnings results. Overall, the BSE Sensex gained 3.8 per cent since March 15, 2023 to close at 59,727 on April 18, 2023. In 2023, the banking sector index (BSE-Bankex) has shown resilience, reflecting the soundness and health of the Indian banking sector (Chart 59). In terms of regulatory developments in March 2023, the taxation arbitrage enjoyed by the debt mutual funds has been removed19, bringing uniformity in taxation between various fixed-income investment avenues. Investors rushed to invest in debt mutual funds in the last week of March to take advantage of preferential taxation under the erstwhile tax structure, as the new tax regime kicks in from April 2023 (Chart 60).20 Also, the announcement of the Corporate Debt Market Development Fund (CDMDF) as a backstop facility for the purchase of investment-grade corporate debt securities during times of stress instilled confidence in the corporate bond market. Gross inward foreign direct investment (FDI) moderated by 14.5 per cent during April-February 2022-23 on a y-o-y basis (Chart 61). More than 63 per cent of FDI equity flows were reported to be from Singapore, Mauritius, and the US during this period. Net FDI decreased to US$ 27.7 billion from US$ 35.5 billion a year ago, mainly due to moderation of gross FDI inflows and increase in repatriations. FDI equity flows remained skewed towards manufacturing, followed by financial services and computer services. Together, they constituted around half of the total inflows during April-February 2023. 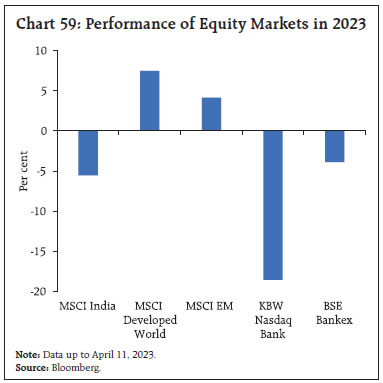
 Foreign portfolio investors (FPIs) turned net purchasers in domestic financial markets during March 2023 (Chart 62), primarily in the equity segment (US$ 1.8 billion), whereas the debt segment recorded outflows. In 2022-23, FPIs withdrew US$ 5.9 billion; since July 2022, however, the FPIs have registered net inflows of US$ 9.2 billion, largely in the equity market. In the second half of March 2023, the capital goods sector, construction segment and fast moving consumer goods sector were the leading recipients of equity FPI. In April 2023 (upto 17th), FPI flows were positive to the tune of US$ 0.7 billion. External commercial borrowings (ECB) disbursements in Jan-Feb 2023 at US$ 2.6 billion have moderated by more than 70 per cent when compared with those in first two months of 2022. With principal payments being slightly lower, however, net ECBs were positive during January-February 2023 in contrast to large net outflows in Q3:2022-23 (Chart 63). Net accretions to non-resident deposits increased to US$ 6.4 billion in April-February 2022-23 from US$ 2.4 billion a year ago.
Key indicators of external sector vulnerability such as the external debt to GDP ratio, short-term debt (residual maturity) to reserves ratio, debt service ratio and net international investment position (IIP) to GDP ratio recorded an improvement in Q3:2022-23 demonstrating external sector resilience (Chart 64). India’s external debt to GDP ratio stood at 19.1 per cent at end-December 2022 – the same level as on end-September 2022.
Foreign Exchange reserves increased by US$60.2 billion since October 21, 2022 and stood at US$ 584.8 billion on April 07, 2023, sufficient to cover 9.9 months of projected imports for 2022-23 (Chart 65). The Indian rupee (INR) appreciated by 0.4 per cent (m-o-m) vis-à-vis the US dollar in March 2023 and turned out to be among the least volatile major currencies (Chart 66).
The INR appreciated by 0.4 per cent (m-o-m) in terms of the 40-currency real effective exchange rate (REER) index in March 2023 (Chart 67). Payment Systems Digital payments grew across channels in March 2023, led by retail transactions through the Unified Payments Interface (UPI), the Bharat Bill Payment System (BBPS), and the National Automated Clearing House (NACH) (Table 5). In its Statement on Developmental and Regulatory Policies of April 6, 2023 the Reserve Bank proposed to expand the ambit of the UPI by enabling transfer to and from pre-sanctioned credit lines at banks using the UPI, in addition to the deposit accounts. This measure will facilitate payments financed by bank credit. The National Payments Corporation of India (NPCI) has allowed the Prepaid Payment Instruments (PPI) wallets to be part of the interoperable UPI ecosystem with interchange charges for PPI merchant transactions above ₹2,000 to promote the interoperability of the UPI, and foster healthy competition in the ecosystem.21 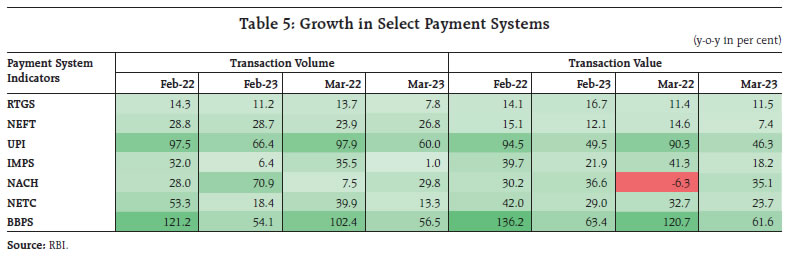 The Bank signed a Memorandum of Understanding with the Central Bank of the United Arab Emirates (CBUAE) to boost collaboration in the areas of FinTech and interoperability between the respective countries’ digital currencies. To cater to emerging technological and cybersecurity-related research and capacity-building requirements, the foundation stone was laid for the establishment of a Greenfield Data Centre and Enterprise Computing and Cybersecurity Training Institute of the Reserve Bank at Bhubaneshwar, Odisha. In the real-time payments (RTP)22 segment, India recorded the highest number of transactions23 in 2022 (accounting for 46 per cent of all real-time transactions worldwide), followed by Brazil, China and Thailand. The strong brand identity of the UPI, high merchant acceptance and policy support are the key drivers of this growth.24 The rapid progress in digitalisation is leading to declining cash transactions – cash usage at the Point of Sale (PoS) declined at 27 per cent of PoS transactions value in 2022, down from 71 per cent in 2019. Digital loan repayment (volume and value) through the BBPS has doubled (y-o-y) in the last month, indicative of rapid digitalisation of lending business. E-commerce in India is expected to record a total transaction value of US$ 150 billion in 2026, up from US$ 83 billion in 2022. With an estimated 16 per cent CAGR through 2026, India will outpace the global e-commerce growth (9 per cent).25 V. Conclusion In this setting, the RBI’s MPC met during April 6-8, 2023 and reviewed the macroeconomic and financial outlook. Noting that the inflation trajectory for 2023-24 is likely to be shaped by both domestic and global risks on the upside and the downside, it projected inflation at 5.2 per cent for 2023-24, down from 6.7 per cent in 2022-23 but still elevated. Accordingly, the Committee decided to remain resolutely focused on aligning inflation with the target to rein in the generalisation of price pressures and anchor inflation expectations so that the resilience in domestic economic activity is sustained. While keeping the policy rate unchanged in that meeting and continuing to withdraw accommodation, the MPC maintained ‘readiness to act, should the situation so warrant, to ensure that inflation progressively aligns with the target, while supporting growth.’ Beginning with (i) the modulation of liquidity through variable rate reverse repo auctions in the second half of 2021-22, (ii) the introduction of the standing deposit facility in April 2022 at a rate 40 basis points above the fixed rate reverse repo rate of 3.35 per cent and (iii) a cumulative increase in the policy repo rate of 250 basis points during 2022-23, the weighted average call money rate, the operating target of monetary policy, was lifted by an effective 320 basis points during 2022-23. In response and aided by supply side measures, headline CPI inflation has gradually declined from its peak of 7.8 per cent in April 2022 to 5.7 per cent in March 2023 and is projected to ease further to 5.2 per cent four quarters ahead in January-March 2024 – a reduction of 260 basis points. Monetary policy is at work. Substantial disinflation has been achieved, but the road to be travelled stretches ahead till inflation is at or close to the target of 4 per cent. At this point, the level of the policy rate at 6.5 per cent is 1.25 times the level of inflation four quarters ahead (5.2 per cent in Q4 of 2023-24 as projected by the MPC). This satisfies the Taylor principle which has become a central tenet of monetary policy. It postulates that the nominal interest rate should be raised more than point-for-point when inflation rises. Satisfying the Taylor principle is both necessary and sufficient for stabilising inflation. The Taylor principle is embedded in the celebrated Taylor rule (Taylor, 1993)26. The promontory that monetary policy in India has achieved uptil now provides just enough headroom to weigh the impact of actions taken so far and to strategise the appropriate response should actual inflation prints deviate from the projected path. Concomitantly, we need to evaluate the effects on underlying economic activity as past monetary policy actions work their way through the well-known lags associated with the implementation of monetary policy. In the words of Governor Shri Shaktikanta Das, “Our job is not yet finished and the war against inflation has to continue until we see a durable decline in inflation closer to the target. We stand ready to act appropriately and in time. We are confident that we are on the right track to bring down inflation to the target rate over the medium term.” With the RBI remaining steadfast and committed to this mission, we firmly believe that actual outcomes will eventually reflect the nuanced assessment of the outlook that we provide in the State of the Economy. In time, enduring price and financial stability will strengthen the foundations of the economy and provide a fillip to growth. Central banks the world over that are invested with dual mandates are at a fork in their course. The RBI has taken the road that is less travelled by, balancing and calibrating both actions and pace. Annex 1: Major Takeaways from the RBI’s Enterprise Surveys Key takeaways from the Reserve Bank’s quarterly enterprise surveys27 conducted during Q4:2022-23 are: -
Businesses remain optimistic on sustained improvement in demand conditions. -
Capacity utilisation (CU) and seasonally adjusted CU marginally exceeded the long-term average CU in Q3:2022-23 and the buoyancy is likely to persist (Charts A1 and A2). -
Overall business sentiments have remained strong for services and infrastructure firms; manufacturers expect further normalisation, as reflected in a climbdown from high optimism on production, order books, capacity utilisation and foreign trade (Charts A3 and A4). -
Job landscape in the services and infrastructure sectors are expected to improve sequentially (Chart A5). -
Input cost pressures may be relatively milder with expected moderation in the pace of increase in raw material cost (Charts A6 and A7). -
Senior loan officers expect robust demand for bank loans during the first three quarters of 2023-24 (Chart A8). |
|