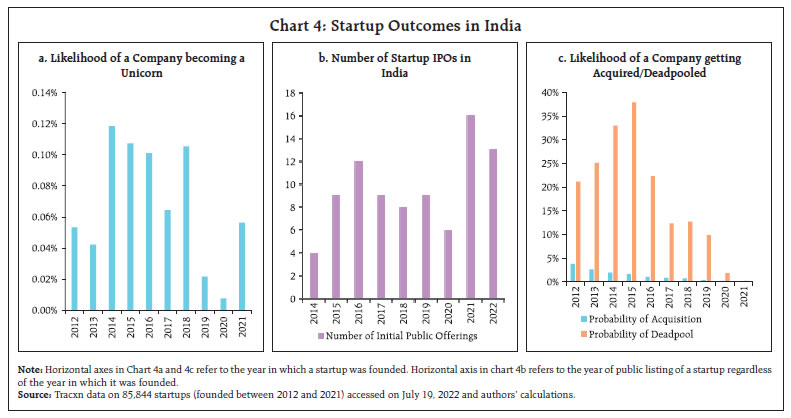
by Rajas Saroy^, Ashish Khobragade^, Rekha Misra^, Sakshi Awasthy^ and Sarat Dhal^ There has been an upward level shift of fundraising by the Indian startups post-2014. This has been contributed to by the Startup India initiative, along with other enabling policies and the increasing digitalisation of the economy. Aggregate startup funding in the long run is driven by the level of domestic economic activity, excess return offered by the domestic equity market over the global benchmark, and movements of the exchange rate. We find that fundraising may be influenced by global financial spillovers through their impact on domestic financial markets. Firm-level analysis reveals that unconventional factors like educational background of founders, pre-existing relationships with institutional investors and popularity matter for fundraising, besides the company size and sector of operation. I. Introduction Over the past decade, startup culture has found its way into various facets of Indian economy in an unprecedented manner. Young companies with young leaders now feature on prime-property billboards, in campus recruitments at premier institutions, and even on jerseys of major sports teams, sharing this space with old established businesses and conglomerates. While innovation, digitalisation and changing tastes and preferences of newer generations are the core reasons behind the rapid emergence of new businesses, adequate capital at the appropriate time has been an important facilitator of the startup ecosystem. Policy reforms over the past decade have acted as vital enablers for Indian startups and recent events have shown that funding and valuation of startups are closely linked to developments in the global economy. In this context, this article provides an analytical narrative on startup fundraising over the past decade, using a proprietary database. The remainder of the article is presented in five sections comprising (i) a birds-eye view of the startup ecosystem, (ii) the performance of India’s startups measured by the time taken to secure funding and the final stages reached, (iii) the startup fundraising process and key themes of the Indian experience in the past decade, (iv) empirical perspectives deriving from micro and macro-level factors that determine the quantum of startup funding, and (v) conclusion and the way forward. II. India’s Startups: A Stocktake II.1 Definition There are 87,988 startups recognised by the Department for Promotion of Industry and Internal Trade (DPIIT)1, making India the third largest startup ecosystem in the world. The DPIIT recognises an entity2 in India, working towards innovation or that has a scalable business model with a high potential for creation of employment and wealth, as a startup up to a period of ten years from the date of incorporation, if its turnover has not exceeded a hundred crore rupees for any of the financial years (Government of India, 2019). II.2 Diversity in Entrepreneurship The vibrant activity in the startup ecosystem is a manifestation of the country’s young spirit. The average age of startup founders was reported to be 32 (NASSCOM and Zinnov, 2019) with around 14 per cent having at least one female founder (Startup India, 2022). According to the DPIIT, startups have proved to be major employment providers in recent years with more than 7.67 lakh jobs created by 72,993 startups as of 30th June 2022. Startup dynamism is pervasive across sectors including IT services (12 per cent), healthcare and life sciences (9 per cent), education (7 per cent), professional and commercial services (5 per cent) and agriculture (5 per cent) (Press Information Bureau, 2022). II.3 India’s Unicorns A fast-paced expansion has been the defining feature of India’s startup space in the post-pandemic era with 107 unicorns3 as of September 2022, with an aggregate valuation of US$ 341 billion (National Investment Promotion and Facilitation Agency, 2022). Bangalore, Gurgaon, and Mumbai are the top three cities with the highest number of unicorns in India (Chart 2a). FinTech (driven by the regulatory and governmental push to digital payments along with inception of services like digital brokerages, insurance, and robo-advisory services), Software-as-a-Service (by the virtue of India’s historical dominance in providing backend IT support) and e-commerce (due to the lockdown) startups are the most abundant in the unicorn club. 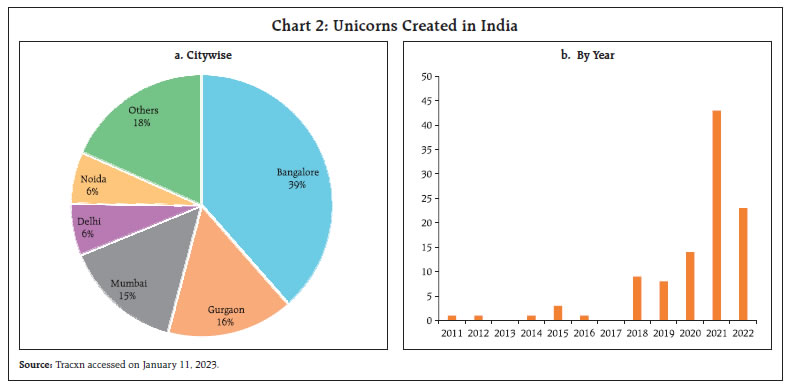 2021 was a crucial year for the unicorn landscape in India (Chart 2b). The average time taken to become a unicorn dropped to 7.8 years from 9.9 years a year ago. (Orios Venture Partners, 2021). Additionally, many of the new entrants to the unicorn club in 2021 were from non-traditional areas (cloud kitchens, gaming, data management and analytics, and content). Rising membership of the unicorn club post-pandemic was driven by the shift to digitalisation that permeated across regions, sectors, and socioeconomic classes and by the abundant liquidity created across the globe by accommodative monetary policy. This led to investors ploughing their money in these emerging businesses for better returns. III. Performance of India’s Startups III.1 Funding Progression Typically, startups go through multiple rounds of fundraising as they progress on developing a viable product. Initially, the founders put in their own capital, as well as that from friends and family, who are collectively called angel investors. Later, they raise money from funds, high net-worth individuals and other businesses in successive pitches or rounds (Seed, Series A, B, C and so on), which broadly follow the growth/scale of the business and serve the needs of the business in that stage. Early rounds may be used to establish a foothold in the market, while later rounds may be used for expansion. Eventually, a situation may arise when a startup no longer needs further external funding support. This generally happens when a startup becomes a listed company or gets acquired/merges with an existing company. An analysis of the median number of months required to rise up funding stages unveils that as a startup moves up these stages, it becomes easier and faster to secure even more funding (Chart 3a). Intriguingly, startups founded recently are able to move up the funding ladder faster, with the median number of months between all stages shrinking drastically between those founded in 2014 and those in 2021 (Charts 3b, c and d). III.2 Startup Outcomes In Capitalism, Socialism and Democracy, Joseph Schumpeter proposed innovation as the driving force of capitalism, describing creative disruption as “the process of industrial mutation that incessantly revolutionises the economic structure from within, incessantly destroying the old one, incessantly creating a new one”. While the hype around startups often impresses upon the “creative” part, the data keep us mindful of the “destruction” as well. For startups founded in India between 2012-2021, we find that the likelihood of a startup turning into a unicorn stands between 0.008 per cent and 0.12 per cent, depending on the year in which it was founded (Chart 4a). While the unicorn badge may be the most desirable outcome for a startup, there are other possible outcomes such as going public, getting acquired or shutting down (deadpooled). The average likelihood of getting acquired (across years) stands at 1.3 per cent, with there being a clear pattern of increasing probability of getting acquired as the startup matures/gets older (Chart 4c). For startups founded in 2015 when almost 14,000 sample startups were founded, the probability of getting deadpooled was 38 per cent. There has been a marked decline in the probability of shutting down shop for startups founded post-2015. The Initial Public Offering (IPO) exit route stays less important in the Indian context; a total of 86 startups have gone public since 2014 (Chart 4b). 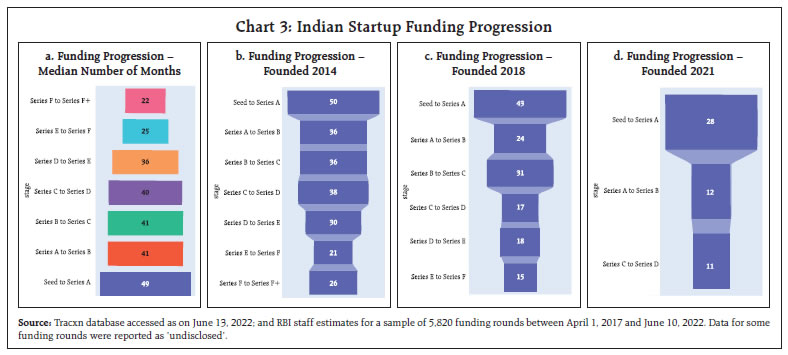
 IV. Fundraising by Indian Startups over the Past Decade For facilitating the discussion on the startup sector as a prominent recipient of private investment, we provide a brief theoretical background on fundraising by startups, and then proceed to the Indian experience over the past decade, with a special focus on the level shift in startup funding witnessed post-2014 (Chart 5). Following the launch of Startup India scheme in 2016, fundraising has witnessed a healthy momentum. IV.1 Venture Capital Financing: Background Ideas are the basis of technology-based services, and instead of fixed capital expenditure such as that on machinery and land, startups providing such services require large investment in human capital and intangible assets to implement and scale their underlying ideas. Intangible assets are difficult to objectively value and liquidate, thus banks may be unwilling to lend to such businesses. Further, such businesses often benefit from network effects - larger the customer base, higher is the value provided by the service (e.g., social media and messaging platforms). 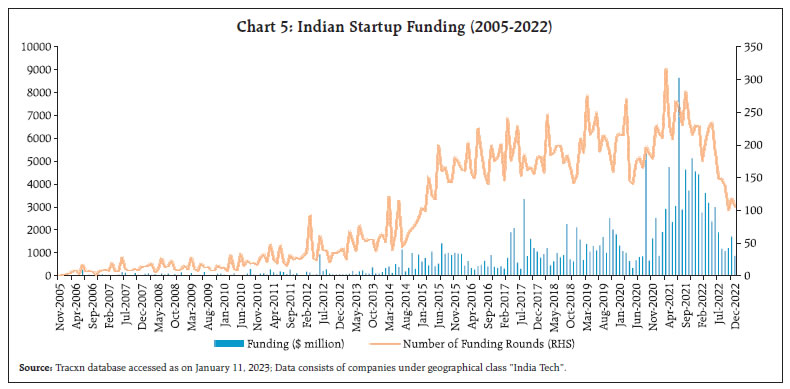 Also, due to the economies of scale, tech-startups may need to scale up rapidly to capture the market, requiring frequent and substantial capital infusions. Additionally, reaching the socially optimal level of provision may require temporary promotional schemes (Rohlfs, 1974) (inter alia, offering services at a low or zero introductory price). However, competition from multiple apps at the same time with near zero switching costs (Schmalensee, 2011) may prolong this period of promotions. Ultimately, this leads to startups not realising revenues for a long while, which filters out financiers with a short investment horizon. Working with these constraints, venture capital (VC) firms have emerged as the most prominent providers of high-risk capital to startups, with other investor types including private equity (PE) firms, corporate venture capital as well as individual investors (angels). VC firms raise a corpus from large institutional investors such as pension funds, insurance funds and university endowments in a staggered fashion. VCs have evolved several strategies to cater to the peculiarities of startup funding (Gompers & Lerner, 2004). First, a long-time horizon of investment allows ample time for investee firms to grow under constant monitoring. Second, funds are disbursed in stages (Angel, Seed, Series A, and so on), allowing periodic oversight and target-achievement-based infusion of additional capital. Third, VCs’ years of experience overseeing the growth of many startups allows them to better evaluate businesses and to appropriately guide investees. Fourth, VCs may appoint their own representatives to reduce information asymmetry between founders and themselves via direct management. To reduce incentive incompatibility, they may use tools such as employee stock ownership plans (ESOPs) to increase employees’ and founders’ skin in the game. Finally, VCs often operate in communities or “circles”. They typically invest in syndication with other investors which leads to portfolio diversification and a reliable second opinion on investment opportunities. However, founders often cede equity and a degree of managerial control to investors, which may lead to conflict of views with respect to the business path, thus negatively affecting the founders’ motivation. The short-term pressure by investors to perform can lead startups to lose sight of their long-term creative vision. IV.2 Fundraising by Indian Startups: The Post-2014 Policy Push According to Arrow (1962), perfectly competitive markets may not optimally allocate resources to innovation due to the presence of uncertainty in risky ventures and thus, require the government or some other organisation not driven by the profit motive, to finance research and invention. While this role has been traditionally addressed by the public funding of higher education and research, the focus now is also on the propagation of innovations through startups to encourage both the viability of ideas (as businesses), as well as the generation of new ideas (through monetary incentives). Additionally, policies that work towards reducing uncertainty associated with innovation and improving the returns from innovation may lead to higher private investment in R&D ventures. The post-2014 period was characterised by a string of business-friendly reforms such as the Make in India (2014) and the Startup India (2016) campaigns. These included measures to enhance ease of doing business and liberalisation of the FDI regime in various sectors. The push to financial inclusion through the JAM Trinity (Jan Dhan, Aadhaar, Mobile) laid the foundation for the enabling architecture of the India-Stack and the subsequent rapid adoption of digital payments. Driven by cheap, fast, and secure movement of value in addition to facilitative regulations, FinTechs blossomed with initial innovations coming from the payment domain. This policy push was the takeoff point for investment activity by large VC and PE funds in e-commerce, consumer-internet, and mobile apps. Other factors that kindled the startup ecosystem in the recent past include an increase in favorable exit options for startups with an increase in the number of mergers and acquisitions (M&A), emergence of options like acqui-hiring4 and tech-acquisitions5, easier fundraising through investor networks, rise in acceptability of the entrepreneurial career (Korreck, 2019), support from a rising number of incubators and accelerators (NASSCOM, 2015), and spill-over effects6 of an expanding set of successful entrepreneurs who went on to become angel investors (Sharma, 2015). The centre and state governments’ efforts in easing interaction with public institutions (by means of online portals, faster clearances and easy certifications), setting up of investor networks, incubators, accelerators, and partnerships with academic institutions and corporates also played a crucial role. In the second half of the decade, successful Indian startups expanded overseas (Bhattacharya, 2018) owing to proven success of their business models domestically and support by foreign investors (NASSCOM, 2018). IV.3 Fundraising by Indian Startups: The COVID-19 Funding Boom Globally, tech-startups grabbed the opportunity to provide digital solutions to the constraints thrown up by social distancing and impeded movement of goods and people. The monetary policy response to the pandemic had led to a surge in liquidity worldwide, including that in venture capital markets (CB Insights, 2021). As a result, a temporary moderation in startup funding (till mid-2020) was followed by a gold rush, with levels of investment that kept increasing till the start of 2022 in both India and abroad (Chart 5 and 6(a)). Investor interest in startups was amplified by the recovery of confidence in a booming post-pandemic digital economy. 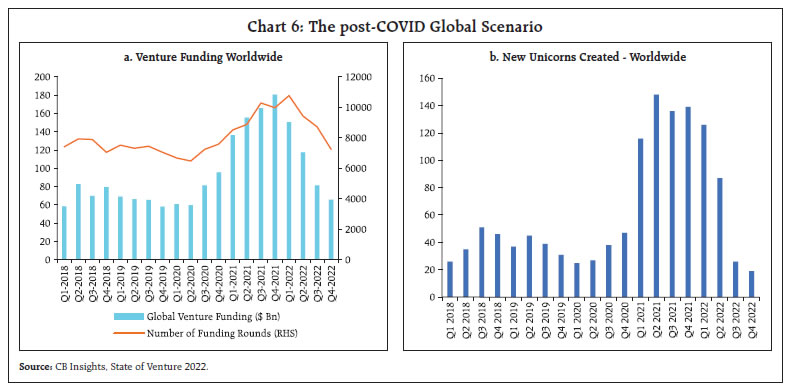 The immediate impact of the first nationwide lockdown and related uncertainty was a fall in revenues across startups, and even shutting down of business. Startups in B2C (business to consumer) segments such as mobility, hospitality and automotive were the hardest hit, and so were early and mid-stage startups (Zinnov India and TiE Delhi-NCR, 2020). Nevertheless, the impact of the pandemic played out asymmetrically in the coming months, creating opportunities in other business models such as e-commerce, food delivery, EdTech, Fintech, Health Tech, and Retail Tech. IV.4 Fundraising by Indian Startups: The post-COVID Era of Mega-Startups Indian tech-startups raised US$ 17.4 billion over 2,531 rounds in 20197. This moderated to around US$ 6.9 billion in 2,303 rounds in 2020- the year that COVID-19 struck. However, US$ 45.4 billion worth of funding over 2,900 rounds in 2021 surpassed the combined funding of the past two years. Notwithstanding the sheer size of funding, it is important to note that this was the year of mega-startups. The share of late-stage (Series C and beyond) startups in total funding and in number of rounds increased compared to the past few years (Chart 7), which is indicative of risk-averse behavior, with investors backing established companies that had proven themselves to be strong enough to weather the pandemic and grow when the economy ramps back up. Additionally, this was the year when India added 48 unicorns, eventually crossing the 100 unicorns tally in 2022 (PIB, 2022). This surge in unicorns is in line with global trends (Chart 6(b)). Further, startups became unicorns at higher average valuations, with the global average valuation at birth rising from US $1.18 billion in 2016 to US $1.56 billion in 2021 (CB Insights, 2021). Also, the average investment per round in India jumped to around US $14 million per round, showing that more money was chasing investment opportunities in startups. Conventional wisdom dictates that availability of easy money may lead to funding of low-quality projects (Gupta, 2000). Besides a general fall in investor discipline during such times due to the ‘fear of missing out’, herding among professional investors driven by reputational risk (Scharfstein, David, & Stein, 1990) may also contribute to the funding of unviable projects. Nonetheless, Nanda & Rhodes-Kropf (2012) find that even though venture capital-backed startups receiving their initial investment in hot markets (such as those witnessed in this phase) are more likely to go bankrupt, such startups also tend to be more innovative (as measured through patenting activity). Therefore, increased capital in hot times may play a crucial role in the Schumpeterian process of creative destruction, by allowing the funding of novel startups and lowering the cost of experimentation. In the Indian scenario, this process may be at work, as evident from the rise in average and median funding amount per round for Early and Mid-stage8 startups in 2021 from US $6 million to US $11.5 million and from US $2 million to US $4.5 million, respectively9. This growth naturally begs the question of sustainability. Pertinent to the COVID-induced funding boom, Gompers and Lerner (2004) note that periods of rapid growth of VC investments generate sufficient difficulties (owing to factors such as inflated valuations and less restrictive partnership agreements) and that periods of retrenchment follow. 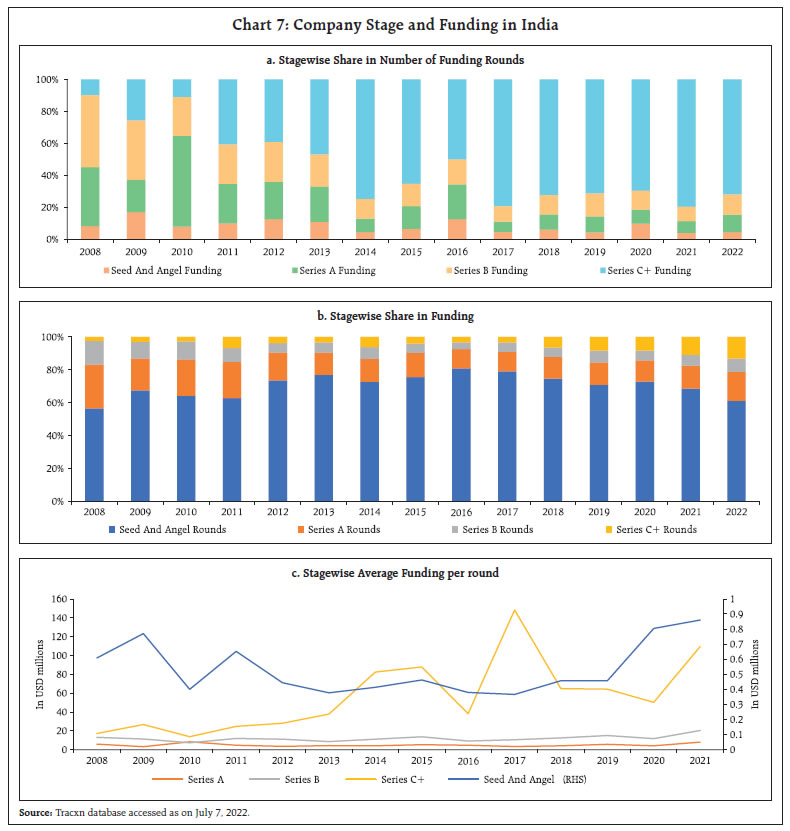 Globally, there was a decline (Q-o-Q) in venture funding by 19 per cent to US $143.9 billion in 2022Q1, after six consecutive quarters of growth (CB Insights, 2022). In 2022Q2, this declined further to US $108.5 billion, marking the second largest quarterly percentage drop in a decade. Despite this decline, funding remains above the 2020 level. Unicorn births in this quarter were also at a five-quarter low of 113, down 15 per cent (Q-o-Q) and declined further to 85 in 2022Q2. Total number of unicorns globally stood at 1,070 as on 2022Q1. A similar correction has followed in India, with startup funding declining to US $2.73 billion in 2022Q3 (Chart 8). V. Drivers of Startup Fundraising In this section, we quantify the forces behind fundraising by startups, from an economy-wide as well as firm-level perspective. V.1 Long Term Behaviour of Startup Funding We identify the underlying drivers of aggregate funding (Chart 5) into Indian startups over a longer period by estimating Autoregressive Distributed Lag (ARDL) models over quarterly data between 2011Q1 and 2022Q2 (Annex I). While our choice of sample avoids distortions caused by the global financial crisis, all specifications include fixed regressors for quarters where COVID-19 cases peaked, and for the post-2014 period of enhanced investor interest in startups. Conceptually, we model startup investment as a portfolio investment competing with investment in equities and debt instruments, with presence of both foreign and domestic investor types. The US is considered as the developed country benchmark. Since some investors might invest in the domestic debt market while others may also have access to overseas debt markets, the risk-free rate of return is taken as the yield on the Indian 3-month Treasury bill for the former (Models 1(a) and 1(b)), and the corresponding US yield for the latter (Models 2(a) and 2(b)). Models 1(b) and 2(b) incorporate the nominal exchange rate as an explanatory variable to better account for international arbitrage. From our long-run specifications, we find that the excess return provided by the Indian stock market (proxied by the NIFTY 500) over the US stock market (proxied by the S&P 500) is a strong determinant of funding into Indian startups. Fundraising is also favourably influenced by the level of GDP (current prices), while it is hampered by the yield on the 91-day Indian and US treasury bills (the risk-free rate of return). Therefore, startup funding displays complementarity with equities but competes with debt. Exchange rate depreciation has a negative impact on funding. The goal of startup investment is the appreciation of the investor’s equity stake, and currency depreciation lowers the sum obtained on exit for foreign investors. The inclusion of exchange rate in the model amplifies the GDP effect, undermines the effect of comparative equities performance and deems the impact of benchmark bond yields statistically insignificant. Hence, in the open economy case for India, fundamental economic performance remains the main driver of startup investment and is supplemented by well performing equities markets. For robustness, we also include the rate of inflation, the excess return between India and the US on small and mid-cap indices, the federal funds rate, the RBI’s repo rate, and the Economic Policy Uncertainty index (Baker, Bloom, & Davis, 2016) to the models. These variables do not seem to significantly impact the amount of startup funding in the long run. Simply put, our results indicate that startup funding in India is largely determined by GDP (an indicator of market size) and differentials in the rate of return in equity markets. Stock market returns may be perceived by investors generally as the growth potential of firms and of entrepreneurial capacity. Higher the risk-free yield, the less likely are funds to be invested in startup ventures (considered extremely high risk). The results also confirm a marked upward shift in startup funding post-2014, as well as during COVID-19. Our models indicate that while there may not be a direct causal link, US monetary policy may affect Indian startup funding insofar as it influences the Indian and US stock markets. Even so, the Error Correction terms provide evidence of rapid adjustment- 66 to 82 per cent of adjustment to a shock is completed within a quarter. This implies that a deviation from the long run level of startup funding stands fully corrected within two quarters. Hence, startup funding in India is poised to rapidly bounce back after the cessation of policy shocks. V.2 Firm-level Determinants of Startup Funding To explore the determinants of funding for startups at the firm level, a cross-sectional analysis was conducted for a sample of 914 startups10. There is a marked increase in the average funding amount, employee count, news mentions, social media followers and number of institutional investors as we move up the stage of funding (Annex II, Table 3). As expected, the average number of angel investors falls as a startup climbs up the funding ladder. This not only highlights the important role that angel investors play in identifying the potential in startups at early stages, but also draws attention to the phenomenon of late entry of institutional investors. Two indicators of firm-level funding received were considered in two distinct linear models, one for the amount raised in the latest funding round (Annex II, Table 4), and the other as the cumulative fundraising till date (Annex II, Table 5). It is observed that more recent funding deals are on average, bigger in size. Stage of funding, a categorical regressor with categories – Early (Seed), Mid (Series A and B), and Late Stage (Series C and above) companies - was included to control for scale. As expected, mature companies attract a larger amount of funding in the latest round. Our results also show that that employee count may be a signal of the quality and potential for growth of a startup, as highlighted in the literature (Davilla, Foster, & Gupta, 2003).11 Unlike bank financing, startup investors may factor in different kinds of unconventional information into their decision-making process. Both models highlight that the number of news mentions of a startup spike investors’ interest. It is possible that news media fills in the information asymmetry faced by the investors concerning characteristics of a startup. Our analysis also hints at herd behaviour among investors (Section IV.4), as the number of institutional investors positively and significantly influences the funding amount. Therefore, being popular and being in the right company matter for startups looking to raise funds. We also gauge the effects of founder-specific characteristics. Indicator variables for elite colleges were used to account for founders’ place of formal education (whether at least one of the founders is from top educational institutions in India or has studied abroad). Interestingly, founders’ alma mater positively affects the latest funding volumes. This relationship is statistically insignificant for the cumulative funding size, denoting that this factor may have gained prominence only in recent times. Selected sector indicators12 were incorporated in the model. Gaming startups have bagged a higher cumulative funding compared to the average. Startups founded in the year 2020 and 2021 are seen to have an advantage in terms of fundraising. In particular, the post COVID-19 phase witnessed increased investor interest in the Artificial Intelligence in Industrial Applications (AIIA), FinTech, and EdTech sectors. VI. The Way Forward There has been an upward level shift of fundraising by the Indian startups post-2014. This has been contributed to by the Startup India initiative, along with other enabling policies and the increasing digitalisation of the economy. Aggregate startup funding in the long run is driven by the level of domestic economic activity, excess return offered by the domestic equity market over the global benchmark, and movements of the exchange rate. We find that fundraising may be influenced by global financial spillovers through their impact on domestic financial markets. Firm-level analysis reveals that unconventional factors like educational background of founders, pre-existing relationships with institutional investors and popularity matter for fundraising, besides the company size and sector of operation. The steady supply of startup capital in the economy is likely to be determined by the magnitude of fundamental technological innovation in the economy, the presence of liquid and competitive markets for startup investors to sell their holdings (e.g., through IPOs/acquisitions), and the willingness of highly skilled managers and engineers to work in entrepreneurial environments (Gompers and Lerner, 2004). Like any other type of investment, fundraising by startups is driven by several firm/project and investor-specific factors. The presence of good investment opportunities may be spread out over time, which generates short run fluctuations in the quantum of capital provided to startups. Results from the firm-level analysis evince the need to expand the focus of startup-oriented policies. The policy focus may shift to creating an enabling environment for fast growth of startups and to crowd-in funding from private investors. It may be necessary to factor in principles of equity in such policies to give founders who are not from premier institutions a fair chance at securing funding from the market. Given the asymmetric impact of COVID-19 based on the sectors of operation, sector-specific policies like those on electric vehicles, drones, etc., may be the right step forward to guide startup growth in line with national priorities. Economy-wide fundraising by startups is shown to be largely determined by macroeconomic factors. The recent shift towards facilitative policies may have had a demonstrated impact in boosting such investment post-2014 by reducing policy uncertainty and business frictions. However, fundamental factors like economic growth, attractive capital markets and a stable exchange rate ultimately facilitate the availability of startup capital. We expect startup fundraising in India to rapidly rebound from macroeconomic disturbances. While foreign capital and expertise may be important for nurturing of world-class businesses in the country, concerns about macroeconomic and financial stability may arise due to their rapid integration into global supply chains and finance. It will be pertinent to keep track of such foreign financial flows and the resultant changes in firm control. However, it is also seen that some domestic investors set up offshore funds in low tax jurisdictions to benefit from bilateral tax arrangements, and then invest in startups. Further development of the International Financial Services Centre (IFSC) at GIFT city may help in onshoring of such investments and increase transparency. Besides onshoring, other avenues may be explored to finance startups domestically, especially those in critical/strategic sectors like defence, health, biotechnology, etc. References Arrow, K. (1962). Economic Welfare and the Allocation of Resources for Invention. In N. B. Research, The Rate and Direction of Inventive Activity: Economic and Social Factors. Baker, S., Bloom, N., & Davis, S. (2016). Measuring Economic Policy Uncertainty. The Quarterly Journal of Economics, 131(4). Bhattacharya, A. (2018, Decemeber 20). 2018 was the Year India’s Startup Decided to Go Global. Quartz. CB Insights. (2021, 9 14). Research Briefs - Unicorns Are Seeing Valuations Take Off. CB Insights. (2022). State of Venture - Global Q3 2022. Davilla, A., Foster, G., & Gupta, M. (2003). Venture Capital Financing and the Growth of Startup Firms. Journal of Business Venturing, 689-708. Gompers, P., & Lerner, J. (2004). The Venture Capital Cycle (2 ed.). MIT Press. Government of India. (2019, February 19). NOTIFICATION G.S.R. 127(E). The Gazette of India. Government of India. (2022, July 20). Unstarred Question No. 513, Part C. Gupta, U. (2000). Done Deals: Venture Capitalists Tell Their Stories . Harvard Business School Press. Korreck, S. (2019). The Indian Startup Ecosystem: Drivers, Challengs and Pillars of Support. Observer Research Foundation Occassional Paper No. 210. Miller, P., & Kirsten, B. (2011). The Startup Factories - The ise of Accelerator Programmes to Support New Technology Ventures. Nesta Discussion Paper. Nanda, R., & Rhodes-Kropf, M. (2012). Investment Cycles and Startup Innovation. NASSCOM. (2015). Startup India - Momentous Rise of the Indian Startup Ecosystem. NASSCOM. (2018). Indian Tech Startup Ecosystem: Approaching Escape Velocity. NASSCOM and Zinnov. (2019). Indian Tech Startup Ecosystem - Leading in the 20s. National Investment Promotion and Facilitation Agency. (2022). Retrieved on November 9, 2022 from https://www.investindia.gov.in/startup-india-hub Orios Venture Partners. (2021). The Indian Tech Unicorn Report 2021. Press Information Bureau (2022), Press Release, “India achieves landmark milestone, over 75000 startups recognised so far”, Ministry of Commerce and Industry, August 03. Rohlfs, J. (1974). A Theory of Interdependent Demand for a Communications Service. The Bell Journal of Economics and Management Science, 5(1), 16-37. Scharfstein, David, S., & Stein, J. C. (1990). Herd Behaviour and Investment. American Economic Review, 465-479. Schmalensee, R. (2011). Jeffrey Rohlfs’ 1974 Model of Facebook: An Introduction. MIT Sloan Research Papers. Sharma, I. (2015). Indian Angel Network’s investments in startups rise 75% in 2014. Business Standard. Startup India. (2022). Startup India. Retrieved from https://www.startupindia.gov.in/content/sih/en/international/go-to-market-guide/indian-startup-ecosystem.html#1497938440131 Startup India. (2022). States’ and UTs’ Startup Policies. Retrieved from https://www.startupindia.gov.in/content/sih/en/state-startup-policies.html Tracxn. (2022). India Tech Exit Landscape. Retrieved October 2022. Zinnov India and TiE Delhi-NCR. (2020). COVID-19 and Antifragility of Indian Startup Ecosystem.
Annex I: Empirical Analysis- ARDL Model Estimation | Table 1: Unit Root Tests of Variables | | Variable | ADF Test Statistic | Phillips-Perron Test Statistic | | Level Form | | LFUNDINGS | -2.78* | -2.76* | | LYNS | -0.98 | -1.18 | | GR500 | -5.08*** | -2.92* | | INTB3M | -1.76 | -2.04 | | INTB3MUS | -3.808*** | -2.056 | | LEXN | -0.16 | -0.16 | | Difference Form | | D(LFUNDINS) | -6.02*** | -5.82*** | | D(LYNS) | -9.64*** | -9.85*** | | D(GR500) | -4.64*** | -6.59*** | | D(INTB3M) | -7.61*** | -7.65*** | | D(INTB3MUS) | -2.024 | -4.004*** | | D(LEXN) | -6.26*** | -6.31*** | Notes: D: First differences; LFUNDINGS, LYNS: natural log of startup funding and nominal GDP, respectively, seasonally adjusted (X-13-ARIMA); GR500: stock return differential between NIFTY500 (India) and S&P500 (US) Indices; INTB3M, INT3BMUS: Yield on 3-month Treasury Bills for India and US respectively, LEXN: natural log of USD-INR nominal spot exchange rate
***, **, and * denote significance levels at 1%, 5% and 10%, respectively. |
| Table 2a: ARDL Model: Dynamic Regression Coefficients | | Dependent Variable: LFUNDINS; Sample: 2011Q1 2021Q4 | | Variable | Model 1(a) | Model 1(b) | Model 2(a) | Model 2(b) | | Model Type | ARDL(2,0,1,0) | ARDL(2,0,1,1,0) | ARDL(1,0,1,0) | ARDL(1,0,1,0,0) | | LFUNDINS (-1) | 0.369*** | 0.407** | 0.341*** | 0.298*** | | | (0.133) | (0.153) | (0.101) | (0.105) | | LFUNDINS (-2) | -0.191* | -0.224* | | | | | (0.106) | (0.113) | | | | LYNS | 1.440*** | 2.234*** | 1.556*** | 2.428*** | | | (0.362) | (0.444) | (0.377) | (0.467) | | GR500 | 0.003 | -0.138 | -0.048 | -0.314 | | | (0.493) | (0.540) | (0.589) | (0.555) | | GR500(-1) | 1.330*** | 1.312*** | 1.212** | 1.180*** | | | (0.381) | (0.349) | (0.450) | (0.363) | | INTB3M | -0.088** | -0.168*** | | | | | (0.042) | (0.049) | | | | INTB3M(-1) | | 0.127** | | | | | | (0.061) | | | | INTB3MUS | | | -0.019 | -0.087 | | | | | (0.064) | (0.062) | | LEXN | | -1.614** | | -1.912** | | | | (0.669) | | (0.736) | | DUM2014Q^ | 0.460* | 0.499* | 0.314 | 0.506* | | | (0.266) | (0.254) | (0.262) | (0.258) | | COVIDQTR^ | 0.661*** | 0.814*** | 0.780*** | 0.733*** | | | (0.205) | (0.251) | (0.213) | (0.191) | | Intercept | -4.026 | -9.771** | -9.678** | -13.960*** | | | (4.801) | (4.215) | (4.421) | (4.055) | | Post-estimation Tests | | Adjusted R squared | 0.892 | 0.894 | 0.885 | 0.889 | | Akaike Information Criterion | 1.035 | 1.049 | 1.074 | 1.064 | | Schwartz Criterion | 1.400 | 1.496 | 1.398 | 1.429 | | Durbin-Watson Stat. | 1.947 | 2.049 | 1.839 | 1.892 | | Serial Correlation (LM) | 0.046 | 0.283 | 0.417 | 0.780 | | Breusch-Pagan-Godfrey Heteroskedasticity test | 1.046 | 0.654 | 1.208 | 0.953 | | Residual Normality (Jarque-Bera Statistic) | 1.541 | 1.698 | 2.727 | 4.482 | Note: ^Fixed Regressors: DUM2014Q (Indicator of year>2014) and COVIDQTR (Indicator for quarters when COVID-19 caseload peaked in India)
All Models use Newey-West HAC Standard Errors
Lag Selection Criteria: AIC with maximum 2 lags for parsimony |
| Table 2b: ARDL Model Long Run Form and Bounds Test | | Long-run form | | Variable | Model 1(a) | Model 1(b) | Model 2(a) | Model 2(b) | | LYNS | 1.753*** | 2.734*** | 2.362*** | 3.426*** | | | (0.385) | (0.498) | (0.432) | (0.493) | | GR500 | 1.624*** | 1.438*** | 1.766*** | 1.222** | | | (0.499) | (0.503) | (0.647) | (0.562) | | INTB3M | -0.107** | -0.050 | | | | | (0.048) | (0.051) | | | | INTB3MUS | | | -0.028 | -0.122 | | | | | (0.097) | (0.085) | | LEXN | | -1.975** | | -2.670** | | | | (0.818) | | (1.065) | | Bounds Test | | F-statistic | 6.684 | 5.808 | 6.024 | 5.347 | | t-statistic | -4.884 | -4.894 | -4.564 | -4.828 |
| Table 2c: Error Correction Model Regression | | Long-run form | | Variable | Model 1(a) | Model 1(b) | Model 2(a) | Model 2(b) | | Intercept | -4.026*** | -9.771*** | -9.678*** | -13.960*** | | | (0.771) | (1.733) | (1.916) | (2.577) | | D(LFUNDINS(-1)) | 0.191 | 0.224* | | | | | (0.129) | (0.129) | | | | D(GR500) | 0.003 | -0.138 | -0.048 | -0.314 | | | (0.596) | (0.582) | (0.611) | (0.597) | | D(INTB3M) | | -0.168* | | | | | | (0.085) | | | | DUM2014Q | 0.460*** | 0.498*** | 0.314** | 0.506*** | | | (0.155) | (0.159) | (0.146) | (0.161) | | COVIDQTR | 0.661** | 0.814*** | 0.780*** | 0.733*** | | | (0.269) | (0.261) | (0.273) | (0.267) | | CointEq(-1) | -0.821*** | -0.817*** | -0.659*** | -0.709*** | | | (0.152) | (0.143) | (0.129) | (0.130) | | Adjusted R-squared | 0.540 | 0.504 | 0.448 | 0.478 | | Akaike Information Criteria | 0.899 | 0.868 | 0.938 | 0.883 | | Schwarz criterion | 1.142 | 1.152 | 1.140 | 1.085 | | Durbin-Watson stat | 1.947 | 2.049 | 1.839 | 1.892 |
Annex II: Firm-Level OLS Estimation | Table 3: Descriptive Statistics | | Variable | Mean | Std. Dev. | Minimum | Maximum | | Early-Stage Companies | | Total Funding Amount (US $ million) | 2.11 | 2.72 | 0.01 | 30.76 | | Total Employee Count | 74.25 | 208.03 | 1.00 | 3323.00 | | News Mentions | 9.69 | 14.07 | 1.00 | 186.00 | | Social Media Followers | 3625.50 | 22235.41 | 6.00 | 336337.00 | | Number of Institutional Investors | 5.25 | 4.64 | 1.00 | 26.00 | | Number of Angel Investors | 16.89 | 22.07 | 0.00 | 117.00 | | Mid-Stage Companies | | Total Funding Amount (US $ million) | 19.27 | 27.09 | 0.45 | 280.58 | | Total Employee Count | 221.84 | 445.36 | 1.00 | 4559.00 | | News Mentions | 33.19 | 44.38 | 1.00 | 454.00 | | Social Media Followers | 16755.42 | 219413.70 | 10.00 | 4301263.00 | | Number of Institutional Investors | 9.12 | 7.83 | 1.00 | 54.00 | | Number of Angel Investors | 16.53 | 22.83 | 0.00 | 167.00 | | Late-Stage Companies | | Total Funding Amount (US $ million) | 311.45 | 604.77 | 6.98 | 4997.33 | | Total Employee Count | 1283.99 | 3720.15 | 16.00 | 42399.00 | | News Mentions | 210.70 | 502.14 | 3.00 | 4749.00 | | Social Media Followers | 15813.57 | 45598.35 | 9.00 | 463342.00 | | Number of Institutional Investors | 17.59 | 12.98 | 1.00 | 79.00 | | Number of Angel Investors | 13.63 | 18.47 | 0.00 | 142.00 | | Source: Authors’ Calculations based on India Investor Landscape Report 2022. |
| Table 4: Summarised Cross-sectional Regression Outputs – Log of Latest Funding | | Independent Variables | Baseline | Model 2 | Model 3 | Model 4 | Model 5 | Model 6 | Model 7 | Model 8 | Model 9 | | Funding Distance | -0.0563***
(0.0196) | -0.0555***
(0.0196) | -0.0561***
(0.0196) | -0.0566***
(0.0196) | -0.0563***
(0.0196) | -0.0562***
(0.0196) | -0.0561***
(0.0196) | -0.0557***
(0.0196) | -0.0571***
(0.0196) | | Stage of Funding | 1.323***
(0.0826) | 1.320***
(0.0827) | 1.323***
(0.0826) | 1.322***
(0.0826) | 1.323***
(0.0826) | 1.323***
(0.0826) | 1.324***
(0.0827) | 1.322***
(0.0826) | 1.322***
(0.0826) | | Log of Employee Count | 0.207***
(0.0292) | 0.209***
(0.0293) | 0.207***
(0.0292) | 0.206***
(0.0292) | 0.207***
(0.0292) | 0.207***
(0.0292) | 0.206***
(0.0292) | 0.205***
(0.0292) | 0.209***
(0.0293) | | Log of News mentions | 0.241***
(0.0479) | 0.240***
(0.0479) | 0.241***
(0.0479) | 0.241***
(0.0479) | 0.241***
(0.0479) | 0.242***
(0.0479) | 0.241***
(0.0479) | 0.244***
(0.0479) | 0.240***
(0.0479) | | Number of Institutional Investors | 0.0134**
(0.00570) | 0.0136**
(0.00568) | 0.0135**
(0.00572) | 0.0134**
(0.00570) | 0.0134**
(0.00571) | 0.0134**
(0.00570) | 0.0134**
(0.00569) | 0.0131**
(0.00570) | 0.0136**
(0.00571) | | Founded during COVID-19 | 0.915***
(0.170) | 0.928***
(0.171) | 0.917***
(0.172) | 0.910***
(0.171) | 0.914***
(0.170) | 0.915***
(0.170) | 0.910***
(0.170) | 0.919***
(0.170) | 0.911***
(0.169) | | Elite College Indicator^ | 0.217***
(0.0827) | 0.215***
(0.0827) | 0.217***
(0.0827) | 0.217***
(0.0826) | 0.217***
(0.0827) | 0.217***
(0.0827) | 0.218***
(0.0828) | 0.214**
(0.0831) | 0.216***
(0.0826) | | Ex-founder Indicator@ | -0.119
(0.192) | -0.129
(0.192) | -0.120
(0.192) | -0.123
(0.193) | -0.119
(0.193) | -0.118
(0.193) | -0.118
(0.192) | -0.116
(0.192) | -0.117
(0.193) | | Elite College * Ex-founder Interaction | 0.0175
(0.280) | 0.00806
(0.279) | 0.0178
(0.280) | 0.0188
(0.280) | 0.0180
(0.280) | 0.0163
(0.280) | 0.0151
(0.280) | 0.0135
(0.279) | 0.0142
(0.281) | | Artificial Intelligence Industrial Applications Sector Indicator | | 0.257**
(0.119) | | | | | | | | | Gaming Sector Indicator | | | -0.0760
(0.518) | | | | | | | | FinTech Sector Indicator | | | | 0.0387
(0.0967) | | | | | | | Ecommerce Sector Indicator | | | | | 0.0282
(0.125) | | | | | | Health Care Sector Indicator | | | | | | 0.0225
(0.134) | | | | | EdTech Sector Indicator | | | | | | | 0.0762
(0.150) | | | | B2B Indicator | | | | | | | | 0.270
(0.225) | | | Constant | 12.07***
(0.140) | 12.05***
(0.140) | 12.07***
(0.140) | 12.07***
(0.140) | 12.07***
(0.140) | 12.07***
(0.140) | 12.07***
(0.140) | 12.07***
(0.140) | 12.08***
(0.140) | | Observations | 1,478 | 1,478 | 1,478 | 1,478 | 1,478 | 1,478 | 1,478 | 1,478 | 1,478 | | R-squared | 0.534 | 0.535 | 0.534 | 0.534 | 0.534 | 0.534 | 0.534 | 0.535 | 0.536 | Note: All specifications use robust standard errors and pass post-estimation tests for model specification (Ramsey RESET) and multicollinearity (VIF<2).
Asterix indicate level of significance. ***: p<0.01, **: p<0.05, *: p<0.1; Parentheses indicate robust standard errors.
^ At least one of the founders studied at IITs/IIMs/any foreign university.
@ At least one of the founders has previously been a founder of another startup. |
| Table 5: Summarised Cross-sectional Regression Outputs – Log of Cumulative Funding (Contd.) | | Independent Variables | Baseline | Model 2 | Model 3 | Model 4 | Model 5 | Model 6 | Model 7 | Model 8 | Model 9 | | Stage of Funding | 1.454*** | 1.445*** | 1.450*** | 1.439*** | 1.448*** | 1.452*** | 1.452*** | 1.449*** | 1.453*** | | | (0.0628) | (0.0626) | (0.0630) | (0.0632) | (0.0631) | (0.0632) | (0.0634) | (0.0633) | (0.0631) | | Log of Employee Count | 0.182*** | 0.174*** | 0.182*** | 0.189*** | 0.180*** | 0.181*** | 0.184*** | 0.182*** | 0.184*** | | | (0.0244) | (0.0247) | (0.0245) | (0.0242) | (0.0245) | (0.0245) | (0.0246) | (0.0244) | (0.0246) | | Log of News mentions | 0.358*** | 0.370*** | 0.360*** | 0.349*** | 0.355*** | 0.357*** | 0.357*** | 0.357*** | 0.357*** | | | (0.0369) | (0.0369) | (0.0370) | (0.0364) | (0.0368) | (0.0369) | (0.0370) | (0.0368) | (0.0370) | | Log of Social Media followers | 0.00628 | 0.00311 | 0.00665 | 0.0123 | 0.00921 | 0.00748 | 0.00638 | 0.00893 | 0.00585 | | | (0.0184) | (0.0184) | (0.0185) | (0.0176) | (0.0185) | (0.0186) | (0.0185) | (0.0186) | (0.0184) | | Number of Institutional Investors | 0.0321*** | 0.0311*** | 0.0319*** | 0.0301*** | 0.0315*** | 0.0317*** | 0.0322*** | 0.0317*** | 0.0322*** | | | (0.00373) | (0.00361) | (0.00377) | (0.00368) | (0.00376) | (0.00374) | (0.00382) | (0.00373) | (0.00375) | | Founded during COVID-19 period | 0.566*** | 0.529*** | 0.568*** | 0.470** | 0.547*** | 0.567*** | 0.560*** | 0.566*** | 0.576*** | | | (0.183) | (0.183) | (0.183) | (0.183) | (0.185) | (0.183) | (0.182) | (0.183) | (0.173) | | Elite College Indicator | -0.00508 | 0.00320 | -0.00425 | -0.00840 | -0.00457 | 0.000526 | -0.00648 | -0.0126 | -0.00476 | | | (0.0682) | (0.0666) | (0.0682) | (0.0679) | (0.0675) | (0.0683) | (0.0683) | (0.0684) | (0.0685) | | Ex-founder Indicator | -0.102 | -0.0946 | -0.0990 | -0.147 | -0.0938 | -0.102 | -0.104 | -0.0879 | -0.0887 | | | (0.137) | (0.129) | (0.137) | (0.137) | (0.137) | (0.138) | (0.139) | (0.138) | (0.137) | | Elite* Ex-founder Interaction | 0.208 | 0.163 | 0.206 | 0.254 | 0.194 | 0.218 | 0.199 | 0.203 | 0.194 | | | (0.197) | (0.192) | (0.197) | (0.192) | (0.197) | (0.199) | (0.200) | (0.198) | (0.199) | | Artificial Intelligence Industry Applications (AIIA) Sector Indicator | | -0.761*** | | | | | | | | | | | (0.291) | | | | | | | | | AIIA_2020 Interaction Indicator | | -0.139 | | | | | | | | | | | (0.485) | | | | | | | | | AIIA_2021 Interaction Indicator | | 0.802** | | | | | | | | | | | (0.313) | | | | | | | | | AIIA_2022 | | 1.060*** | | | | | | | | | | | (0.356) | | | | | | | | | Gaming Sector Indicator | | | 0.755** | | | | | | | | | | | (0.365) | | | | | | | | Gaming_2021 Interaction Indicator | | | -0.882** | | | | | | | | | | | (0.381) | | | | | | | | Gaming_2022 Interaction Indicator | | | -0.00516 | | | | | | | | | | | (0.376) | | | | | | | | FinTech Sector Indicator | | | | -0.483*** | | | | | | | | | | | (0.151) | | | | | | | Fintech_2020 Interaction Indicator | | | | 0.549** | | | | | | | | | | | (0.218) | | | | | | | Fintech_2021 Interaction Indicator | | | | 0.718*** | | | | | | | | | | | (0.179) | | | | | |
| Table 5: Summarised Cross-sectional Regression Outputs – Log of Cumulative Funding (Concld.) | | Independent Variables | Baseline | Model 2 | Model 3 | Model 4 | Model 5 | Model 6 | Model 7 | Model 8 | Model 9 | | Fintech_2022 Interaction Indicator | | | | 0.788*** | | | | | | | | | | | (0.186) | | | | | | | Ecommerce Sector Indicator | | | | | -0.161 | | | | | | | | | | | (0.174) | | | | | | Ecom_2020 Interaction Indicator | | | | | -0.663 | | | | | | | | | | | (0.461) | | | | | | Ecom_2021 Interaction Indicator | | | | | 0.288 | | | | | | | | | | | (0.208) | | | | | | Ecom_2022 Interaction Indicator | | | | | 0.315 | | | | | | | | | | | (0.249) | | | | | | Health Care Sector Indicator | | | | | | -0.103 | | | | | | | | | | | (0.184) | | | | | Healthcare_2020 Interaction Indicator | | | | | | 0.0960 | | | | | | | | | | | (0.233) | | | | | Healthcare_2021 Interaction Indicator | | | | | | 0.136 | | | | | | | | | | | (0.221) | | | | | Healthcare_2022 Interaction Indicator | | | | | | 0.556** | | | | | | | | | | | (0.219) | | | | | EdTech Se | | | | | | | -0.679*** | | | | | | | | | | | (0.198) | | | | EdTech_2020 Interaction Indicator | | | | | | | 0.931** | | | | | | | | | | | (0.363) | | | | EdTech_2021 Interaction Indicator | | | | | | | 0.806*** | | | | | | | | | | | (0.254) | | | | EdTech _2022 Interaction Indicator | | | | | | | 0.438 | | | | | | | | | | | (0.279) | | | | B2B_2020 Interaction Indicator | | | | | | | | -0.000296 | | | | | | | | | | | (0.000238) | | | B2B_2021 Interaction Indicator | | | | | | | | 0.964* | | | | | | | | | | | (0.578) | | | B2B_2022 Interaction Indicator | | | | | | | | 0.864 | | | | | | | | | | | (0.528) | | | Constant | -1.300*** | -1.242*** | -1.309*** | -1.318*** | -1.285*** | -1.304*** | -1.303*** | -1.303*** | -1.297*** | | | (0.127) | (0.128) | (0.128) | (0.124) | (0.127) | (0.130) | (0.127) | (0.127) | (0.127) | | Observations | 914 | 914 | 914 | 914 | 914 | 914 | 914 | 914 | 914 | | R-squared | 0.811 | 0.816 | 0.811 | 0.815 | 0.813 | 0.811 | 0.812 | 0.812 | 0.811 |
|