by Anupam Prakash^, Kaustav K. Sarkar^
and Amit Kumar^ The adverse effects of economic growth on environmental sustainability have come into focus particularly in the post-COVID period. Considering limitations of GDP- based growth accounting in capturing the impact of climate change, the significance of Green GDP which adjusts for environmental deterioration and waning natural resources into estimates of national income accounts, has grown manifold. Using variables on sustainable development indicators and resource consumption indicators, this article attempts to provide estimates of Green GDP for India. The trajectory of Green GDP for India displays an upward movement with visible improvements since 2012. Introduction Climate change presents one of the greatest challenges of our times. Increasing frequency of natural disasters such as, unseasonal rain and floods, droughts, storms, cyclones, tsunami, earthquake, landslides; escalating trend in global warming, rising temperature anomalies1 and intensifying level of pollution are some of the climate changes related phenomenon posing grave threat to lives and livelihoods. Climate change has also contributed to spread of some infectious diseases – both waterborne diseases (such as, Vibrio parahaemolyticus which causes vomiting and diarrhoea), and mosquito-borne diseases (such as, malaria and dengue fever). It has been found that people who are exposed to more air pollution and reside in areas with worse air quality, are more likely to get severe lung infections due to COVID infections (Wu et al., 2020). In an analysis of 3,080 counties in the US, the study concluded that higher levels of PM2.52 were associated with higher death rates from the disease of COVID-19. It is also generally understood that adverse impact of climate change will be more significant on less affluent and underprivileged countries of the globe, i.e., the Global South. India ranked fifth in the Global Climate Risk Index 2020 – making it one of the climate vulnerable countries around the globe3 (Eckstein et al., 2019). This is mainly because of its extensive coastline, high proportion of fossil fuels in the production system, and reliance of significant size of the population on monsoon-dependent agriculture. According to a World Bank estimate4, “if not tamed, climate change may diminish India’s GDP by nearly 3 per cent and unfavorably disturb the living standards of nearly half the country’s population by 2050.” For an emerging market economy (EME) like India, it becomes all the more crucial that sustainable development goals alongside the total output targets for the economy are met successfully. According to the Intergovernmental Panel on Climate Change (IPCC) Special Report, 2018: “an increase in global average surface temperature above 1.5° Celsius is predicted to cause more frequent and intense climate and weather extremes, such as floods, droughts, heat waves, along with other effects, such as sea-level rise”. By the end of UN Climate Change Conference of the Parties (COP26) Glasgow summit held in November 2021, 151 countries had submitted new climate plans (known as nationally determined contributions, or NDCs) to bring down their emissions by 2030. To keep the goal of limiting temperature rise to 1.5°C within reach by the end of this decade, the countries would need to cut global emissions by 55 per cent (UNEP, 2021)5. On August 4, 2022, India updated its NDCs to be communicated to the United Nations Framework Convention on Climate Change (UNFCCC) to reduce the emissions intensity of its economy by 45 per cent by 2030 and reach net-zero by 20706. In view of the NDCs, it is important that India gets into regular monitoring of its progress in management of environmental and operational costs related to natural resources. In case of India, however, there are limited studies which have attempted to provide valuation estimation for environmental accounting. Also, the environmental-economic accounting in India is limited to physical quantities. Therefore, the scope of comparison and assessment of different environmental cost gets very much limited. This article aims to fill this gap through an initial estimate of Green gross domestic product (GDP) for India, based on internationally accepted accounting framework provided by the System of Environmental and Economic Accounting (SEEA), by organising and presenting statistics on environment for India for variables like CO2 emission, particulate damage, resource depletion, from established global data sources like, the World Bank and the BRICS. Due to unavailability of data on environmental indicators from any Indian database, this is the best first cut estimation possible at this stage. Using our estimate of Green GDP, we try to understand how India has progressed over the years in management of its growth aspirations vis-à-vis environmental degradation. The paper is structured as follows. Section II briefly reviews the relation between environmental pollution and GDP of an economy – the Environmental Kuznets Curve (EKC), in particular. Section III reviews methodologies used for estimations of Green GDP and material footprint. Section IV focuses on the estimation of Green GDP for India and the trajectory in India. Using variables on sustainable development indicators and resource consumption indicators, this article attempts to provide an estimate of Green GDP for India also adding expenditure towards environmental protection. Section V concludes with future roadmap for data dissemination on environmental indicators and potential areas of research. II. Review of the Literature Though the economic and social challenges posed by the COVID pandemic related lockdowns and restrictions were severe, it impacted environment positively particularly in the context of air quality due to reduction in concentrations of PM, NO2 and CO across the major cities of the globe. Post-COVID, in China, Italy, France and Spain, there were about 20-30 per cent reduction in NO2 emission, while almost 30 per cent reduction in NO2 emission were observed in the US (Bhat et al., 2021). Gene M. Grossman and Alan Krueger used the concept given by Simon Kuznets to postulate the concept of EKC7 explaining the systematic relationship between environmental degradation and economic growth. Practically, EKC reflects the trajectory of pollution witnessed in a country as part of the process of economic development (Chart 1). The EKC argues that in the initial phases of economic development, there seems to be a positive relationship between pollution level and per capita income. Beyond a certain threshold of per capita GDP, however, economic growth allows for environmental remediation, thus leading to decline in pollution (Stern, 2018). This relationship is reflected by a bell-shaped curve that relates economic growth to environmental degradation. 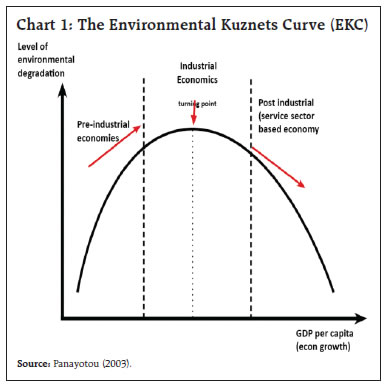 The findings of EKC were upheld, especially in the countries from the Global North, to justify their contribution in environmental pollution. Recent research provides evidence that environmental pollution continues to rise with economic development (Maneejuk et al., 2020). It has also been found that there is no solitary EKC relationship that explains all pollutants across places and across time. The EKC relations appear most credible for local air pollutants such as sulphur dioxide, oxides of nitrogen and particulate matter. On the contrary, there is little evidence to back the EKC hypothesis for gases such as carbon dioxide – the most harmful substance for the global climate. The EKC evidence for water pollution is also mixed, and rather inconclusive (Stern, 2004). In the backdrop of the EKC being questioned, the adverse effects of economic growth on environmental sustainability have come into focus particularly in the post-COVID period. There is increasing consensus regarding the world getting warmer and the earth’s surface temperature rising more rapidly since the industrial revolution (Chart 2). According to an analysis by National Aeronautics and Space Administration (NASA)’s Goddard Institute for Space Studies (GISS), “the mean temperature of Earth has risen by around 1° Celsius (2° Fahrenheit) since 1880. Two-thirds of the warming has happened since 1975, at a rate of around 0.15-0.20°C every decade”. 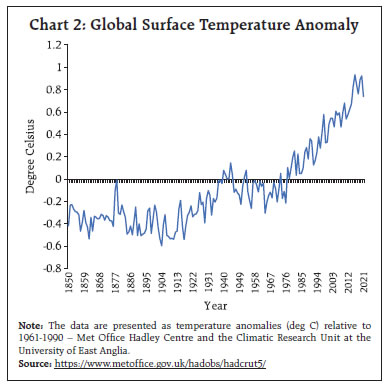 Over the years, the research around environmental accounting has evolved. Considering limitations of GDP-based growth accounting in capturing the impact of climate change, the significance of Green GDP which adjusts for environmental deterioration and waning natural resources into estimates of national income accounts, has grown manifold. Further research focused on alternative measures of growth accounting to capture not only economic performance but also social and environmental performance. In 1993, the draft version of the SEEA was published by the United Nations: ‘The SEEA framework is the accepted international standard for environmental-economic accounting, providing a framework for organising and presenting statistics on the environment and its relationship with the economy’8. It helps to integrate economic and environmental information in the internationally settled standards. The current economic discussions are heavily tilted towards balance between the social and economic performance and somewhat neglecting their interactions with the environmental performance. At present, the growth accounting is mainly focused on economic performance (growth rate, fiscal deficit as a percentage of GDP, government debt as a per cent of GDP, tax revenue as a per cent of GDP, etc.) and social performance (poverty, inequality, level of employment, nutrition level of population, etc.). On other hand, the focus on impact of growth on environment and ecosystem services is still not considered while accounting for growth in GDP. Some other measures of economic well-being to estimate national income mainly use GDP as the base and then make adjustments based on specific variables. Some of these indices are – Index of Sustainable Economic Welfare, the Genuine Progress Indicator, Green GDPs, and Genuine Wealth. On the other hand, there are some indices those do not use GDP as foundation but measure environmental activities, social well-being, improvement in social-environmental and human capital formation – to arrive at some estimation of the environmental and economic well-being. Some of those indices are Ecological Footprint, Subjective Well-Being, Gross National Happiness, etc. III. Estimating Green Growth and Material Footprint: Methodology There is a budding debate emerging on ‘green growth’ – making growth processes more resource-efficient, cleaner and more resilient. Green growth, or environmentally sustainable economic growth – is defined as “the strategy of sustaining economic growth and job creation necessary to reduce poverty in the face of worsening resource constraints and climate crisis.”9 Green GDP takes into account estimates for environmental degradation, depletion of natural resources, and savings of resources and environment into the national income accounts. Several countries viz., Australia, Canada, China, Costa Rica, Indonesia, Japan, Mexico, Papua New Guinea, the US etc. have already started working on developing Green GDP. Motivated by the SEEA, several researchers have undertaken studies on how to measure Green GDP and what elements should form part of Green GDP estimation (Table 1). A general idea of Green GDP calculation involves subtraction of carbon emission cost, opportunity cost of waste generated, and adjusted savings of natural resource depletion from GDP (Stjepanović, Tomic and Skare, 2017). To put it in a more general form, Green GDP estimation covers environmental pollution costs and resource depletion costs (Wang, F., Wang, R. and Wang, J, 2020). Furthermore, the Green GDP estimation was improved by including not only cost incurred on environment and resource depletion but also savings of resources and environment (Qi, Huang and Ji, 2021). In this paper, we have adapted the most comprehensive methodology of Green GDP estimation following Qi et al., 2021, which includes environmental pollution cost, resource depletion cost and savings of resources and environment. Resource use is also an important indicator to understand green growth. Lesser usage of natural resources may indicate an increase in the green growth. Based on the available data, we have tried to provide an estimate for resource use in India on fossil fuels, biomass and metal ores. | Table 1: Select Literature on Methodology of Green GDP | | S. No. | Research Articles | Methodology Employed | Description of Variables | | 1. | Stjepanović, Tomic and Skare (2017) | Green GDP = GDP - (KtCO2* PCDM) - (Twaste* 74 kWh* Pelect) - ((GNI/100) * %NRD) | -
“GDP: Traditional GDP -
KtCO2: Carbon dioxide emissions in kilo tonnes -
PCDM: The average volume-weighted price for carbon (in PPP) -
Twaste: Total (commercial and industrial) waste (expressed in tonnes) -
Pelect: Price for 1 kilowatt-hour is calculated as a mean of commercial and industrial price for each country. -
NRD: Adjusted savings of natural resource depletion as a percentage of the GNI. -
GNI: Gross National Income.” | | 2. | Wang, F., Wang, R. and Wang, J (2020) | Green GDP = GDP - (Environmental pollution cost (EPC) + Resource depletion cost (RDC)) EPC: -
Air Pollution -
Wastewater pollution -
Solid waste pollution RDC: -
Fossil energy depletion -
Water resource depletion | Air pollution: -
“Carbon emission pollution (amount of carbon emission*conversion factor) -
SO2 emission pollution (amount of SO2 emission*shadow price10) -
Wastewater pollution (amount of wastewater discharge*governance cost) Solid waste pollution Fossil energy depletion (amount of fossil energy consumption*shadow price)
Water resources depletion (amount of water consumption*unit volume price)” | | 3 | Qi, Huang and Ji (2021) | Green GDP = GDP- Cost of resources-Cost of environment + Savings of resources and environment | Natural resource depletion cost: -
“Cultivated land depletion value -
Forest resource depletion value -
Water resource depletion value -
Energy consumption value -
Mineral resource depletion value Environmental quality degradation cost: -
Air pollution -
Water pollution -
Solid waste pollution -
Natural disaster loss Resource and environment improvement benefits: - Garden green space benefits”
| The Brundtland Commission, 1987 has defined Sustainable Development as “Meeting the needs of the present generation without compromising the ability of future generations to meet their own needs”. As per this definition, resource conservation becomes basic strand of sustainable development. In this section, therefore, apart from total domestic consumption per unit of GDP (kilograms per constant 2010 US dollars), different categories of consumption such as, fossil fuels, metals, non-metallic minerals, etc. have been considered. The global material footprint10, GDP and greenhouse gas (GHG) emissions have amplified quickly over time and remain strongly correlated (Chart 3). Thus, it may be mentioned that growth has not been dissociated from resource consumption and environmental burdens. 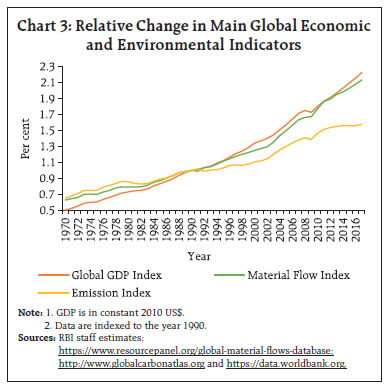 According to the United Nations Statistics, about 8.75 metric tons of natural resources were used to cater to an individual’s needs (per capita material footprint) in 2000. In 2017, global per capita material footprint increased to 12.18 metric tons – a rise of 39 per cent. High-income countries have the dubious distinction of using the maximum material footprint per capita (approximately 26 metric tons per person in 2017), 55 per cent more than the upper-middle-income countries (17 metric tons per person in the same year) and more than 13 times the level of low-income countries (2 metric tons per person in 2017) (Chart 4). These observations (in clear contrast to what EKC postulates) called for a relook into the existing global growth process, and the necessary course correction. IV. Estimation of Green Growth in India Environmental Economic Accounting in India Established in 2003, one of the earlier initiatives in India in relation to accounting of natural resources is the Green Indian States Trust (GIST). The GIST started a project - Green Accounting for Indian States & Union Territories Project (GAISP) to build a framework for environmentally adjusted national income accounts. The GAISP aimed to arrive at annual estimates of adjusted state national income. The first phase of the project produced eight reports, covering estimates for forest and forest products in India, agricultural cropland, sub-soil assets, ecotourism, freshwater resources, etc. All those reports provided comprehensive and details accounting methodology and estimation of India’s natural resources. A study attempted to value ecosystem services at the Corbett Tiger Reserve in terms of willingness to pay for wildlife recreational services (Badola et al., 2010). In similar line, another project by the Indian Institute of Forest Management (IIFM) provided economic valuation of six major tiger reserves in India: Corbett, Kanha, Kaziranga, Periyar, Ranthambore and Sundarbans. The report calculated the benefits from ecosystem services (in terms of area) at a range of ₹50,000 to ₹1,90,000 per hectare in a year. It was also observed that a large segment of the benefits of these reserves were intangibles and thus were unaccounted for (Verma et al., 2015). In the recent years, the Natural Capital Accounting and Valuation of Ecosystem Services (NCAVES) project was launched in 2017 by the United Nations (UN) and the European Union to enhance knowledge and accounting process for ecosystem accounting as per the SEEA framework. The project initially started in five countries - Brazil, China, India, Mexico and South Africa. The countries were chosen on account of the importance of the natural capital in these countries, the presence of diversity of ecology and biodiversity and the commitments of these countries to the Convention on Biological Diversity (CBD). The Ministry of Statistics and Programme Implementation (MOSPI) initiated the compilation of environmental accounting under the NCAVES. The primary aim was to provide an estimation of India’s stock and flow of natural assets, as per the SEEA. The accounting estimations include an estimation for land, forest, wetlands, and also the quality of land, soil, water, crop diversity and forest cover. There are data sources and detailed valuation methodologies for ecosystem services viz. crop provisioning, provisioning of timber and non-timber forest products, carbon retention (from forests), nature-based tourism and soil erosion prevention services, being provided by the MOSPI. All these accounting valuations were attempted for some specific years – 2005-06, 2011-12 and 2014-15 (GoI, 2021a). A similar project was carried out by the Directorate of Economics and Statistics (DES), Government of Uttarakhand with collaboration of the Indian Institute of Forest Management (IIFM) in 2018. The project tried to provide a framework for green accounting of land, water, minerals, forests for the state of Uttarakhand to arrive at an estimate of the economic value of the state’s forest resources and its contribution to GDP. The study also provided an outline for Gross Environmental Product (GEP) in line with the international system for collecting relevant data on natural resources and capital of the state (Verma et al., 2018). The accounting framework and methodology prepared by different institutions and committees have been useful in providing a better understanding of the valuation of natural resources, forest and water bodies in India. However, due to the mammoth size of such accounting exercises for a huge country like India, preparation of a macroeconomic data series on valuation of natural capital for India perhaps is yet to materialise. As a result, to get macroeconomic data for India for a longer time period, one has to take recourse to data provided by international institutions like the World Bank, BRICS and Organisation for Economic Co-operation and Development (OECD). As per the World Bank, environmental deterioration in India equals to about US$ 80 billion per year – around 5.7 per cent of GDP (World Bank, 2013). On the basis of existing data, we attempt to understand the trend and trajectory of green growth in India. Currently, the environmental-economic accounting in India is limited to physical quantities (i.e., soil quality change represented in change in production level, wetland loss shown in change in wetland area etc.) and these environmental variables are not converted into economic terms. Therefore, the scope of comparison and assessment of different environmental cost is very much limited. This article aims to fill this gap by giving a comprehensive estimate of Green GDP in the context of India, by valuing different environmental costs. Data and Methodology In order to arrive at Green GDP measurement for India, apart from sustainable development indicators and resource consumption indicators, we have also included expenditure by the government on environment protection. The sustainable development indicators include carbon dioxide damage and particulate emission damage – both as per cent of GNI. The resource consumption indicators include opportunity cost of energy depletion, mineral depletion, and net forest depletion – as a per cent of GNI (constant US$ 2015). We have then converted the values as percentage of GNI into absolute number at constant US$ 2015 prices. These converted values have then been used to arrive at environmental economic accounting of Green GDP. Thus, our general outline of estimation may be given as below: Green GDP = GDP – (Carbon dioxide damage + particulate emission damage) – (Opportunity cost of energy depletion + mineral depletion + net forest depletion) + Expenditure on environmental protection “The Carbon dioxide damage is estimated to be US$ 20 per ton of carbon times the number of tons of carbon emitted11. The particulate emission damage is the damage due to exposure of a country’s population to ambient concentrations of particulates measuring less than 2.5 microns in diameter (PM2.5), ambient ozone pollution, and indoor concentrations of PM2.5 in households cooking with solid fuels. Damages are calculated as foregone labor, income due to premature death12. The net forest depletion is calculated as the product of unit resource rents and the excess of harvest over natural growth13. The energy depletion is the ratio of the value of the stock of energy resources to the remaining reserve lifetime (capped at 25 years)14. It covers coal, crude oil, and natural gas. The mineral depletion is the ratio of the value of the stock of mineral resources to the remaining reserve lifetime (capped at 25 years). It covers tin, gold, lead, zinc, iron, copper, nickel, silver, bauxite, and phosphate.”15 The data for particulate emission damage is available only after 1990 and the data for expenditure on environmental protection data is available for 2007-2020 period. Data for India for all these indicators except, expenditure on environmental protection, have been compiled from the World Development Indicator (WDI) database of the World Bank. Data for expenditure on environmental protection have been collected from the BRICS Joint Statistical Publication series. Finally, Green GDP has been estimated for the period – 1971 to 2019 at constant 2015 price. We compute three measures of Green GDPs- G1, G2 and G3 depending on the availability of data at different point of time. These measures are defined as below: -
G1 = GDP - (Carbon dioxide damage) - (Opportunity cost of energy depletion + mineral depletion + net forest depletion); Data availability: 1971-2019. -
G2 = G1 - particulate emission damage; Data availability: 1990-2019. -
G3 = G2 + Expenditure on environmental protection; Data availability: 2006-2019. Green GDP G3 is the most comprehensive measure at this stage and includes all available information whereas G1 is the least comprehensive. Furthermore, we have computed green GDP ratios GR1, GR2 and GR3 by dividing G1, G2 and G3 by GDP. These ratios will help us analyse the trajectory of green GDP with respect to traditional measure of economic activities i.e., GDP. Result and Discussion Green GDPs based on G1, G2 and G3 follow a rising trend. Green GDP G1 increased from ₹13.2 lakh crore in 1971 to ₹167.7 lakh crore in 2019, Green GDP G2 increased from ₹28.1 lakh crore in 1990 to ₹165.8 lakh crore in 2019, and Green GDP G3 increased from ₹72.1 lakh crore in 2006 to ₹165.9 lakh crore in 2019 (Annex Table 1). Using the envelope approach, Green GDP ratio GR1 for period 1971 to 1989, GR2 for 1990 to 2005, and GR3 for 2006 to 2019, is plotted [Chart 5(a)]. We identify three broad phases based on the trajectory of Green GDP ratio. In first phase of the period 1971-1989, the GR follows mostly a downward trend with occasional improvements in the years 1976, 1977-1980, and 1986 indicating that the growth during this phase entailed an environmental cost. During this period, the focus was more on higher economic growth than on environmental cost in terms of deforestation, resource depletion and damages due to carbon emission. The sudden fall noticed in the years 1989 and 1990 resulted from incorporation of particulate emission damage data. During the second phase (1990-2006) which witnessed the 1992 Earth Summit and Kyoto Protocol16, the Green GDP ratio generally followed an upward trajectory, as India focused on balancing between the objectives of higher economic growth and environmental sustainability, the downward trend witnessed in earlier phase got transformed into a slightly upward trajectory. The third phase (2006-2019) shows the trajectory of Green GDP with all available information. The sharp downturn in year 2007 and subsequent improvement in year 2008 emanate from parallel damages17 from energy and mineral depletions. Thereafter, this phase has seen upward movement with steeper trend than earlier phase.
As per the data available from Frankfurt School - UNEP Centre (2020), new investment in renewable energy in India has increased significantly since 2012. The yearly average investment for the period 2012-2019 has increased to US$ 9.51 billion from US$ 5.78 billion in the period before that (2004-2011) (Chart 6). Resource use (per unit of GDP) has decreased over the years indicating improvement in the resource use efficiency of the Indian economy (Chart 7). Data for resource use indicators have been collected from the UN statistics SDG Country profiles. The data set includes consumption data for fossil fuels, metal ores, crops, crop residue, coal, biomass, non-metallic minerals, and total resource extraction. The data set covers the period from 2000 to 2017 and is denominated in physical quantity. 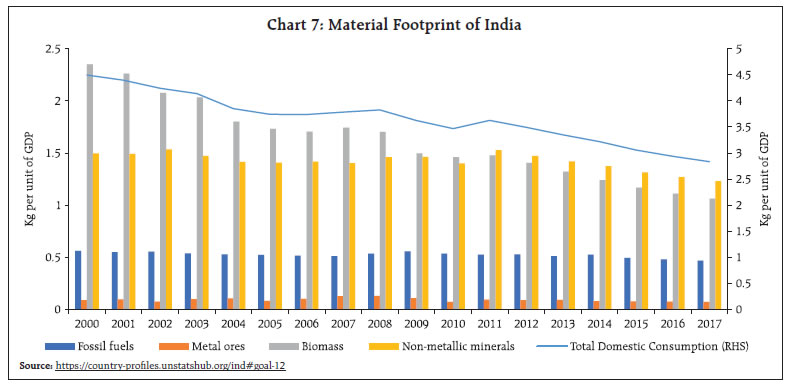 India used lesser amount of resources to produce an additional unit of GDP with passing of each year. The decrease in resource use (from 4.49 kg per unit of GDP in 2000 to 2.83 kg per unit of GDP in 2017) is primarily driven by a decrease in biomass use (grazed biomass, crop and crop residue) and non-metallic minerals. In 2000, the biomass use and non-metallic minerals, which were 2.35 kg per unit of GDP and 1.49 kg per unit of GDP, respectively, have been reduced to 1.06 kg per unit of GDP and 1.23 kg per unit of GDP, respectively, in 2017. This improvement may be attributed to the increased efforts of the policymakers in recycling waste generated from various sources, implementation of property rights to eliminate negative externalities, energy efficiency standards, and technological advances to reduce generation of waste material in production systems across economy. All these steps have not only reduced wastage of resources but also helped recycle resources in one way or the other. Furthermore, India in the recent period, hasdisplayed significant progress in reducing CO2 emission. The CO2 emission decreased to 0.93 kg per unit of GDP in 2018 (US$ at 2015) from 1.12 kg per unit of GDP in 2012 (Chart 8). This trend is expected to continue during the pandemic phase when economic activity slowed down. We believe that progress made in the recent years in terms of green growth in India has been facilitated by several initiatives and effective policies by the government. Green Initiatives- India Till the 1980s, prevention of pollution of natural resources and the environment was mainly done via acts and laws. The “Water (Prevention and Control of Pollution) Act of 1974”, “Air (Prevention and Control of Pollution) Act of 1981”, “National Environmental Tribunal Act of 1995” were the most significant acts in this regard. Apart from formulation of national policies, standards and regulations, the Ministry of Environment and Forests (MOEF), established in 1985, was entrusted with the responsibility of planning, promotion and coordination of all environmental activities. In 1992, the National Policy on Pollution Abatement and the National Conservation Strategy and Policy Statement on Environment and Development were introduced with a view to providing guiding values to the central and state governments. India became a signatory to the “United Nations Convention on Biological Diversity, 1992” in May 1994, and the “Nagoya Protocol on Access to Genetic Resources and the Fair and Equitable Sharing of Benefits Arising from their Utilization 2010” in October 2014. India adopted the “Biological Diversity Act 2002” (BD Act) to enforce steps to protect biodiversity as per the international standards. Furthermore, the Clean Development Mechanism (CDM) initiated in the Kyoto Protocol helped India position better towards climate change. India provided positive indication on accepting the CDM. There was progress in building institutional infrastructure for the CDM – paving ways for substantial number of CDM projects in India (Chopra, 2017). In September 2015, 193 countries including India committed to the Sustainable Development Goals (SDGs) as provided by the UN resolution. India has always demonstrated responsible behaviour as far as climate related international agreement and policies are concerned. At CoP 26 in 2021, it pledged to increase targets for renewable energy deployment and reduction in carbon emissions. Some of the government initiatives like Swachh Bharat Abhiyan (to create mass awareness on cleanliness and environmental pollution, to eliminate open defecation and improve solid waste management) and Namami Gange (significant reduction of pollution, conservation and resuscitation of the river Ganga) are worth mentioning here. During this phase the effective policy initiatives have started providing fruitful results. The total forest cover of India increased to 7,13,789 sq. km. (21.71 per cent of the total geographic area of the country) in 2021 from 6,97,898 sq. km. (21.23 per cent of the total geographic area of the country) in 2013 (GoI, 2021b). The private entities have also started contributing towards environmental sustainability – through initiatives with regard to low carbon emission and promotion of green energy. Green initiatives, less usage of harmful resources (like mercury, lead, etc.) for the production of goods and resource efficiency have become a major part of the corporate social responsibility (CSR). The recent initiatives taken by the government and the simultaneous increasing display of responsibility by the corporate sector is getting reflected in the increase in investment in renewable energy in India. India is progressing well towards attaining the target of 50 per cent non-fossil power generation capacity by 2030, including the build-out of 500 GW of non-fossil sources. Apart from higher share of renewable energy sources, India is also targeting improved energy efficiency through measures like sale of light emitting diodes (LEDs) and compulsory audits for energy intensive firms. India is playing a leadership role through initiatives such as the International Solar Alliance and the Lifestyle for Environment campaign. India has the world’s first fully solar power operated airport (Cochin International Airport) and India’s huge railway system will become net zero in this decade. It is the second largest market in Asia for new solar PV capacity and has allotted US$ 24.3 billion for its solar energy schemes which provide incentives to domestic and international companies to set up battery manufacturing plants. Moreover, as one of the leading oil importers and consumers, India has expedited efforts to double ethanol blending with gasoline to 20 per cent from the current 10 per cent across the country from 2025-26. Furthermore, as a part of the green energy initiative, India has started working towards producing hydrogen fuel and is committed to achieve 5 million tons of green hydrogen per annum by the year 2030 (Reuters, 2022). V. Concluding Observations Given the paucity of relevant data, estimation of Green GDP for India in this paper relies on available global database and provides the starting point for future research in this area of environmental and economic accounting. The trajectory of Green GDP for India displays an upward movement with visible improvements particularly, since 2012. Furthermore, resource depletion, CO2 emission and material footprint, especially in the case of biomass and non-metallic minerals, are showing signs of considerable improvements which further support our findings. Thus, based on the broad observations from our estimation, we can say that India is progressing well so far as green growth is concerned, which if continued should contribute to improvements in general well-being of its population. The unavailability of data related to environmental indicators in case of India is posing a major challenge for engaging in research work in the area and though India has a dedicated Open Government Data (OGD) platform for data dissemination18, but it needs revamping to smoothen its use. In this context, the OECD19 and the Eurostat20 platform can be viewed for further improvements. Further, a dedicated in-house group in the Ministry of Environment, Forest and Climate Change may be formed for (i) providing time-series database required for estimation of Green GDP; (ii) release estimates of Green GDP for India periodically on a regular basis and (iii) user-friendly data dissemination platform on the lines of the OECD and the Eurostat. Despite the recent initiatives and achievements, a lot remains to be done at the ground level going ahead. Better coordination of the flow of power between the state-owned power distribution companies, and the roll out of nationwide charging infrastructure for electric vehicles (EVs) to name a few. The transition to a low carbon and climate friendly economy would require a revamp of financial policy and regulation to ensure adequate finance. Given the importance and urgency of the challenge of climate change, financial policy and regulation need to be redefined to play its required role in the transition to a low-carbon economy (Demekas and Grippa, 2021). In this context, there is an increasing need for the financial system to move towards green financing, keeping in mind the social and development objectives of India (RBI, 2022). References Badola, R., S. A. Hussain, B. K. Mishra, B. Konthoujam, S. Thapliyal, and P.M. Dhakate. 2010. An Assessment of Ecosystem Services of Corbett Tiger Reserve, India. The Environmentalist. 30: 320-329. Bhat, Shakeel Ahmad, Omar Bashir, Muhammad Bilal, Aamir Ishaq, Mehraj U. Din Dar, Rohitashw Kumar, Rouf Ahmad Bhat, and Farooq Sher. 2021. Impact of COVID-related Lockdowns on Environmental and Climate Change Scenarios. Environ Res. Apr; 195: 110839. Chopra, Kanchan. 2017. Development and Environmental Policy in India: The Last Few Decades? Springer: 2017. Demekas, Dimitri G. and Pierpaolo Grippa. 2021. Financial Regulation, Climate Change, and the Transition to a Low-Carbon Economy: A Survey of the Issues. WP/21/296. IMF Working Papers. Eckstein, D, V. Künzel, L. Schäfer and M. Winges. 2019. German Climate Risk Index. German Watch. https://germanwatch.org/sites/germanwatch.org/files/20-2-01e%20Global%20Climate%20Risk%20Index%202020_14.pdf. Frankfurt School-UNEP Centre. 2020. Global Trends in Renewable Energy Investment. FS-UNEP Collaborating Centre. Frankfurt am Main. Government of India (GoI). 2021a. Ecosystem Accounts for India - Report of the NCAVES Project. MoSPI, 2021 Government of India (GoI). 2021b. India State of Forest Report – 2021. Forest Survey of India. Ministry of Environment, Forest and Climate Change, New Delhi. Grossman, Gene M. and Alan Krueger. 1995. Economic Growth and the Environment. The Quarterly Journal of Economics. 110(2): 353-377. International Monetary Fund. 2020. Gross Domestic Product: An Economy’s All. Available at: https://www.imf.org/external/pubs/ft/fandd/basics/gdp.html. Accessed on: March 08, 2022. Kuznets, S. 1955. Economic Growth and Income Inequality. American Economic Review 45: 1–28. Maneejuk, N, S. Ratchakom, P. Maneejuk and W. Yamaka. 2020. Does the Environmental Kuznets Curve Exist? An International Study. Sustainability. 12(21): 1-22. Panayotou, T. 2003. Economic growth and the environment. Paper prepared for and presented at the Spring Seminar of the United Nations Economic Commission for Europe, Geneva, March 3, 2003. Qi, Shanzhong, Zhilei Huang and Lina Ji. 2021. Sustainable Development Based on Green GDP Accounting and Cloud Computing: A Case Study of Zhejiang Province, Scientific Programming. 2021. Doi: https://doi.org/10.1155/2021/7953164 R. Badola, S. A. Hussain, B. K. Mishra, B. Konthoujam, S. Thapliyal, and P.M. Dhakate. 2010. An assessment of ecosystem services of Corbett Tiger Reserve, India. Environmentalist 10, no. 1, 2010. Reserve Bank of India. 2022. Discussion Paper on Climate Risk and Sustainable Finance. Reserve Bank of India. July 27, 2022. Reuters. 2022. India plans to produce 5 mln tonnes of green hydrogen by 2030. February 17, 2022. Available at: https://www.reuters.com/business/energy/india-plans-produce-5-mln-tonnes-green-hydrogen-by-2030-20220217/#:~:text=India%20plans%20to%20manufacture%20five,export%20hub%20for%20the%20fuel. Accessed on: March 07, 2022. Stern N. 2018. Public Economics as if Time Matters: Climate Change and the Dynamics of Policy. Journal of Public Economics. 162: 4-17. Stern, David I. 2004. The Rise and Fall of Environmental Kuznets Curve. World Development. 32(8):1419-1439. Stjepanović, Saša, Daniel Tomic, and Marinko Skare. 2017. A New Approach to Measuring Green GDP: A Cross-Country Analysis. Entrepreneurship and Sustainability Issues. 4(4): 574-590. Verma, M., Verma, D. Negandhi, C. Khanna, A. Edgaonkar, A. David, G. Kadekodi, R. Costanza and R. Singh. 2015. “Economic Valuation of Tiger Reserves in India: A Value+ Approach,” Indian Institute of Forest Management, Bhopal, India (2015): 190 – 195. Verma, Madhu, Advait Edgaonkar, Swapan Mehra, Chandan Khanna, Prabhakar Panda and Kunal Bharat. 2018. Green Accounting of Forest Resources, Framework for Other Natural Resources and Index for Sustainable Environmental Performance for Uttarakhand State and Capacity Building on Environmental Statistics and Green Accounting. Indian Institute of Forest Management and IORA Ecological Services, October 2018.
| Annex Table 1: Estimates of Green GDP for India | | (in ₹ lakh crore) | | Year | G1 | G2 | G3 | | 2019 | 167.752 | 165.839 | 165.860 | | 2018 | 161.347 | 159.466 | 159.489 | | 2017 | 152.176 | 150.410 | 150.434 | | 2016 | 142.312 | 140.573 | 140.578 | | 2015 | 131.275 | 129.547 | 129.555 | | 2014 | 121.131 | 119.460 | 119.465 | | 2013 | 112.477 | 110.819 | 110.823 | | 2012 | 105.719 | 104.130 | 104.134 | | 2011 | 100.049 | 98.563 | 98.568 | | 2010 | 95.477 | 94.093 | 94.099 | | 2009 | 87.909 | 86.605 | 86.609 | | 2008 | 80.131 | 78.890 | 78.893 | | 2007 | 78.918 | 77.731 | 77.735 | | 2006 | 73.228 | 72.083 | 72.087 | | 2005 | 67.916 | 66.783 | | | 2004 | 63.094 | 61.972 | | | 2003 | 58.467 | 57.328 | | | 2002 | 53.981 | 52.835 | | | 2001 | 51.999 | 50.847 | | | 2000 | 49.521 | 48.372 | | | 1999 | 47.965 | 46.821 | | | 1998 | 44.153 | 43.022 | | | 1997 | 41.536 | 40.417 | | | 1996 | 39.947 | 38.858 | | | 1995 | 37.179 | 36.104 | | | 1994 | 34.658 | 33.584 | | | 1993 | 32.336 | 31.259 | | | 1992 | 30.964 | 29.880 | | | 1991 | 29.378 | 28.286 | | | 1990 | 29.216 | 28.107 | | | 1989 | 27.769 | | | | 1988 | 26.403 | | | | 1987 | 24.078 | | | | 1986 | 23.143 | | | | 1985 | 21.944 | | | | 1984 | 20.907 | | | | 1983 | 20.171 | | | | 1982 | 18.786 | | | | 1981 | 18.203 | | | | 1980 | 17.306 | | | | 1979 | 16.146 | | | | 1978 | 17.013 | | | | 1977 | 16.053 | | | | 1976 | 15.103 | | | | 1975 | 14.845 | | | | 1974 | 13.729 | | | | 1973 | 13.586 | | | | 1972 | 13.159 | | | | 1971 | 13.238 | | | Note: Both the GDP and GNI figures are given in constant 2015 US dollar. Green GDPs for India in Rupees is derived by using average USD/INR exchange rate during FY 2015-16.
Source: RBI staff estimates based on World Bank database and BRICS publications. |
|