by Aastha^, Shelja Bhatia^ and
Sangita Misra^ Elevated input price pressures resulting from higher global energy prices, commodity prices and supply chain disruptions could inflate output prices depending on the stage of the business cycle and the pricing power of firms. Understanding the dynamics of pass-through of input prices to retail prices in varying market conditions is critical for an appropriate monetary policy response. Empirical analyses in the article suggest modest pass-through from input prices to output prices in India, with the sensitivity of output prices to input prices found to be non-linear, rising more when incidence of input prices is high. I. Introduction The rise in global inflation since 2021, primarily owing to supply-side factors triggered by the pandemic, got further entrenched due to headwinds from war in Europe. Elevated input price pressures due to higher global energy and commodity prices, amidst persistent global supply chain bottlenecks and strong rebound in demand for goods relative to services, created the breeding ground for accelerated cost-push inflation across the world. Generally, such commodity price shocks would only have a transitory impact on overall inflation. However, a critical factor determining whether the higher input costs are translating to higher headline inflation, which is persistent rather than transitory, is the extent of pass-through of these higher input prices to output prices, generally called the pricing power, leading to the broadening of price pressures over time. There is ample literature to support the state-contingent nature of the firm’s pricing power whereby pass-through is stronger when demand conditions are favourable andvice versa1 (Schnabel, 2022). Well anchored inflation expectations also show significant role in permitting central banks to follow an active monetary policy. Studies have shown an overall decline in the inflation pass-through (short term to long term inflation forecasts), with overall share of countries experiencing anchored inflation expectations increasing over time on account of inflation targeting (Yetman, 2020). In the post-pandemic world, while input costs have risen almost everywhere due to supply chain disruptions, the pattern and extent of its transmission to output prices have varied across nations depending upon the stage of the business cycles and the pricing power of firms. While in advanced economies (AEs) like United States (US), pricing power of firms has increased significantly against intense pressures from elevated input prices and strong demand since 2021 (Vijilder, 2022), other AEs and emerging market economies (EMEs) are either joining the US or have started experiencing such pressures beginning 2022 with increasing signs of sectoral spill overs with extended period of higher input price pressures (Das, 2022). Looking at India, input cost prices as seen from a host of indices have been rising since 2021-22, though their pass-through to output prices have remained muted in view of the continuing slack in demand(RBI, 2022). Resultantly, the gap2 between input and output prices kept widening since mid-2020-21 (Chart 1). In the current year FY2022-23, however, some early signs of pressures on output prices on account of rising input prices are evident from Reserve Banks’ surveys. The broadbased surge in prices of key industrial inputs coupled with global supply chain disruptions due to war in Europe with crude oil prices hovering above US$ 100 per barrel for almost six months during 2022 have further elevated the pass-through risks of the unprecedented input-cost pressures among the processed food, non-food manufactured products and services categories. While input cost push pressures are exhibiting some signs of respite in near term, they continue to remain elevated fraught with uncertainties essentially due to geopolitical factors. It is against this backdrop that it becomes imperative to monitor the dynamics of pass-through of input costs to retail prices as the Indian economy recovers. This is critical to understand the dynamics of supply side inflation to effectively distinguish between initial transitory inflation shock versus second round effects. 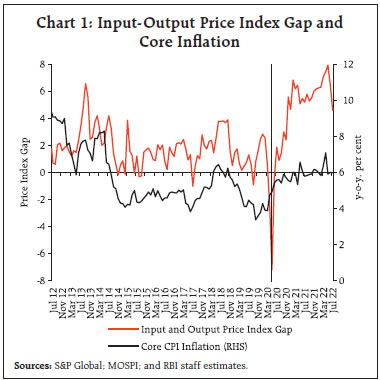 Thus, the primary objective of this article is to analyse and decode the input cost pricing behaviour and supplement existing studies on sensitivity of inflation in India to input cost pressures. The rest of the article is organised as follows: Section II presents a brief review of stylised facts on recent input and output prices based on purchasing managers indices (PMI) for both India and other major AEs and EMEs. Section III presents the empirical framework against the backdrop of a brief literature review on the subject, description of the data and empirical methodology used in the study. Section IV discusses the results, and the last section reports concluding observations. II. Input and Output Price Behaviour Globally, the input-output price gap as witnessedfrom PMI price indices3 varied across economies since the emergence of the COVID-19 pandemic in March 2020. Worldwide input cost pressures intensified amidst large scale supply disruptions and rise in cost of various raw materials. However, with countries witnessing diverse post-COVID growth trajectories, input and output price gaps have followed different trail across economies. The final pass-through of input prices to output prices in most countries is dependent on the domestically driven indicators reshaping their trajectories. In general, AEs have been able to transfer the large increase in input costs to customers with firms protecting their margins to ensure profitability of their business, albeit divergences exist with regard to the extent of pass-through. Countries like Australia, Japan, and some of those in the Eurozone exhibit a rising trend in their input-output price gap in their latest surveys reflecting intense input cost pressures, which are not commensurately compensated through output price hikes (Chart 2a). In contrast, in countries like US, United Kingdom (UK), France and Spain, the rising trend in input-output price gap witnessed during 2020 has either stagnated or has begun its descent sometime around the last year reflecting the pass-through of input costs to consumers (Chart 2b). 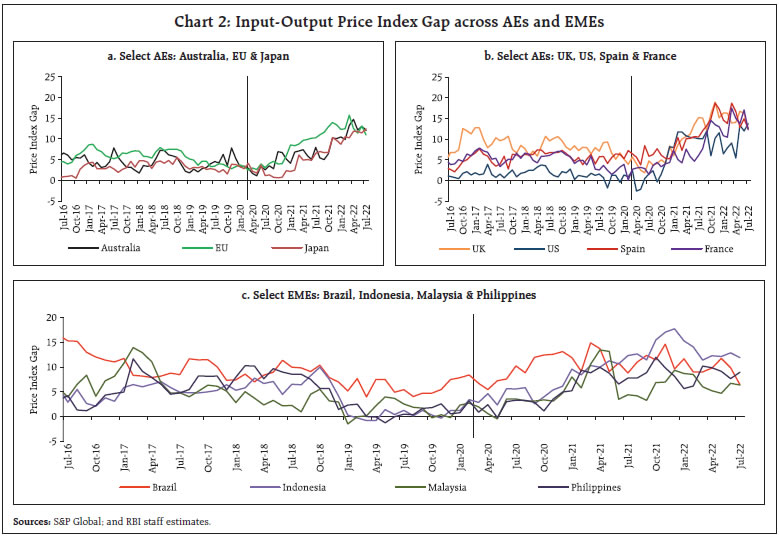 However, for the EMEs the gap between input and output prices after rising through 2020 has remained quite volatile at elevated levels throughout 2021 and 2022 reflecting high overheads and fuel prices with firms succumbing to pass-through pressures intermittently (Chart 2c). India’s input-output price gap although having risen significantly post pandemic, remains moderate in magnitude and volatility when compared with that of AEs and EMEs (Chart 1 earlier). PMI Input and Output Prices: India With the onset of COVID-19 pandemic in March 2020, its impact on Indian economy in April 2020 was seen in an unprecedented contraction in manufacturing output and services. The contraction in services sector was relatively stronger, attributable to the need to maintain social distancing norms and reduced consumer footfall. The sharp contraction led input and output prices to fall considerably with the rate of disinflation being stronger for manufacturing sector than the services sector as evident from PMI indicators (Chart 3a). In the subsequent months, the manufacturing firms passed-on lower input costs to their customers. Similarly, the service providers registered a notable easing in the rate of output price which was outpaced by drop in operating costs. With the relaxation in COVID-norms in ensuing months of August and September, PMI registered broad-based stabilisation in October 2020. Manufacturing sector gained optimism with the relaxation of restrictions and pent-up demand, allowing manufacturers to regain pre-pandemic output levels whereas, the service providers observed weaker growth in their activities with contact-intensive services bearing most of the brunt. 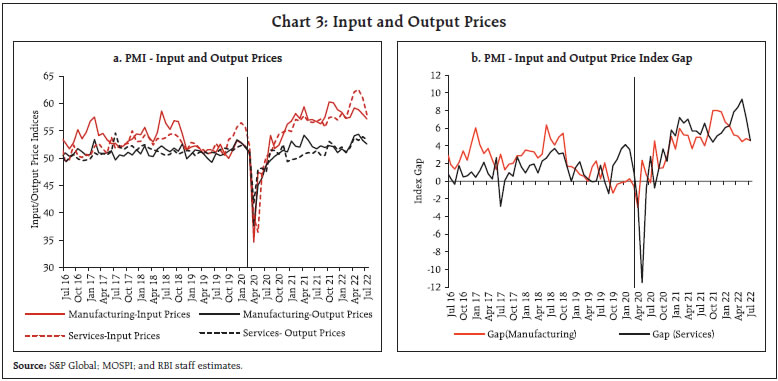 The year 2021 started with manufacturing PMI remaining in expansion territory in the month of January, signalling a sixth consecutive month of improvement in business conditions and, thus moved further away from the COVID-19 related contractions which were recorded around mid-2020 (April-July, 2020). The improving demand environment provided an accommodative space for price hikes and charges to grow at faster pace. In the services sector, input costs witnessed sharpest upsurge due to pick up in fuel prices. However, the prices charged by service providers got reduced as most of the companies offered discounts to beat the competition and stimulate demand conditions. Hence, the overall output charges were broadly unchanged as discounts offered by service providers were offset by the increase in prices among goods producers. With the successive emergence of the second wave of COVID-19 in India, the strains on manufacturing sector got intensified again in the first quarter of FY2021-22. Input costs got exaggerated further due to raw material scarcity pushing prices to go up. Meanwhile, in the services sector the cost-push inflationary pressures eased, but remained elevated compared to their historical standards. However, the selling prices increased slightly as several companies left their fees/charges unchanged to support the subdued demand conditions despite the high input prices and operating expenses. Hence, the pass-through to goods sectors was more than that for the services sectors (Chart 3b). In the terminal months of 2021, the PMI data indicated robust growth for services and manufacturing sector. However, the inflationary cost pressures remained elevated and intense at higher levels amid transportation issues and difficulties to source major raw materials. Hence, passing on of the cost burden to client led to moderate inflation. As production growth picked up considerably in November, private sector output expanded at the fastest pace since January 2021. Hence, not only did the firms saw their expenses picking up further since November 2021, but also to the greatest extent in a decade, with input prices operating at the highest decile for over a year [February 2021-June 2022] (Chart 4a). Future output, an indicator of expected demand conditions and pass-through sentiments, however, remained modest (Chart 4b). Reflecting this, there are some indications of cost burden being partly shared with customers via upward revisions to selling prices, though input-output price gap still persists. 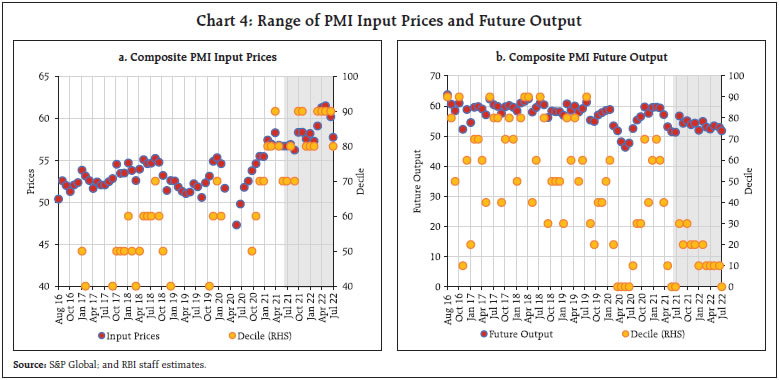 The extent of pass-through of input prices to output prices and, in turn, to headline Consumer Price Index (CPI) inflation is, however, conditioned by a host of cyclical and structural factors that determine the nature of second-round effects. It is generally observed that input price pressures are glaringlyreflected in the core component of the wholesale price indices (WPI)4, though its correlation with core CPI inflation (excluding food and fuel) is rather weak (Chart 5a). Change in input prices impacts core CPI indirectly through change in core WPI, thus, making the impact on core CPI relatively subdued with input price changes (Chart 5b). III. Empirical Analysis Review of Literature The pass-through of input costs to output costs, typically called pricing power, is conventionally considered a critical input in monetary policy making (Ball, 1999). The degree of pass-through is vital for forecasting inflation and pivotal for central banks to decide on the extent of monetary tightening while framing monetary policy in response to elevated inflation. The inflationary environment of the pricing actions of firms is investigated in the literature through two key paradigms namely - Monetary Theory and Theory of Price Setting with Imperfect Competition. Blanchard and Kiyotaki (1987) and Svennson (1986) have shown the importance of imperfect competitive models in price adjustment theories where firms own the market power, whereas the other set of theories includes the importance of changing pattern of pricing power through microeconomic foundations of staggered price setting. Under the staggered price setting models developed by Ball and Cecchetti (1988), the changes in the pricing behaviour of firms could be influenced by inflation persistence expectation or through fluctuations noticed in input costs. The cross-country experience of key AEs like US and Eurozone area shows that pricing power of firms increased significantly during 2021-22 against a background of intense pressure from input prices and strong demand (Vijlder, 2022). In the Indian context, several studies have tried to analyse empirically various aspects of the relationship between input/output prices and the inflation and demand conditions. First, using firm level data, decline in corporate pricing power has been observed since 2009-10 with net impact of pricing power on inflation being subdued, albeit positive (Hait et. al., 2013). Second, PMI price indices are shown to be good indicators and have significant predictive power of the changes in WPI, which served as the headline in the pre-FIT (flexible inflation targeting) period (Khundrakpam and George, 2013)5. Third, wage-price spiral relationship has also been empirically examined in the Indian context. In Indian agricultural sector, evidence supporting price impact of wages through cost-push channel since 2007 is prevalent with labour cost constituting major part of operational cost (Nadhanael, 2012). Moreover, both nominal agricultural and non-agricultural wages are observed to be positively related to prices in the long run although wage-push risks to inflation is found to be weaker relative to inflation induced wage pressures (Kundu, 2019). Lastly, a more recent exercise has shown that the direct pass-through of global commodity prices has a relatively modest impact on CPI as compared to headline WPI (RBI Annual Report,2022)6. On the whole, studies in this area have looked at the issue of pass-through from input to output prices either tangentially or were primarily based on pre-pandemic data, thus enunciating the need to examine the current behaviour in the post-pandemic cost-push regime. Against this backdrop, an attempt is made to examine empirically the sensitivity of the output prices to changes in input prices to gauge the likely pass-through of the current rise in input prices, especially as demand recovery gathers steam. Data The empirical estimation in the study is attempted by using monthly time series data from 2011 to20227. The variables used in our study are as follows: composite PMI input prices as an explanatory variable and PMI output prices as dependent variable. Core CPI (excluding food and fuel) is also used as another dependent variable to examine its relationship with PMI input prices. The model also includes future output (expected) as a control variable for expected demand conditions, in line with literature, along with suitable dummies for the COVID-19 period. Descriptive statistics of the model are given in Table 1 in Annex A. Unit root test for stationarity indicates that at one per cent confidence level PMI input and output prices are stationary, while core CPI index in levels is non-stationary; seasonally adjusted month-on-month core CPI inflation is found to be stationary (Table 2 Annex A). | Table 1: Granger Causality Tests | | Hypothesis | Number of observations | F-Statistic | | Composite Input Prices do not granger cause Composite Output Prices | 197 | 9.17*** | | Composite Output Prices do not granger cause Composite Input Prices | 197 | 0.374 | | Composite Input Prices do not granger cause Core CPI | 135 | 14.67*** | | Core CPI does not granger cause Composite Input Prices | 135 | 1.76 | Notes: 1. *** denotes significance at 1 per cent level of significance.
2. Results are reported for lag 1 of input prices; however, results also hold for higher lags for composite input to output prices, albeit significance reduces for higher lags for composite input to Core CPI (seasonally adjusted, m-o-m).
Source: RBI staff estimates. | As a next step, the causal relationship of input prices as represented by PMI composite input prices is examined vis-à-vis PMI composite output prices and core CPI. Granger causality tests confirm that input prices influence output prices and Core CPI with no evidence of reverse causality (Table 1). IV. Empirical Results The extent of sensitivity of output prices to input prices is examined using standard ordinary least squares (OLS) and quantile regression (QR) analysiscontrolling for expected activity8, which might influence output prices from the demand-side along with input prices from the cost push angle. The OLS regression results suggest that the pass through from PMI composite input prices to corresponding output prices is slow and incomplete, and the long-run pass-through is in the range 0.26 - 0.27 (Table 2). | Table 2: OLS Estimate: Input to Output Prices Dependent Variable: PMI Output Prices | | Independent Variables | Model 1 | Model 2 | | Constant | 30.48*** | 18.26*** | | | (0.00) | (0.00) | | Input Prices (lagged no. of variables=2) | - | 0.10** | | | | (0.03) | | Input Prices (lagged no. of variables=4) | 0.26** | - | | | (0.03) | | | Output Prices (lagged no. of variables=1) | - | 0.48*** | | | | (0.00) | | Future Output | 0.11*** | 0.04 | | | (0.000) | (0.01) | | Dum_April_2020 | -9.65*** | -10.57*** | | | (0.000) | (0.00) | | Adjusted R-squared | 0.73 | 0.81 | Notes: 1. *** and **denotes significance at 1 and 5 per cent levels.
2. Figures in parentheses are p-values.
3. The results are estimated for period: April 2012-June 2022.
Source: RBI staff estimates. | Quantile Regression With an objective to decode non-linear relationship between output prices and input prices that are state dependent, quantile regression is attempted to examine the impact of input prices on output prices at different quantiles. The estimates of quantile regression coefficients for five quantiles (0.2, 0.3, 0.5, 0.7, and 0.8) are given in Table 3. It is observed that the estimated coefficients of the PMI input price as independent variable have the expected positive sign, are statistically significant at the 1 per cent level, and gradually increase from lower to upper quantiles ranging from 0.24 to 0.32. The null hypothesis of the slope coefficients of the estimated model being equal across quantiles isrejected (Chart 4a and Table 4b)9. With PMI input prices operating at the highest decile for a significantly long time period, its pass-through to output prices could be stronger, more so as future output is moving towards its upper decile with growth recovering. Table 3: Quantile Regression Results
Dependent Variable: PMI Output Prices | | Independent Variables | Quantile Regression Estimates | | 0.2 | 0.3 | 0.5 | 0.7 | 0.8 | | C | 34.48*** | 33.74*** | 29.23*** | 26.45*** | 26.32*** | | | (0.00) | (0.00) | (0.00) | (0.00) | (0.00) | | Input Prices | 0.24*** | 0.24*** | 0.30*** | 0.32*** | 0.32*** | | | (0.00) | (0.00) | (0.00) | (0.00) | (0.00) | | Future Output | 0.07** | 0.08** | 0.10** | 0.14*** | 0.14*** | | | (0.01) | (0.01) | (0.02) | (0.00) | (0.00) | | Dum_April_2020 | -5.72*** | -6.10*** | -5.29*** | -5.10*** | -5.43*** | | | (0.00) | (0.00) | (0.00) | (0.00) | (0.00) | Notes: 1. *** and ** denotes significance at 1 and 5 per cent levels.
2. Figures in parentheses are p-values.
3. Quantile regression component: Huber Sandwich Standard Errors & Covariance; Sparsity method: Kernel (Epanechnikov) using residuals; Unique optimal solution identified.
4. The results are estimated for period: April 2012-June 2022.
Source: RBI Staff estimates. | The second objective of this article is to explore the effect of input prices on the core CPI which is a component of headline CPI to identify the relationship between the two. Using quantile regression, it is observed that the impact of PMI input prices on coreCPI10 for the period April 2012-June 2022 is higher at higher quantiles of input prices, although overall impact is modest with pass-through coefficient in the range of 0.02-0.04 (Table 5 and 6). 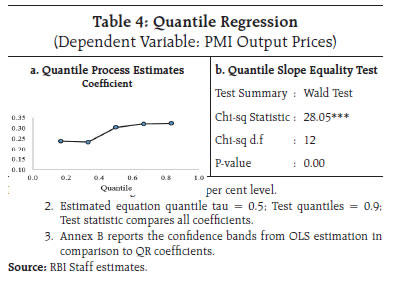
Table 5: Quantile Regression
Dependent Variable: Core CPI (m-o-m) | | Independent Variables | Quantile Regression Estimates | | 0.2 | 0.3 | 0.5 | 0.7 | 0.8 | | C | -0.84 | -1.01 | -1.50** | -1.68** | -0.97 | | | (0.14) | (0.10) | (0.02) | (0.01) | (0.28) | | Input Prices | 0.02** | 0.02** | 0.04*** | 0.04*** | 0.03* | | | (0.05) | (0.03) | (0.00) | (0.00) | (0.06) | | Dum_April2020 | 0.81*** | 0.80*** | 0.88*** | 0.88** | 0.57* | | | (0.00) | (0.00) | (0.00) | (0.00) | (0.06) | Notes: 1. ***, ** and * denotes significance at 1, 5 and 10 per cent levels, respectively.
2. Figures in parentheses are p-values.
3. Quantile regression component: Huber Sandwich Standard Errors & Covariance; Sparsity method: Kernel (Epanechnikov) using residuals; Unique optimal solution identified.
4. The results are estimated for period: April 2012-June 2022.
Source: RBI Staff estimates. | Vector Autoregression (VAR) Analysis To further explore the dynamics of the relationship for both core CPI and headline CPI, we considered bi-variate VAR models of (a) PMI input prices with headline inflation and (b) PMI input prices with core CPI inflation. The focus of this empirical exercise is to compare the response from input prices to CPI headline and core inflation and examine the magnitude and persistence of the impact. For this purpose, we depend on impulse responses of headline and core CPI inflation obtained from VAR estimates (Chart 6). 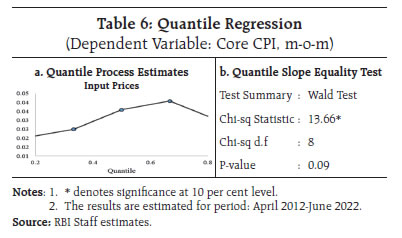
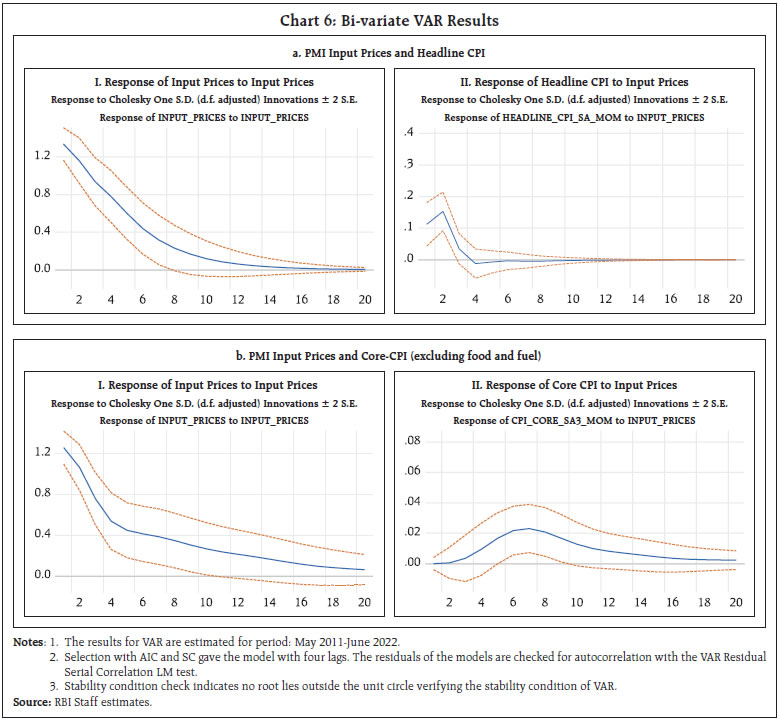 The model is estimated using four lags as suggested by the AIC criteria. For headline CPI, impulse responses indicate that a one standard deviation shock to input prices (which is 1.2 per cent rise) leads to a peak impact of around 15 basis points (m-o-m) on headline inflation with a lag of three months and the impact decays quickly. On the other hand, a broadly similar shock to input prices leads to a more gradual impact on core inflation. The peak impact of around 2 bps occurs after 7 months. The analysis thus suggests a relatively faster and stronger impact of input price shocks on headline inflation and a more inertial and shallower impact on core inflation. V. Conclusion This article decodes the pass-through behaviour from input prices to output prices, which is a key component in assessing second order effects of cost-push pressures. Driven by higher fuel, raw materials, transportation costs and other supply chain related constraints, input prices have seen a broad-based rise with the repeated waves of the pandemic which was further aggravated by war in Europe. With output prices not rising proportionately due to persistent slack in the Indian economy during 2020 and 2021, the gap between input and output prices widened during the pandemic, particularly post the first COVID-19 wave. Empirical results of the paper suggest that pass-through from input to output prices builds over time, with the long run coefficient in the range of 0.26-0.27. Non-linearity in the relationship is also empirically verified with the sensitivity of output prices to input prices rising at higher quantiles of input prices. Besides, higher input prices have a quicker transmission and stronger impact on the headline inflation relative to core inflation. Firms have begun to pass on a part of their rising cost to selling prices in the manufacturing and services sector, following the improvements in demand conditions that enables them to do so. Going forward, one needs to be watchful of the dynamics playing out between divergent forces - demand picking up; some softening in input price pressures in very recent months; and continuing global uncertainties – that could determine the impact on headline inflation. VI. References Ball, L. M. (1999). Policy rules for open economies. In Monetary policy rules (pp. 127-156). University of Chicago Press. Ball, L., & Cecchetti, S. G. (1988). Imperfect Information and Staggered Price Setting. The American Economic Review, 999-1018. Blanchard, O. J., & Kiyotaki, N. (1987). Monopolistic competition and the effects of aggregate demand. The American Economic Review, 647-666. Hait, A., John, J., Das, A., & Mitra, A. (2013). Corporate Pricing Power, inflation and IIP Growth: An Empirical Investigation. Reserve Bank of India, WPS (DEPR), 09. Khundrakpam, J. K., & George, A. T., (2013). An empirical analysis of the Relationship between WPI and PMI-Manufacturing Price Indices in India. Reserve Bank of India, WPS (DEPR), 06. Koenker, R., & Bassett Jr, G. (1982). Robust tests for heteroscedasticity based on regression quantiles. Econometrica: Journal of the Econometric Society, 43-61. Kundu, S. (2019). Rural wage dynamics in India: What role does inflation play. RBI Occasional Paper, 40, 51-84. Nadhanael, G. V. (2012). Recent Trends in Rural Wages: An Analysis of inflationary Implications. Reserve Bank of India Occasional Papers, 33(1), 89-112. Patra, M. D., Behera, H., & John, J. (2021). ‘Is the Phillips Curve in India Dead, Inert and Stirring to Life or Alive and Well?. RBI Bulletin, November. Raj, J., & Misra, S. (2011). Measures of core inflation in India–an empirical evaluation. Reserve Bank of India, WPS (DEPR), 16. Schnabel, I. (2022). The globalization of inflation. In Speech given at a conference organised by the Österreichische Vereinigung für Finanzanalyse und Asset Management, May (Vol. 11). Svensson, L. E. (1986). Sticky goods prices, flexible asset prices, monopolistic competition, and monetary policy. The Review of Economic Studies, 53(3), 385-405. Vijlder, W., (2022), “Companies’ Pricing Power and the inflation Outlook”, BNP Paribas. Yetman, J. (2020). Pass-through from short-horizon to long-horizon inflation expectations, and the anchoring of inflation expectations. Bank for International Settlements, Monetary and Economic Department. RBI (2022). Globalisation of inflation and Conduct of Monetary Policy, Speech by Shri Shaktikanta Das, Governor, Reserve Bank of India - July 9, 2022 - Delivered at the Kautilya Economic Conclave, organised by Institute of Economic Growth in New Delhi. RBI (2022). Annual Report for 2021-22. RBI (2022). Monetary Policy Report, April. RBI (2022). Resolution of the Monetary Policy Committee (MPC), February.
Annex A I. Descriptive Statistics | Table 1: Descriptive Statistics | | Duration: April 2012 – May 2022 | | Measure | PMI-Input Prices | PMI-Output Prices | Core CPI
(Seasonally Adjusted, m-o-m) | | Observations | | | 136 | | Mean | 53.77 | 51.43 | 0.49 | | Standard Deviation | 3.27 | 1.87 | 0.26 | | Minimum | 37.82 | 40.50 | -0.11 | | Maximum | 61.50 | 57.27 | 1.68 | | Skewness | -1.21 | -0.83 | 0.78 | | Kurtosis | 8.85 | 13.25 | 5.08 | | Source: RBI Staff estimates. | II. Unit Root Tests | Table 2: Augmented Dickey Fuller (ADF) Test Results | | Variables | Constant | Trend | | PMI Input Prices | -3.14*** | -3.08 | | PMI Output Prices | -4.63*** | -4.79*** | | Core CPI | 2.01 | 0.81 | | Core CPI m-o-m (Seasonally Adjusted) | -9.25*** | -9.86*** | | Headline CPI m-o-m (Seasonally Adjusted) | -9.02*** | -9.18*** | | Future Output | -2.59 | -3.21 | | Future Output (at first difference) | -15.06*** | -15.07*** | Notes: 1. *** denotes significance at 1 per cent level.
2. The unit root tests indicate rejection of null hypothesis for PMI input and output prices series making them I(0) variables.
Source: RBI Staff estimates |
Annex B
|