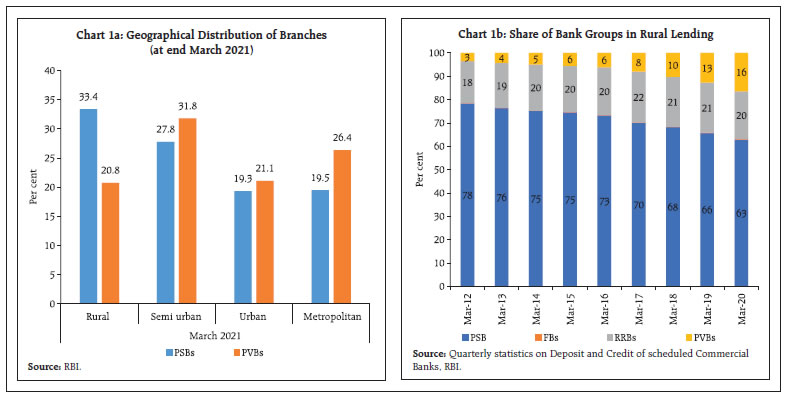
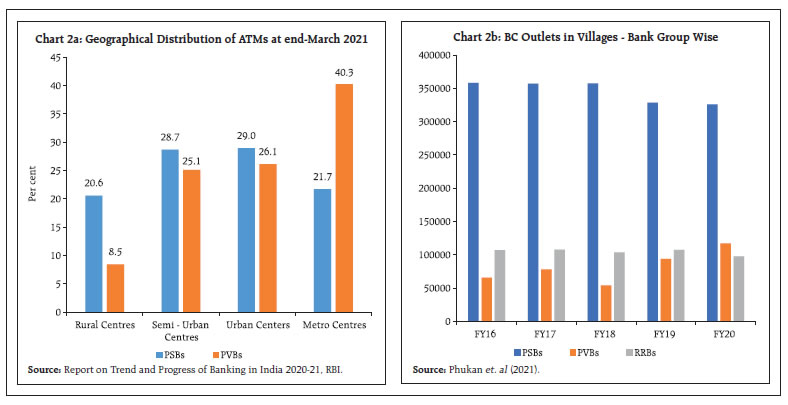
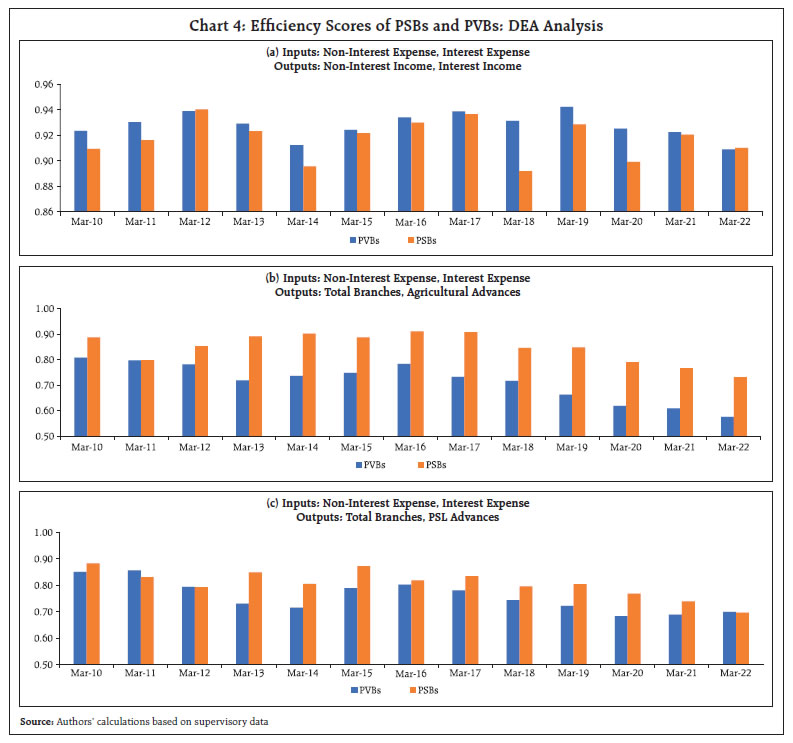
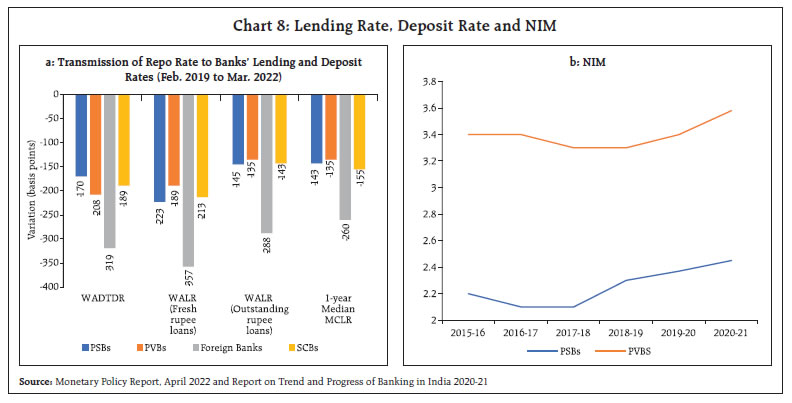
Privatization of public sector banks (PSBs) has been widely viewed as a key area of pending reforms in India. This article empirically examines the performance of PSBs relative to private sector banks (PVBs). Using data envelopment analysis (DEA), it finds that while PVBs are more efficient in profit maximization, their public sector counterparts have done better in promoting financial inclusion. The labour cost efficiency of PSBs is higher than PVBs. Empirical evidence also suggests that lending of PSBs is less procyclical than PVBs and thus PSBs help the countercyclical monetary policy action to gain traction. Introduction Privatization has become a buzzword world-wide since the 1990s and governments all over the world have either reduced participation or withdrawn completely from a range of activities in the last four decades. Prior to the global finance crisis (GFC), banking was no exception to this trend. In developing countries, the average share of assets held by government owned banks declined from 40 per cent in 1995 to 17 per cent in 2008 while in high-income countries, the same fell from 36 per cent in 1995 to 10 per cent in 2008. Post GFC however, there has been a renewed interest in the public ownership of banks as many high income and developing countries capitalized or nationalized stressed banks. In countries such as Iceland, Kazakhstan, the United Kingdom, and the República Bolivariana de Venezuela, the share of assets held by the government in the banking sector increased by more than 10 percentage points between 2008 and 2010 (Cull, Peria and Verrier, 2018). Since then, the pros and cons of public ownership of banks has remained a hotly debated topic all over the world. Privatization has had its significant influence over economic thinking in India as well, although banking had remained largely untouched by its winds till recently. In the Union Budget 2021-22, the government announced its intent to take up the privatisation of two PSBs. A recent policy prescription emphasizes that ‘…PSBs have underserved the economy and their stakeholders’, to make a case for privatization of all PSBs excluding the State Bank of India (Gupta and Panagariya, 2022). This article offers an alternate perspective by taking inspiration from the strands of literature that justify the role of PSBs on several grounds. The ‘social view’ propagated by Atkinson and Stiglitz (1980) suggests that state-owned enterprises (SOEs) are created to address market failures, and often their social benefits exceed the social costs. According to this view, government-owned banks contribute to economic development and improve general economic welfare (Stiglitz, 1993). Another strand of literature suggests that lending by state-owned banks is either countercyclical or less pro-cyclical than lending by private banks, especially in emerging and developing economies and thus the public sector banks contribute to macroeconomic stability (Panizza, 2022; Micco and Panizza 2006). Various studies have shown that public sector banks have played a key role in catalyzing financial investments in low-carbon industries thereby promoting green transition in countries such as Brazil, China, Germany, Japan, and in the European Union (Mazzucato & Penna, 2016 and Schapiro, 2012). An important aspect that is often ignored by researchers proposing privatization is the role played by PSBs in financial inclusion. Incorporating this dimension in the objective function, this article provides empirical evidence on how PSBs have been more welfare enhancing than their private sector counterparts in India. Furthermore, the article empirically establishes that PVBs’ lending is more pro-cyclical as compared with PSBs and thus PSBs help the countercyclical monetary policy to gain traction. In line with recent research, which suggests that ‘private ownership alone does not automatically generate economic gains in developing economies’ and ‘a more cautious and nuanced evaluation of privatization is required’ (Estrin and Pelletier, 2018), this article also recommends gradual approach to privatization. Against the above context, the article is organized as follows: Section II is devoted to exploring the role of PSBs in financial inclusion. Section III presents a performance assessment of PSBs and PVBs for alternative objective functions by using DEA. Section IV examines the credit pattern of PSBs and PVBs relative to the state of business cycles. Section V presents latest data trends to assess overall market response to performance of PSBs. Section VI concludes and provides a way forward. II. Role of PSBs in Financial Inclusion PSBs account for the highest share of bank branches in rural areas, followed by semi-urban areas, in adherence to their commitment to the financial inclusion objective (Chart 1a). The PSBs dominate in meeting the credit demand of rural areas (Chart 1b). Although PVBs have been making some inroads in the rural areas, their progress remains slow. Opening and maintaining brick and mortar branches is costly and may also turn out to be economically unviable, especially in rural areas. To address this, the PSBs have been adopting innovative ways of providing financial services in rural areas. For example, their share in ATMs in rural areas is more than twice that of PVBs (Chart 2a). Another channel that has been used most effectively by PSBs to make financial services available in rural and financially excluded areas is the use of Business Correspondent (BC) Model. The share of PSBs in BC outlets in rural areas has remained consistently above 60 per cent over the years, the highest among the bank groups (Chart 2b). PVBs on the other hand, have adopted the urban BC model.   Pradhan Mantri Jan Dhan Yojana (PMJDY), envisages universal access to banking facilities with at least one basic banking account for every household. As of July 2022, more than 45 crore beneficiaries have been banked and 78 per cent of these accounts were in PSBs (Table 1). Moreover, more than 60 per cent of PMJDY accounts opened in PSBs were in rural and semi-urban areas. | Table 1: Distribution of PMJDY beneficiaries at bank-group level | | (Number of beneficiaries in crores) | | Bank Type | Number of Beneficiaries at rural/ semi-urban centre bank branches | Number of Beneficiaries at urban metro centre bank branches | Number of Rural-Urban Female Beneficiaries | Number of Total Beneficiaries | | Public Sector Banks | 22.66 | 13.54 | 19.96 | 36.2 | | Regional Rural Banks | 7.31 | 1.14 | 4.88 | 8.45 | | Private Sector Banks | 0.7 | 0.6 | 0.71 | 1.3 | | Grand Total | 30.67 | 15.28 | 25.55 | 45.95 | Note: Data as on July 6, 2022
Source: Pradhan Mantri Jan Dhan Yojana, Government of India | It is often argued that PVBs meet their priority sector lending target of 40 per cent fully and thus contribute towards financial inclusion. Granular data however show that the PVBs have met their priority sector targets not through organic lending but through investment in priority sector lending certificates (PSLCs), especially in agriculture and small and marginal farmers categories1. These categories of priority sector lending are especially challenging and attract higher premium. The PVBs have shown willingness to pay higher premiums to meet their PSL targets rather than develop skills and expertise in such lending. III. Efficiency of PSBs We use various combinations of inputs and outputs in the DEA framework to investigate the efficiency levels of banks in India over 2010-2022. DEA is a linear-programming-based method which constructs the frontier of the observed input-output ratios for assessing the performance of homogeneous organizations and is increasingly being used in banking (Fare, Grosskopf, and Lovell, 1985). A summary measure of efficiency of the best performing unit is derived and the performance of each decision-making unit (DMU) is measured against this benchmark to give an indication of how efficient or inefficient each DMU is. The results suggest that when profit maximisation is the sole motive, efficiency of the PVBs has always surpassed that of their public sector counterparts (Chart 4a). However, when the objective function is changed to include financial inclusion—like total branches, agricultural advances and PSL advances— PSBs prove to be more efficient than PVBs (Chart 4 b and c). It is often argued that the staff in PSBs is inefficient (Gupta and Panagariya, 2022). The cost minimization DEA framework is employed to empirically evaluate this claim. In particular, the average labour cost efficiency of PSBs is compared with that of PVBs. In this specialized form of DEA, for given levels of inputs, its prices and outputs of each unit, the model estimates the efficiency score of each unit in comparison to the most labour cost-efficient entity. Cost efficiency is defined as, “efficiency that gives a measure of how close a bank´s cost is to what a best-practice bank´s cost would be for producing the same bundle of output under the same conditions (Kocisova, 2014). Data on total deposits, gross loans and advances, total investments (SLR+ non SLR) and non-interest income were taken as outputs whereas total staff and fixed assets (net) were taken as inputs. Average staff cost (total staff cost/ total staff) and expenses on rent, taxes, lighting, insurance and other administrative costs per unit of fixed assets (other operating expenses/ net fixed asset) were taken as input prices for the analysis. The number of banks in our study varied between 49 in 2010 and 33 in 2022. Data was obtained from various issues of Statistical Tables Related to Banks in India published by the Reserve Bank.  Analysis showed that PSBs’ labor cost efficiency remained higher than PVBs for most of the years except 2016 (Chart 5). This implies that incurring lower cost on labour, the PSBs can generate higher level of output. This finding is in line with the earlier research (Herwadkar et.al. 2019). Effective use of banking BC model, coupled with implementation of other cost-efficient techniques may be the reasons behind the higher cost efficiency of PSBs. IV: Countercyclical Role of PSBs PSBs have consistently allocated a larger proportion of their total credit to agriculture and industry than PVBs (Chart 6). Agriculture lending is a priority, as well as challenging area. Over time, the share of co-operative banks and RRBs in agriculture lending has reduced while that of PSBs has increased2, suggesting that the latter have played an important role in providing credit to the needy sector. Since the corporate bond markets in India are not deep and vibrant, industries had fewer other avenues to raise resources than banks. Earlier research has also shown that larger and stronger industries can access the equity market easily but that option is scarcely available to smaller entities (Ganguly, 2019). This was especially true during the cyclical downturn that started in the Indian economy since 2017-18. By providing credit to industrial sector, the PSBs have played countercyclical role. Infrastructure finance has been a bottleneck in the country’s development and growth. PSBs have a lion’s share in these lendings and their role has been especially crucial against the backdrop of withering away of erstwhile development financial institutions (Chart 7). PSBs are also more effective in monetary policy transmission, aiding the countercyclical monetary policy actions to gain traction. During the last easing cycle for example, their reduction in lending rates was substantially higher than that of PVBs (Chart 8a). At the same time, their deposit rates were relatively stickier as compared with PVBs. The resultant higher NIMs of PVBs is an indication of their profit maximization objective (Chart 8b). On the other hand, by playing a crucial role in monetary transmission, the PSBs have contributed to larger social goals.  Literature is replete with evidence that private banks are more procyclical in lending as compared with public sector banks (Marshall and Rochon 2019). Procyclical lending by private banks may reduce the effectiveness of countercyclical macroeconomic policies, while countercyclical lending by state-owned banks could be useful in smoothing the business cycle, especially in EMEs (Micco and Panizza, 2006, World Bank 2012; Brei and Schclarek 2013). To test whether the PSBs’ lending in India is more countercyclical (or, inversely, less procyclical), we evaluated quarterly data for 30 banks for the period March 2005 to March 2022 in a fixed effect panel regression model (Table 2). The dependent variable viz. credit growth is explained by its own lag and size of bank in terms of assets. The PVBs dummy (PVB=1) is interacted with GDP growth/ lag of GDP growth to gauge the differential between procyclical lending of PVBs vis-à-vis PSBs. Positive and significant coefficients of PVB*GDP growth and PVB*GDP growth t-1 are indicative that PVB lending is more procyclical as compared with their public sector counterparts. Moreover, the findings remain robust even after controlling for prompt corrective action (PCA). V: Market Confidence At the onset of global financial crisis, deposits flew out of PVBs to PSBs. A viewpoint suggested that this reallocation was not indicative of the better financial health of the bank to which the deposits flew, but rather indicated implicit government guarantees in them. Researchers have argued that this had an adverse and destabilising impact on private sector banks from which the deposits were withdrawn, despite their better health (Eichengreen and Gupta, 2013) An analysis of supervisory data available with the Reserve Bank for the episode of deposit withdrawals in early 2020—in the wake of depositor concerns over the health of Yes Bank and Lakshmi Vilas Bank— however suggests otherwise. Deposit outflows during the episode were not restricted to small private banks alone but some PSBs with weaker financial health also faced the same. The outflows happened despite these banks offering relatively higher interest rates than others. Deposits typically flew to stronger banks, both in the public and private sector. This shows that investors and depositors value the health of banks much more as compared to implicit government guarantees, while placing their trust. It can also be argued that during such stress periods, if stronger PSBs had not existed, the destabilising impact on the banking sector and the economy would have been much greater. Such episodes could have easily led to a run on banks resulting in financial dis-intermediation. In that sense, the public sector banks have played a major role in boosting public confidence. | Table 2: Fixed effect panel regression of credit growth | | | (1) | (2) | (3) | (4) | | Variables | Credit Growth | Credit Growth | Credit Growth | Credit Growth | | (Credit Growth)t-1 | 0.858***
(0.0189) | 0.857***
(0.0193) | 0.853***
(0.0206) | 0.854***
(0.0203) | | Log(Total Assets) | -1.358***
(0.246) | -1.366***
(0.243) | -1.365***
(0.250) | -1.358***
(0.253) | | PVB*(GDP Growth)t | 0.130***
(0.0347) | | | 0.131***
(0.0351) | | PVB*(GDP Growth)t-1 | | 0.133***
(0.0402) | 0.134***
(0.0405) | | | PCA Dummy | | | -1.109**
(0.520) | -1.077**
(0.517) | | Constant | 17.12***
(3.114) | 17.21***
(3.061) | 17.33***
(3.174) | 17.24***
(3.226) | | Bank Fixed Effects | Yes | Yes | Yes | Yes | | Observations | 2,036 | 2,036 | 2,036 | 2,036 | | R-squared | 0.819 | 0.819 | 0.819 | 0.819 | | Number of Banks | 30 | 30 | 30 | 30 | Higher resources raised by PSBs as compared to PVBs in the recent years also provides a testimony of growing market confidence in them (Table 3). | Table 3: Resources Raised by Banks through Private Placements | | (Amount in ₹ crore) | | | 2019-20 | 2020-21 | 2021-22 | | No. of issues | Amount raised | No. of issues | Amount raised | No. of issues | Amount raised | | PSBs | 20 | 29,573 | 36 | 58,697 | 29 | 50,719 | | PVBs | 8 | 23,121 | 4 | 33,878 | 12 | 35,682 | Note: Includes private placement of debt and Qualified institutional placement.
Source: BSE, NSE and Merchant Bankers. | VI: Conclusions Privatization is not a new concept, and its pros and cons are well known. From the conventional perspective that privatization is a panacea for all ills, the economic thinking has come a long way to acknowledge that a more nuanced approach is required while pursuing it. This article provides an alternative view with evidence that public sector banks are not entirely guided by the profit maximization goal alone and have integrated the desirable financial inclusion goals in their objective function unlike PVBs. Our results also point out the countercyclical role of PSB lending. In the recent years, these banks have also gained greater market confidence. Despite the criticism of weak balance sheets, data suggests that they weathered the Covid-19 pandemic shock remarkably well. Recent mega merger of PSBs has resulted in consolidation of the sector, creating stronger and more robust and competitive banks. Establishment of National Asset Reconstruction Company Limited (NARCL) will help in cleaning up the legacy burden of bad loans from their balance sheets. The recently constituted National Bank for financing infrastructure and development (NABFiD) will provide an alternate channel of infrastructure funding, thus reducing the asset liability mismatch concerns of PSBs. Overall, these reforms are likely to help strengthen the PSBs further. Against the backdrop of these findings, a big bang approach of privatization of these banks may do more harm than good. The government has already announced its intention to privatize two banks. Such a gradual approach would ensure that large scale privatization does not create a void in fulfilling important social objectives of financial inclusion and monetary transmission. References Atkinson, A. B., and Joseph E. Stiglitz, (1980), Lectures on Public Economics, London, Mc-Graw Hill Cull, R., Peria, M. S., & Verrier, J. (2018). Bank Ownership: Trends and Implications. World Bank Policy Research Working Paper. Brei, M., & Schclarek, A. (2013). Public Bank Lending in Times of Crisis. Journal of Financial Stability. Eichengreen, B., & Gupta, P. (2013). The financial crisis and Indian banks: Survival of the fittest? Journal of International Money and Finance. Estrin, S., & Pelletier, A. (2018). Privatization in Developing Countries: What Are the Lessons of Recent Experience? World Bank Economic Review. Fare, R., Grosskopf, S., & Lovell, C. (1985). The Measurement of Efficiency of Production. Foray, D., Mowery, D., & Nelson, R. R. (2012). Public R & D and social challenges: what lessons from mission R & D programs. Ganguly, S. (2019). India’s Corporate Bond market: Issues in Market microstructure. RBI Bulletin, Jaunuary. Gupta, P., & Panagariya, A. (2022). Privatization of public sector banks in India- Why, How and How far? India Policy Forum. Herwadkar, S., Neelima, K. M., Verma, R., & Asthana, P. (2019). Labour Cost Efficiency of Indian banks: A Non Parametric Analysis. RBI Bulletin. Kocisova, K. (2014). Application of Data Envelopment Analysis to Measure Cost, Revenue and Profit Efficiency. Statistika, 94(3). Marois, T. (2021). A Dynamic Theory of Public Banks (And Why It Matters). Review of Political Economy. Marshall, W., & Rochon, L. (2019). Public Banking and Post-Keynesian Economic Theory. International Journal of Political Economy. Mazzucato, M., & Penna, C. (2016). Beyond market failures: the market creating and shaping roles of state investment banks. Journal of Economic Policy Reforms. Micco, A., & Panizza, U. (2006). Bank Ownership and Lending Behaviour. Economics Letters. Panizza, U. (2022). State-owned commercial banks. Journal of Economic Policy Reform. Phukan, S., Punnoose, S. T., Kumar, A., S, D., & Kumar, A. (2021). Financial Inclusion Plans - Reflecting the Growth Trajectory. RBI Bulletin. Schapiro, M. (2012 ). Rediscovering the developmental path? Development bank, law, and innovation financing in Brazilian economy. Stiglitz, J. E. (1993). The role of state in finnacial markets. The World Bank Economic Review. World, B. (2012). Global Financial Development Report 2013: Rethinking the Role of the State in Finance. World Bank.
|