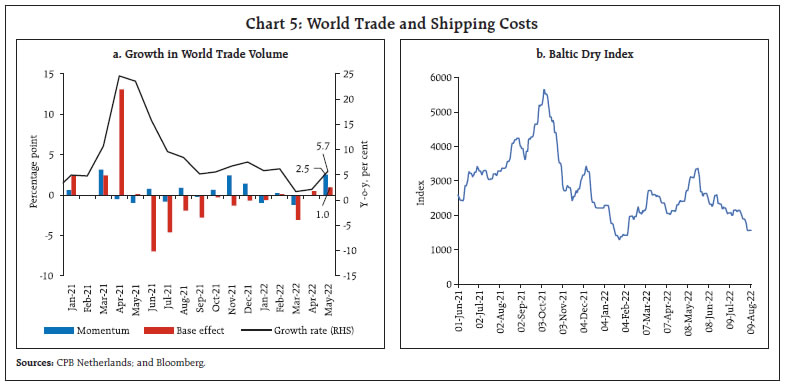
Global growth prospects have turned gloomier over the month. Easing of supply chain pressures and the recent ebbing of commodity prices are providing some breather from record high inflation. In India, supply conditions are improving, with the recent monsoon pick-up, strong momentum in manufacturing and a rebound in services. The onset of festival season should boost consumer demand, including rural, also as sowing activity picks up. Robust central government capital outlays are supporting investment activity. Inflation has edged down, but its persistence at elevated levels warrants appropriate policy responses to anchor expectations going forward. Introduction It has been said that history doesn’t repeat itself, but it often rhymes1. Exactly 25 years ago, as contagion from the south east Asian crisis spread to Russia, Long-Term Capital Management (LTCM) and eventually to Latin America, it also licked at Indian shores. Already battling the after effects of international sanctions imposed on India in response to nuclear testing, the Reserve Bank of India (RBI) announced a package of measures in August 1998 to squelch speculative sentiments from destabilising the foreign exchange market. The cash reserve ratio (CRR) was increased by 100 basis points and the repo rate was raised by 300 basis points. A rare data point formed – monetary policy defence of the exchange rate of the rupee. Alongside, forward cover facilities for foreign institutional investors were enhanced, flexibility was allowed in the use of Exchange Earners Foreign Currency (EEFC) accounts, rebooking cancelled contracts for imports and splitting forward and spot legs were disallowed, and provisions for the repatriation of export proceeds were tightened. These measures coincided with the launching of the scheme of Resurgent India Bonds (RIBs).2 In 1998-99, India also faced the challenge of high inflation – 6.9 per cent in terms of the wholesale price index (WPI), the Reserve Bank’s preferred metric, and 13.1 per cent in terms of the consumer price index for industrial workers. The Reserve Bank’s Annual Report for that year acknowledged it: “On strict analytical grounds, this situation warranted monetary tightening measures in order to control liquidity and to maintain price stability. However, in the presence of persisting industrial slowdown, monetary tightening… would have dampened emerging signs of incipient recovery in the real sector. This, in turn, could have resulted in lower revenue for the Government and the need for higher borrowing requirement of the Government”. In 2022, India is again confronted with high volatility in the foreign exchange market as well as elevated and persistent inflation brought on by external spillovers. Now, however, India deals with these challenges from a position of strength imparted by the resilience of its macro-fundamentals and buffers, and a structural change in the policy environment. First, we have a monetary policy framework today that explicitly accords primacy to the goal of price stability with a numerical target and a tolerance band around it, while keeping in mind the objective of growth. Accordingly, the Reserve Bank is undertaking the required monetary policy action to quell inflation, stabilise expectations and ensure overall macroeconomic stability. In its August 2022 meeting, the Monetary Policy Committee (MPC) decided to raise the repo rate by 50 basis points – mark the much reduced size of the rate increase relative to August 1998 – and focus on the withdrawal of accommodation. A quiet confidence is exuded by Governor Shri Shaktikanta Das’s statement: “The Indian economy is holding steady and progressing in an ocean of turbulence and uncertainty… We in the RBI reiterate our commitment to maintain price and financial stability to place our economy on a sustainable path of growth. Our actions have helped the economy to tide over a series of shocks…We are seized of our role at this critical juncture and will persevere in our efforts to ensure a safe and soft landing.” Second, today the Reserve Bank follows an assignment rule attributed to Jan Tinbergen, the first Nobel laureate in Economics in 1969. The rule says that there should be as many instruments in place as there are targets and each instrument should be assigned to the target that it is most likely to achieve. The conduct of monetary policy in India is now oriented completely to bringing down inflation from unconscionably high levels as its priority. Alongside, the Reserve Bank has remained unswerving and resolute in its efforts to impart stability to the foreign exchange market, not by monetary policy but through interventions and liberalisation of capital inflows. Both sets of actions have earned the Reserve Bank credibility and this is already being reflected in the sentiments of households and businesses. Inflation has flattened and soon it is expected to fall, first into the tolerance band of 2-6 per cent and then to the target of 4 per cent. The Indian rupee is among the best performing currencies in the world, its depreciation among the least in the face of the unrelenting strength of the US dollar. And as Governor Shri Das points out “…with strong and resilient fundamentals, India is expected to be amongst the fastest growing economies during 2022-23.” Turning to the global economy, our nowcast and model-based forecast of quarterly global GDP that we set out for the first time in the June 2022 issue of the Bulletin3 have been confirmed by the International Monetary Fund (IMF) in its July 2022 update of its World Economic Outlook – global GDP contracted in the second quarter of 2022, after slowing in the first quarter. The July 2022 global composite purchasing managers’ index (PMI) eased to its weakest level in the current 25-month sequence of expansion, with contraction among advanced economies (AEs) but some resilience among emerging market economies (EMEs). Has the recession arrived, ahead of monetary policy’s bite and Europe’s bleak winter? The main fault line is global inflation, notwithstanding recent easing of supply chain pressures and commodity prices. The paths of AEs and EMEs are diverging again. Across the AE world – from Washington to Wellington - growth is slowing or turning negative and yet, incoming data point to labour markets remaining historically tight. A full employment or jobful recession sounds like an oxymoron, but it may well be approaching. Okun’s Law4, which posits that a decline in output goes hand in hand with a rise in unemployment, is about to be overturned. The answer lies in aging, slowing immigration, and fewer workers and jobseekers. Jobs lost to the pandemic may have been regained, but labour participation remains weak, shrinking labour forces in AEs and making unemployment rates look like at all time lows. Developments in our besieged neighbourhood raise fears of an archetypal EME crisis that seems to follow every time the US Fed raises interest rates. The risks to the global economy may have diminished but the humanitarian challenge bearing down on people living in EMEs is daunting. The Economist estimates that 53 low- and middle-income countries are already experiencing debt difficulties or their bonds are trading at stressed levels or they have defaulted – the fragile fifty three. Knock on effects on the global economy may be smaller than in the past, but this group could get bigger. Transiting from the world back to India, a development of far-reaching portent is noteworthy. Friend shoring has begun, and India is seizing the opportunity. India partnered with 17 countries on July 20, 2022 on the occasion of the 2022 Supply Chain Ministerial Forum to alleviate near-term transportation, logistics and supply chain disruptions and bottlenecks as well as long-term resilience challenges. The joint statement emphasised (a) transparency consistent with domestic laws and international obligations; (b) diversification of sources and logistics infrastructure capacities; (c) supply chain security addressing risks arising from supply dependencies and potential vulnerabilities in critical infrastructure; and (d) sustainability and responsible business conduct across supply chains. The key to resolving the next global supply chain crisis is to prevent it from happening in the first place. Amidst somewhat mixed signals being emitted by high frequency indicators, perhaps the best word to describe the state of domestic economic activity relative to the rest of the world is resilience. Private final consumption expenditure, the mainstay of the economy, is poised to surge in the upcoming festival season which should also buoy subdued rural demand, as shortfalls in kharif rice sowing close with the recent revival of the south-west monsoon. Investment demand is benefitting from the massive increase of 54 per cent in the central government’s capital outlay, but business investment remains tepid in spite of strong sales growth and increase in profits. Although exports have moderated in July, this may be a one-off because world trade volume has accelerated. With the windfall levy on fuel exports having been reduced/scrapped, exports of petroleum products that account for 16 per cent of total merchandise exports are set to rise again. The recent easing of international crude prices should also reduce the import bill, allowing net exports to improve their contribution to aggregate demand. Three developments inspire confidence. First, India is getting set to experience faster and wider data services across the country. With spectrums auctions coming to a close on August 1, 2022, 5G will deliver network speeds 100 times quicker than 4G networks. The thrust to internet penetration has the potential to generate employment arising from innovative technologies, create new age business and increase the reach of online education and telemedicine to remote regions (Chart 1). An amount of ₹1.5 lakh crore has accrued to the public exchequer, the highest spectrum collections since 20105. This provides fiscal comfort. Second, early corporate earnings results for the first quarter of 2022-23 have beaten expectations, allaying concerns on corporate profitability in an operating environment marked by inflationary pressures. Sales growth of non-financial sector companies remained in high double digits even after adjusting for inflation (Chart 2). Input cost escalation was experienced across the board. The consequent pressure on operating margins was sought to be mitigated by adopting a range of strategies including improvement in operational efficiency, changing the mix of products and the like. Rising input costs benefitted some, as for instance, upstream oil and gas companies. The banking and financial sector also fared well amidst a pickup in credit growth, lower provisioning costs and improvement in asset quality. The better-than-expected corporate earnings have buoyed domestic equity markets and attracted foreign portfolio investment (FPI) back to India - FPIs turned net buyers in Indian equities in July 2022 and August so far after a gap of nine months. 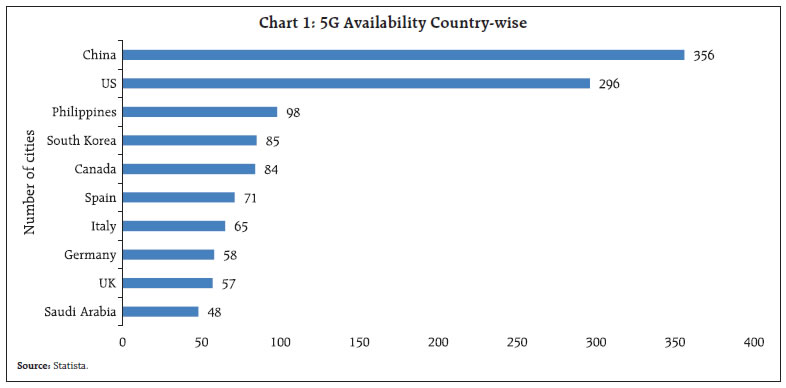 Third, a development that may lack flash but has far-reaching significance is the active recognition of climate change as a risk to the stability of the financial system by the Reserve Bank in its July 27, 2022 discussion paper6. The paper underscores the need for an appropriate framework to identify, assess and manage climate related risk, and move the financial system towards green financing, keeping in mind the social and developmental objectives of the country. The Reserve Bank intends to prepare a strategy, based on global best practices, including by participation in standard-setting bodies and other international fora, on mitigating the adverse impacts of climate change. The challenge is to move from qualitative assessments to quantification of climate change risks, initially through appropriate disclosures. 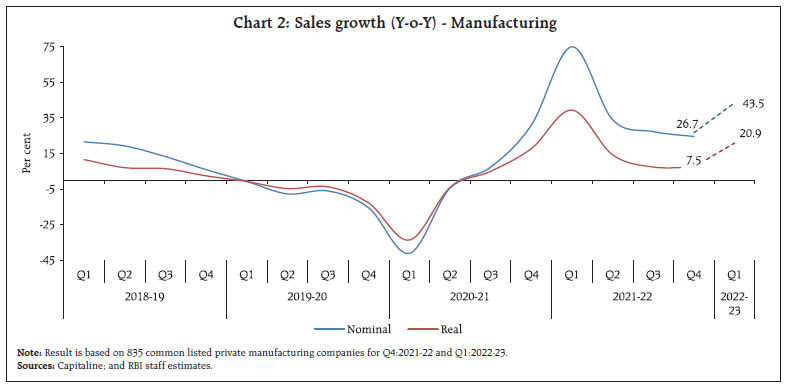 Set against this backdrop, the remainder of the article is structured into four sections. Section II captures the rapidly evolving developments in the global economy. An assessment of domestic macroeconomic conditions is presented in Section III. Section IV reviews financial conditions in India, while the last Section concludes the article. II. Global Setting The pace of global growth has tapered off in recent months amidst volatile financial conditions and persisting uncertainty surrounding the geo-political situation. Heightened recession risks are shadowing aggressive and synchronised monetary tightening across jurisdictions. In its July 2022 update of the World Economic Outlook (WEO), the International Monetary Fund (IMF) revised down its global growth projection by 40 basis points (bps) for 2022 and by 70 bps for 2023 to 3.2 per cent and 2.9 per cent, respectively. In a downside scenario characterised by a drastic fall in energy imports from Russia, elevated and persistent inflation expectations and tighter financial markets conditions, global growth may fall further to about 2.6 per cent and 2.0 per cent in 2022 and 2023 respectively7 (Table 1). Our updated nowcasts of global GDP for Q2:20228 point to global growth momentum entering the contractionary zone9 (Chart 3). This is also reflected in the movement of high frequency indicators. The global composite purchasing managers’ index (PMI) decreased to 50.8 in July 2022, the lowest in 2 years, even as the services sector business activity index fell to 51.1 in July from 53.9 in June. The global manufacturing purchasing managers’ index (PMI) declined to a 24-month low of 51.1 in July from 52.2 in June as new orders contracted and employment slipped further (Chart 4a). Manufacturing output declined in most AEs; EMEs’ performance was mixed as some of them maintained expansion (Chart 4b). 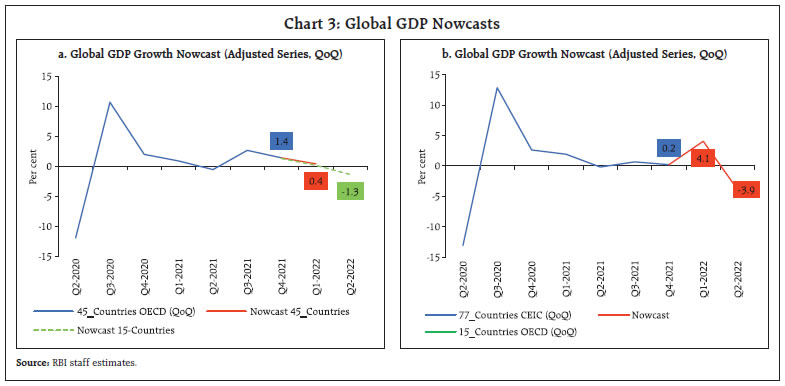 The IMF has also reduced its world trade growth forecast for 2022 and 2023 by 90 bps and 120 bps to 4.1 per cent and 3.2 per cent, respectively. In terms of live indicators, world merchandise trade volume growth had accelerated to 5.7 per cent (y-o-y) in May 2022 from 2.1 per cent in April. A favourable base effect was supported by a pickup in momentum as the Baltic Dry Index, a measure of shipping charges for dry bulk commodities, declined for the second consecutive month, shedding 15.4 per cent in July (Chart 5). PMI subindices for July also indicated receding supply chain bottlenecks and fading price pressures, and delivery time reduced to a 20-month low. 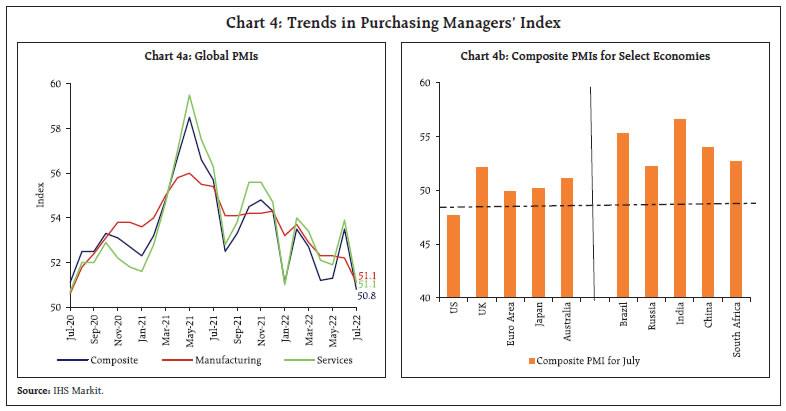
 International commodity prices remained volatile after a precipitous fall in June on fears of impending global recession. The Bloomberg commodity price index witnessed a partial rebound in the second half of July, averaging 3 per cent higher than the average of the first half (Chart 6a). In particular, crude oil prices exhibited heightened volatility, owing to exceptionally stringent supply conditions. Notwithstanding the moderation starting from July 19, 2022, crude oil prices have recorded a 21.0 per cent gain year to date (up to August 17, 2022) (Chart 6b). On August 3, the Organization of the Petroleum Exporting Countries (OPEC) and its allies agreed to increase production by 1,00,000 barrels a day. At 0.1 per cent of global demand, this is one of the smallest oil production increases in the group’s history. As on August 17, 2022 Brent futures has averaged around US$ 93 per barrel for 2022 and US$ 88 per barrel for 2023. After tumbling for three consecutive months, gold prices increased in July and continued its uptrend in August so far (up to 11) as bond yields softened and safe haven demand was rejuvenated by recession expectations (Chart 6c). Marking the fourth consecutive monthly decline, the FAO food price index fell by 8.6 per cent m-o-m in July 2022, the fall spread across constituents. Despite this decline, it registered an annual increase of 13.1 per cent, pointing to still sustained price pressures (Chart 6d). A number of countries had put in trade policy measures to insulate domestic economies from rising global food prices. With the significant easing of price pressures over the last two months, there has been a corresponding decline in trade policy restrictions, beginning June 2022 (Chart 7). In spite of the moderation in commodity prices and supply chain pressures, the globalisation of inflation and its persistence remains the major faultline in the evolving global outlook. In July 2022, the IMF revised up its inflation projection by 0.9 percentage points for AEs to 6.6 per cent and by 0.8 percentage points for emerging market and developing economies (EMDEs) to 9.5 per cent (relative to projections in the April 2022 WEO), driven by food and energy prices as well as supply-demand imbalances. The US headline CPI inflation eased to 8.5 per cent in July 2022 from a 40-year high of 9.1 per cent in June. The monthly momentum steadied at 0 per cent in July (1.3 per cent in June) as the fall in gasoline prices offset the increases in those of food and shelter. On the other hand, inflation in the US measured by the y-o-y change in the personal consumption expenditure (PCE) price index accelerated to 6.8 per cent in June 2022 from 6.3 per cent in May, with a monthly momentum of 1.0 per cent as energy prices increased 7.5 per cent (m-o-m) while food prices increased 1.0 per cent. Core PCE inflation also edged up to 4.8 per cent in June 2022 from 4.7 per cent a month ago as the monthly momentum of 0.6 per cent was only partly offset by a favourable base effect. Euro area annual inflation soared to a new record of 8.9 per cent in July, primarily driven by energy and followed by food, alcohol and tobacco. CPI inflation in the UK accelerated to a 40-year high of 9.4 per cent (y-o-y) in June 2022, with transport followed by food and non-alcoholic beverages contributing the highest to the monthly momentum (Chart 8a). Among the BRICS economies, inflation in Brazil at 10.1 per cent in July remained in double digits for the eleventh consecutive month. In China, it rose to a twenty-four month high of 2.7 per cent (Chart 8b). In Russia, the annual inflation rate fell to 15.1 per cent in June 2022 from 15.9 percent in the previous month - the lowest inflation rate since March. 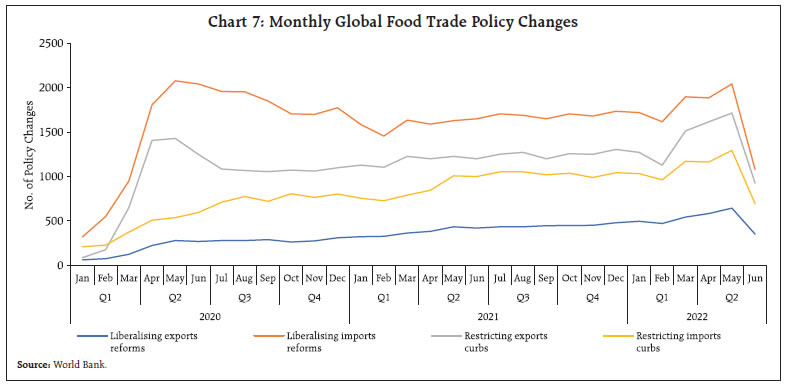 Global financial markets recovered towards the end of July, paring losses suffered in June. The MSCI world equity index rebounded, ending the month 6.9 per cent higher than a month ago. Advanced economies’ equities fared better than their emerging market peers, increasing by 7.9 per cent as against a decline of 0.1 per cent in the latter (Chart 9a). In the bond market, 10-year G-sec yields softened across major AEs as the growth outlook darkened. The US 10-year G-sec yield fell by 37 basis points in the last 10 days of July, largely in response to a priced-in market response to the 75 bps increase in the policy rate in July (Chart 9b). In fact, the US treasury yield curve has inverted since July 05, 2022 - signs of an impending recession. The US dollar index rose sharply up to mid- July on Federal Reserve’s hawkish action and safe haven demand but lost steam on expectations of a slower future pace of rate hikes by the US Fed (Chart 9c). Concomitantly, the MSCI currency index for EMEs declined till mid-June before recovering marginally on support from equity inflows (Chart 9d). 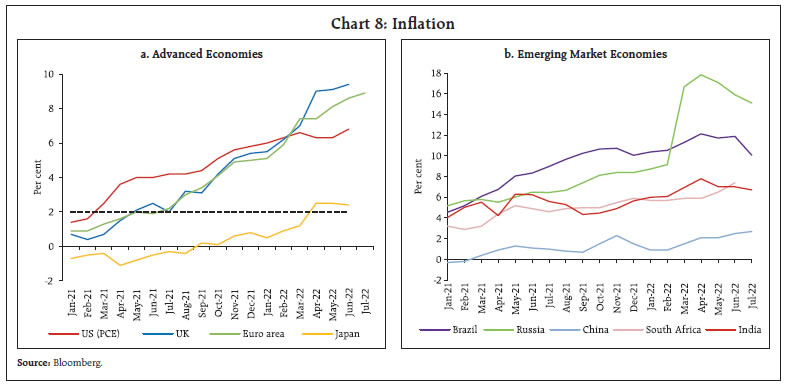 Monetary tightening continued synchronously across the globe with the growing conviction that aggressive monetary policy actions are warranted to rein in historically high inflation. As stated earlier, the US Federal Reserve raised the target range of the federal funds rate for the fourth consecutive meeting but on expected lines by 75 bps to 2.25-2.50 per cent. It also reiterated the announced path of taper – the Fed’s balance sheet would decline by US$ 95 billion from September, i.e., at double the pace of the previous three months’ contraction. On August 4, the Bank of England (BoE) raised its policy rate by 50 bps, expecting inflation to rise above 13 per cent in Q4:2022. The UK economy is projected to enter recession from Q4:2022. The ECB raised rates by 50 bps – the first in over a decade – and exited negative interest rates to rein in record high inflation. Israel, New Zealand and South Korea also raised their policy rates by 50 bps in July, while Canada and Australia raised rates by 100 bps in Q3 so far. Japan, however, continued to diverge by maintaining an accommodative stance. 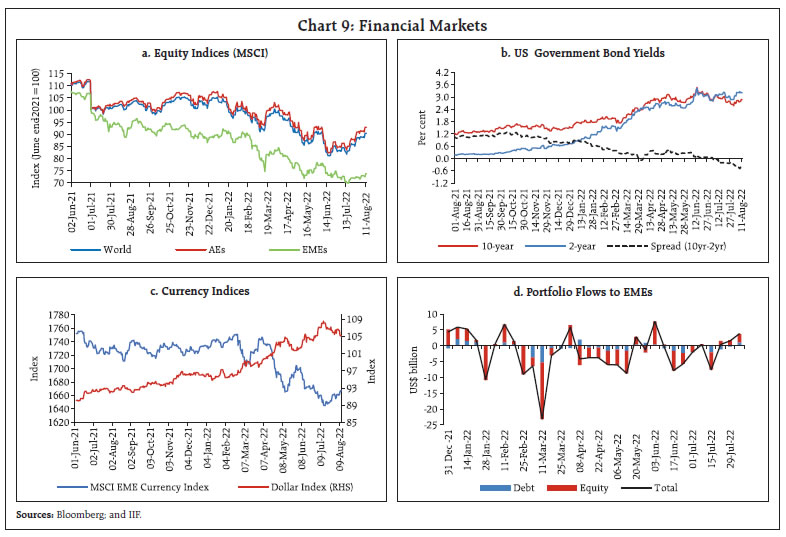
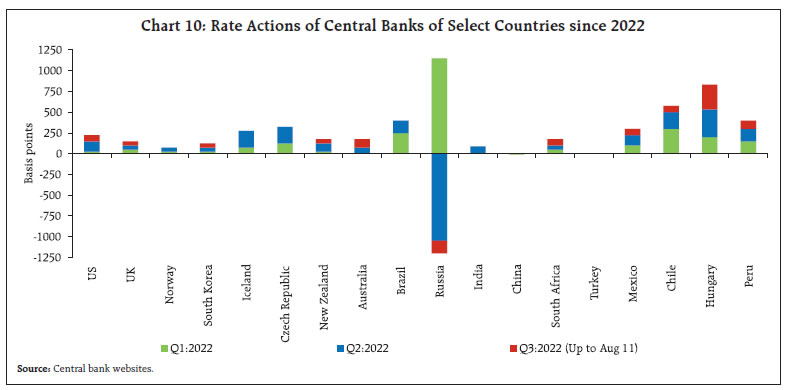 Most EME central banks also continued with policy tightening (Chart 10). Most countries raised policy rates in their regular policy cycles while Hungary and Philippines took actions in off-cycle meetings. In contrast, Russia cut its policy rate by 150 bps in the latest policy meeting while China cut its One-Year Medium-Term Lending Facility Rate, a key lending rate by an unexpected 10 bps and continued its accommodative stance. III. Domestic Developments Our economic activity index that employs a dynamic factor model (DFM) with 15 high frequency indicators is showing a moderate but steady improvement in May and June (Chart 11). Under alternative model specifications, GDP growth for Q2:2022-23 is nowcast at 7.2 per cent, supported by a favourable base (Chart 12).
Aggregate Demand The movement of goods as a proximate indicator of aggregate demand remained resilient. Both inter state and intra-state E-way bills generation picked up sequentially in July 2022 (Chart 13a). Toll collections remained robust in July 2022, but for some exhibited moderated sequential moderation due to unfavourable weather conditions (Chart 13b). Fuel consumption too declined in July on account of seasonal factors, showing up in a dip in the consumption of diesel, petrol and aviation turbine fuel (Chart 14a). The automobile sector recovered in July on the back of sustained passenger vehicle dispatched to dealers. Entry level passenger vehicles are yet to recover to pre-pandemic levels, even as they recorded sequential improvement (Chart 14b). Retail sales of automobiles moderated due to seasonal rains, led by a fall in registration of non-transport vehicles, primarily two-wheelers, which constitute 80 per cent of the total (Chart 14c). Uneven spread of the monsoon also impacted tractor sales in July, even as two wheelers and motorcycle sales picked up and three-wheeler sales continued to lag below pre-pandemic levels (Chart 14d). Sales of fast-moving consumer goods (FMCG) recorded a sequential decline in July, reflecting a seasonal drag in the beverages segment. Sales are expected to be strengthen going ahead, with the cooling of edible oil prices on a global price correction. The expected demand pickup in the upcoming festive season, good monsoons and higher earnings10 are all aiding rural consumption and increase in out-of-home activities is propelling urban consumption.
Despite bleak global growth prospects, elevated energy prices, supply-side disruptions and the prevailing geopolitical tensions, the Indian private corporate sector is increasingly optimistic on demand conditions in the manufacturing, services and infrastructure sectors, as reflected in the quarterly enterprise surveys conducted by the Reserve Bank. Domestic manufacturers expect higher production, and enterprises in services and infrastructure sectors expect higher turnover in the second half of 2022-23 (Chart 15).
As per the household survey of the Centre for Monitoring Indian Economy (CMIE), the employment rate improved in July. The unemployment rate declined by a percentage point to 6.8 per cent in July 2022, despite a rise in the labour force participation rate (LFPR) (Chart 16). This fall was driven by a 2 percentage points decline in rural unemployment rate on account of improvement in farm activity. Demand for work under the Mahatma Gandhi National Rural Employment Guarantee Scheme (MGNREGS) declined significantly in July, indicating the increased availability of farm work as well as in other sectors in the rural area (Chart 17). In terms of the organised sector employment outlook, the employment sub-index for both manufacturing and services moderated marginally over the previous month though it remains expansionary (Chart 18).
India’s merchandise exports at US$ 36.3 billion on a y-o-y basis witnessed muted growth of 2.1 per cent (Charts 19). On a sequential basis, exports fell 14.4 per cent (m-o-m), partly reflecting the imposition of excise duty/cess on petroleum products. Non-oil exports grew marginally by 0.8 per cent (y-o-y). An analysis of the performance of exports of top 10 commodities reveals that engineering goods, gems and jewellery, textile and cotton, which together account for 40 per cent of the total export basket, contracted sequentially as well as on a y-o-y basis (Table 2).
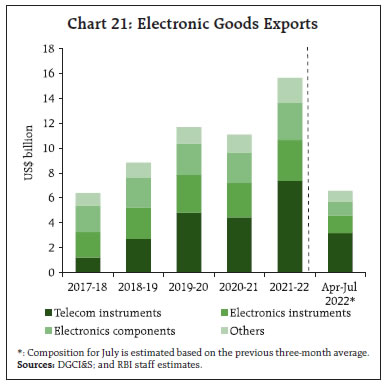
Petroleum products grew by 9.2 per cent on a y-o-y basis while contracted by 40.2 per cent on a m-o-m basis to US$ 6.4 billion in July 2022 (Chart 20). With the cuts/abolition in cesses on petroleum products and the reduction in the windfall tax rates, exports of petroleum, oil and lubricants (POL) are expected to regain momentum and support overall merchandise export performance.11 Electronic goods, accounting for 5.2 per cent of total exports of India, were the leading positive contributor to export growth in July. Since 2017-18, exports of electronic goods have more than doubled. Telecom instruments have been the major driver, rising more than sixfold (Chart 21). The USA and the UAE account for 33 per cent of India’s electronics exports. By 2025-26, the domestic market size is estimated to reach US$ 180 billion and production is expected to touch US$ 300 billion12. Hence, integration in global value chains through the Production Linked Incentive (PLI) schemes and greater market expansion with free trade agreements (FTAs) would be crucial going forward. 
 India’s engineering exports declined by 2.5 per cent in July 2022 on a y-o-y basis. Within the segment, shipments of two and three-wheeler vehicles recorded an increase of 2 per cent during Q1:2022-23 as compared with the corresponding period last year (Chart 22). The gradual easing of the semiconductor supply crunch and supply chain pressures should support the export performance of the automotive manufacturers in coming months. India’s merchandise imports at US$ 66.3 billion grew significantly on a y-o-y basis (43.6 per cent); however, they declined sequentially (Chart 23a). Non-oil non-gold imports at US$ 42.8 billion continue to grow in double digits for 17 consecutive months (Chart 23b). India’s oil imports at 106.5 million tonnes (MT) were 13.7 per cent higher than the previous high of 93.7 MT during April-July 2018. Oil import dependency has been increasing in recent years (Chart 24). Meanwhile, ethanol blending has translated to foreign exchange savings of ₹41,500 crores.13 The major imported commodities such as gold, electronic goods, coal and fertiliser that account for around one-third of total merchandise imports are trending above their five-year average growth rates, reflecting price effects (Chart 25). The deceleration in exports, coupled with the sharp rise in merchandise imports, led to a record level of the trade deficit in July at US$ 30.0 billion, almost tripling from a year ago. A country-wise analysis of the trade deficit reveals that India runs the highest gap with China, followed by Iraq and Saudi Arabia (Chart 26).
Freight prices moderated in July 2022 across all major routes (Chart 27a). Container waiting time in China’s major ports also showed signs of improvement (Chart 27b). The central government’s capital outlay grew by 53.5 per cent during April-June 2022-23 while revenue expenditure increased by 8.8 per cent, leading to a marked improvement in the quality of spending – the revenue expenditure to capital outlay (RECO) ratio decreased to 4.8 in Q1:2022-23 from 6.8 in the corresponding period of the previous year (Chart 28). On the receipts front, growth in gross tax revenue picked up during April-June, despite unfavourable base effects, driven by positive momentum in direct taxes (Chart 29). Moreover, the government earned ₹1.5 lakh crore from 5G spectrum auctions, of which at least ₹13,365 crore14 will be paid as the first annual instalment, providing comfort on receipts from non-tax sources (Chart 30).
GST collections (Centre plus states) stood at ₹1.49 lakh crore in July 2022, the second highest since its inception and the fifth consecutive month for which GST collections have surpassed ₹1.4 lakh crore (Chart 31).
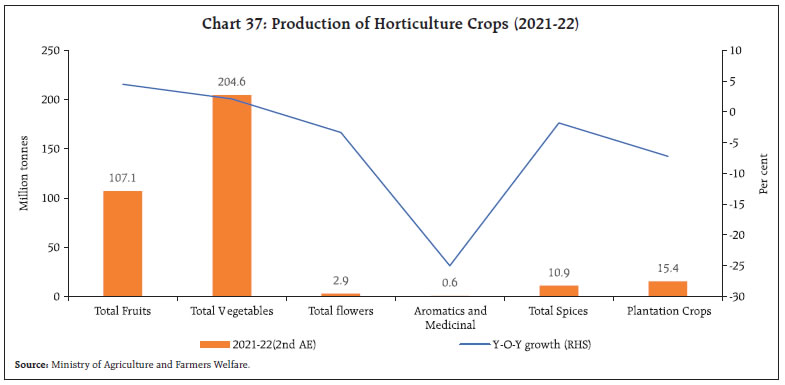
As per the information available for 21 States, the key budgetary deficit indicators of the States improved in Q1:2022-23 from a year ago, largely driven by a steady improvement in revenue receipts and decline in capital outlay (Chart 32). Revenue receipts posted a y-o-y growth of 33.1 per cent, with sharp increases across all sub-components - tax revenue, non-tax revenue and grants from the Centre. Revenue expenditure incurred by States recorded a growth of 13.1 per cent. In March 2022, the Centre had stipulated that States should equate their off-budget borrowings with own debts, and any such borrowings raised by them in 2020-21 and 2021-22 shall be adjusted out of the borrowing limit of the current fiscal year. Recently, the norms for off-budget borrowings have been relaxed by the Centre, allowing the States to set off their off-budget borrowings during 2021-22 against the borrowing limit of the next four years till March 2026. This relaxation will ease the pressure on the finances of the State governments and improve the resource availability with them for undertaking capital expenditure. Additionally, the Centre has sanctioned ₹20,000 crores transfer to eight States under the Scheme for Special Assistance to States for Capital Investment to support the capex growth. Aggregate Supply The onset of the south-west monsoon was slow this year as the aggregate level rainfall trailed the long period average (LPA)15 rainfall by 8 per cent through June, but it picked up subsequently and the season’s rainfall so far (up to August 10) is 8 per cent above normal, as per the India Meteorological Department (IMD). The uneven spatial distribution of rainfall was reflected in the weekly progress of the production weighted rainfall index (PRN)16 while it has persistently remained below the IMD’s aggregate rainfall index, underwent some catching up in second half of July (Chart 33). East and North-East regions have received rains 22 per cent above the LPA in June, followed by 45 per cent below the LPA in July (Chart 34). Kharif sowing has been delayed due to significantly deficient rainfall (24–48 per cent below normal) in Uttar Pradesh, Bihar, Jharkhand and West Bengal, which together produce a third of the country’s total foodgrains. 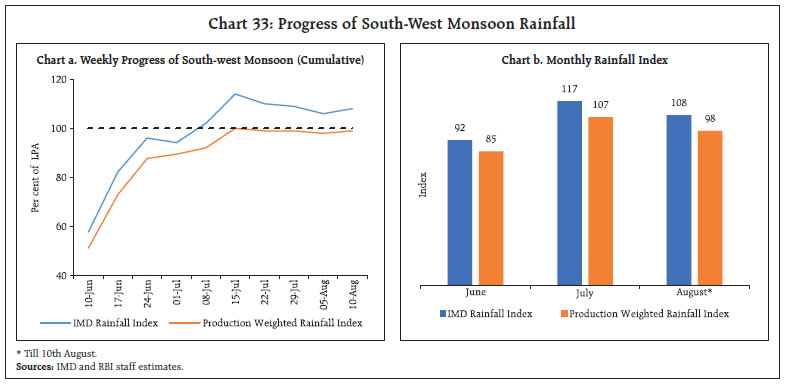 Rice is the major Kharif crop and highly dependent on SWM rains. Acreage under paddy lags substantially behind the sown area a year ago as well as the normal area (5-year average) (Chart 35a). While the pan-India sowing of rice (-12.7 per cent) and pulses (-2.5 per cent) is below the previous year’s levels (as on August 05, 2022), the acreage under oilseeds (0.6 per cent), coarse cereals (3.9 per cent), cotton (6.7 per cent) and sugarcane (0.5 per cent) recorded y-o-y growth. The overall Kharif crop acreage remains 3.0 per cent below the levels recorded on the corresponding date of the previous year. 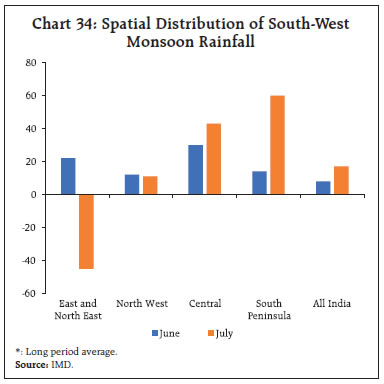 In Uttar Pradesh and West Bengal, the sowing deficit of paddy is likely to recover on normal rains forecast in August whereas in Bihar and Jharkhand, rainfall during the month is likely to remain below normal (Chart 35b). These four states contribute 33 per cent of the national production of kharif rice. In case, the south-west monsoon rain fails to catch up with the LPA within the sowing time frame, irrigation support would be critical to rice output (Chart 36a). Although irrigation is accessible in more than 50 per cent of the rice sown area in these states [except for Jharkhand (4.6 per cent)], the actual water availability in many of the irrigation structures depends on the rainfall volume. This is reflected in low reservoir levels in the eastern regions of the country (Chart 36b).17 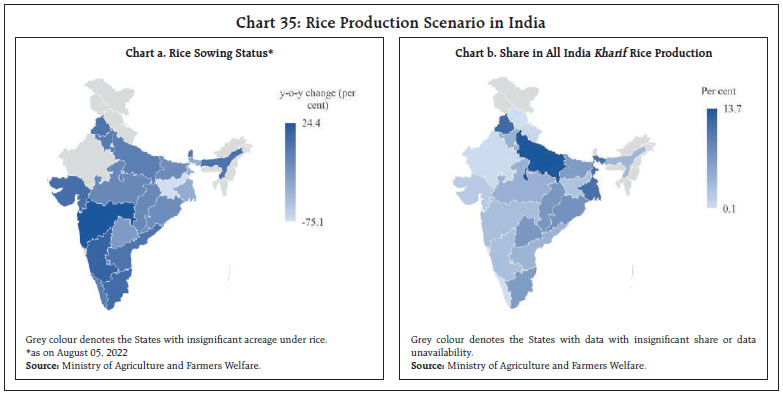 As per the 2nd Advance Estimates (AE)18, the production of horticultural crops during 2021-22 is placed at a record 341.6 million tonnes, 2.1 per cent higher than the final estimate for 2020-21, driven mainly by higher production of total fruits and vegetables (Chart 37). The overall productivity (production/area) of the horticulture sector has increased by 1.1 per cent in 2021-22. While the growth in production of fruits is expected to increase in terms of area (1.3 per cent on y-o-y basis) and productivity (3.2 per cent), the growth in vegetable production is likely to be led by a 3.9 per cent increase in area (productivity has declined by 1.7 per cent). 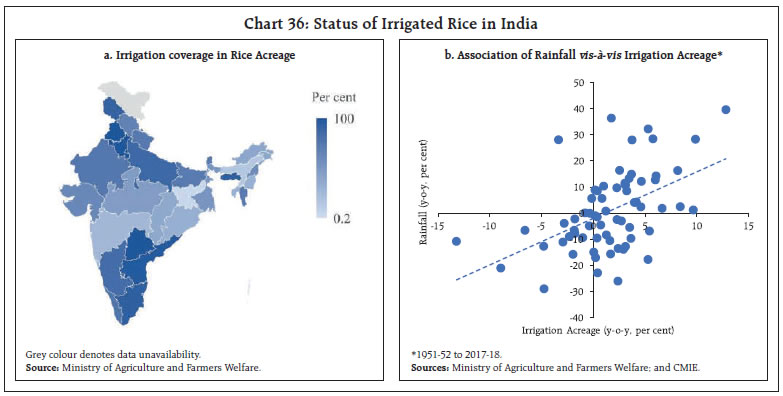
 Wheat procurement for the current Rabi marketing season (2022-23) ended at 18.8 million tonnes, which is 57.7 per cent of the initial target (44.4 million tonnes) and 5.1 per cent lower than the revised target (19.5 million tonnes). As on August 11, 2022, the cumulative procurement of rice at 59.1 million tonnes was marginally higher than in the previous year (58.6 million tonnes). The stocks-to-norm ratio of rice is 3.0 times higher than the quarterly (July- September) buffer norms, while in the case of wheat it has dipped marginally below the norm. Restrictions on wheat exports in May 2022 have been buttressed by restrictions on export of maida, semolina and all variants of wheat flour (atta), effective from August 14, 202219. The export of these items would now be allowed only after the issuance of Quality Certificate by the Export Inspection Council of the Directorate General of Foreign Trade. In the industrial sector, the headline manufacturing PMI expanded strongly to 56.4 in July, the highest expansion in the past eight months. This was led by an increase in output, new orders and input stocks, highlighting the strengthening of demand conditions (Chart 38a). PMI Services, on the other hand, decelerated from an 11-year high of 59.2 in June 2022 but remained expansionary at 55.5 in July. The growth in the services sector was led by new businesses although inflationary pressures on inputs remained high, undermining future business expectations (Chart 38b). In the services sector, transport indicators continued to show an upturn as railway freight traffic earnings rose by 8.3 per cent (y-o-y) in July 2022, (Chart 39a). While coal and POL freight recorded sharp growth, iron ore and food grains went into contraction. Cargo traffic at major ports accelerated in July, owing to an increase in POL, raw fertilizers, thermal coal and other liquids, which together account for 58 per cent of total cargo (Chart 39b). In the construction sector, activity continued on an uptrend in June-July 2022, with cement production and steel consumption recording growth over pre-pandemic levels for seven straight months (Chart 40). Cement production moderated in June with the onset of the monsoon. The outlook for the sector, remains positive, however, with a focus on infrastructure spending. 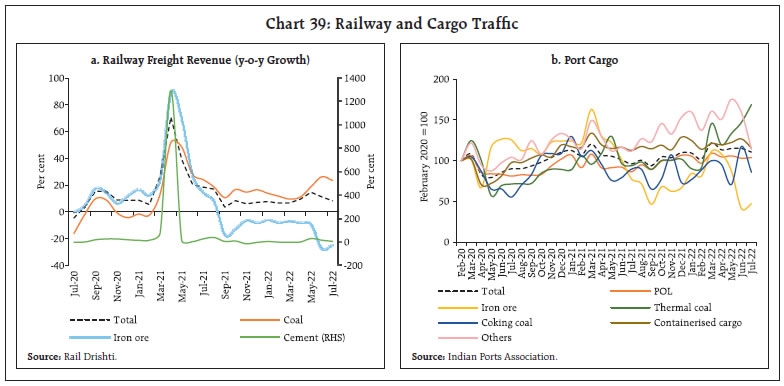  The dip in domestic passenger footfalls in June continued in July, with passenger movement contracting by 8.9 per cent sequentially in the monsoon season. Other segments of international passenger traffic and domestic and international cargo recorded growth over June. In the first ten days of August, activity in the domestic passenger segment contracted sequentially, but the international passenger freight segment remained stable. The cargo segment declined for both domestic and international categories as monsoons impeded trade and travel activity. With the removal of the cap on air fares, introduced to curb sudden price movements during the pandemic, post August 31, air travel may pick up in sectors where market pricing may incentivise bookings. Overall, the services sector remained resilient in June with seasonal factors dampening activity. With contact intensive aviation and tourism sectors gaining traction, the fall in demand due to rising prices may have been cushioned (Table 3).
Inflation The provisional data released by the National Statistical Office (NSO) on August 12, 2022 showed that inflation, measured by y-o-y changes in the all-India consumer price index (CPI), eased to 6.7 per cent in July from 7.0 per cent in the previous month (Chart 41a). A month-on-month (m-o-m) increase in momentum by 46 bps was more than offset by a favourable base effect (m-o-m change in prices a year ago) of 74 bps, leading to the decline in headline inflation by 30 bps between June and July. This fall stemmed from a reduction in the contribution of the food and beverages group (Chart 41b). The m-o-m increase in prices was of the order of 0.1 per cent within the food and beverages group, 2.0 per cent for the fuel group and 0.6 per cent for the core CPI (excluding food and fuel) category. At the sub-group level, price increases in July were significant in the case of fruits, eggs and spices and education whereas prices declined in the case of oils and fats, and meat and fish (Chart 42). The sharp moderation in CPI food inflation to 6.7 per cent in July from 7.6 per cent a month ago came from a strong favourable base effect of 86 bps which was partially offset by an increase in price momentum of 6 bps. In terms of sub-groups, inflation softened in the case of meat and fish, milk, edible oils, vegetables and non-alcoholic beverages (Chart 43). On the other hand, inflation edged up in cereals, fruits, pulses, sugar, spices and prepared meals. Deflation in eggs moderated in July vis-à-vis June.
Inflation in the fuel and light category edged up from 10.1 per cent in June to 11.8 per cent in July. This was led by a sharp pick-up in kerosene inflation while electricity prices remained in deflation. The fuel group with a weight of 6.8 per cent in the CPI basket contributed 11.9 per cent of headline inflation in July. Core CPI inflation plateaued at 6.0 per cent in July. While sub-groups such as clothing and footwear and education registered an increase in inflation, transport and communication and personal care and effects sub-groups witnessed moderation (Chart 43). Inflation in pan, tobacco and intoxicants, housing, recreation and amusement, household goods and services and health sub-groups remained more or less steady. Within the core category, goods inflation moderated in recent months with the easing of supply chain pressures as reflected in fall of index of supply chain pressures for India (ISPI)20. On the other hand, services inflation edged up (Chart 44). In terms of geographical distribution, rural inflation at 6.8 per cent was higher than urban inflation (6.5 per cent) in July. Among the states, Telangana, Mizoram and Sikkim experienced inflation in excess of 8 per cent whereas Goa and Manipur recorded inflation below 4 per cent (Chart 45). High frequency food price data for August so far (August 1-12) from the Department of Consumer Affairs (DCA) point to an increase in prices of cereals, primarily on account of a surge in wheat prices. Pulses prices have registered a broad-based increase while edible oils prices are on a decline. Among key vegetables, potato and onion prices have edged up, while tomato prices continued to exhibit a sharp downward correction (Chart 46). Retail selling prices of petrol and diesel in the four major metros have remained steady in August so far. In Maharashtra, petrol and diesel prices were lower by ₹5/litre and ₹3/litre, respectively, with effect from July 15 as the state government reduced the value added tax (VAT). Kerosene prices have moderated sharply in August vis-à-vis July while LPG prices edged up marginally during the same period, both reflecting changes in administered prices (Table 4). Input cost pressures increased at a slower pace in July 2022 across manufacturing and services, as reflected in the PMIs. Selling prices also firmed up at a slower pace across manufacturing and services. | Table 4: Petroleum Product Prices | | Item | Unit | Domestic Prices | Month-over- month (per cent) | | Aug-21 | Jul-22 | Aug-22^ | Jul-22 | Aug-22 | | Petrol | ₹/litre | 103.03 | 103.49 | 102.92 | -0.7 | -0.5 | | Diesel | ₹/litre | 93.32 | 93.06 | 92.72 | -0.4 | -0.4 | | Kerosene (subsidised) | ₹/litre | 34.29 | 71.44 | 62.73 | 15.2 | -12.2 | | LPG (non- subsidised) | ₹/cylinder | 857.22 | 1055.19 | 1063.25 | 4.1 | 0.8 | ^: For the period August 1-12, 2022.
Note: Other than kerosene, prices represent the average Indian Oil Corporation Limited (IOCL) prices in four major metros (Delhi, Kolkata, Mumbai and Chennai). For kerosene, prices denote the average of the subsidised prices in Kolkata, Mumbai and Chennai.
Sources: IOCL; Petroleum Planning and Analysis Cell (PPAC); and RBI staff estimates. |
IV. Financial Conditions Daily average absorption under the liquidity adjustment facility (LAF) moderated to ₹2.7 lakh crore during July 16 to August 15, 2022 from ₹4.0 lakh crore during June 8 to July 15 (Chart 47). In recent weeks, ₹1.5 lakh crore has been absorbed through the overnight standing deposit facility (SDF) window on a daily average basis, while the remaining has been mopped up through variable rate reverse repo (VRRR) auctions (both main and fine-tuning) of longer tenor at an average effective absorption rate21 of 4.92 per cent. Muted government spending in the face of buoyant GST and direct tax collections contributed to the decline in overall surplus liquidity in the banking system. The Reserve Bank’s forex operations, which mopped up rupee liquidity, also contributed to tightening of liquidity conditions. Accordingly, as GST collections exited the banking system, borrowing from the Reserve Bank’s marginal standing facility (MSF) window rose to ₹59,312 crore (outstanding amount) on July 25 – the highest since April 1, 2019 (₹94,263 crore). To alleviate pressures, the Reserve Bank conducted a three-day variable rate repo (VRR) auction on July 26, 2022 for a notified amount of ₹50,000 crore which received bids of about ₹1.52 lakh crore (bid-cover ratio of more than 3). The subsequent 14-day VRRR auction (main operation) on July 29 elicited a lukewarm response – only ₹12,712 crore of bids were received against the notified amount of ₹2.0 lakh crore. 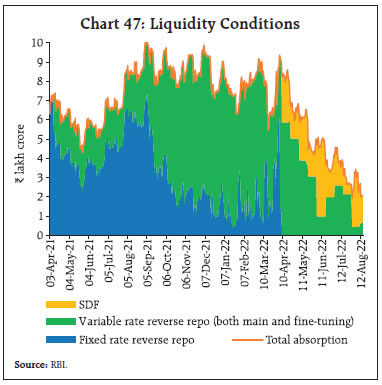 In tandem with the increase in the policy rate on August 5, overnight money market rates firmed up, with rates in the collateralised segment breaching the upper band of the LAF corridor intermittently. On an average basis, the weighted average call rate (WACR) and the market repo rate traded closer to the repo rate while the tri-party repo rate traded 8 bps below the policy repo rate during the second half of July through August 12, 2022 (Chart 48a). In the term money market segment, the yield on 3-month T-bills surged to a 3-year high, trading above the MSF rate for a brief period. Similarly, yields on 3-month certificates of deposit (CDs) and 3-month commercial paper (CPs) hardened further, with average spreads of 46 bps and 70 bps, respectively, above the MSF rate during the second half of July through August 12, 2022 (Chart 48b). In view of bank deposit growth lagging credit offtake, banks increasingly resorted to CDs for additional resource mobilisation, with outstanding CD issuances amounting to ₹2.5 lakh crore in the fortnight ending July 29, 2022. Primary market activity in CPs remained tepid as a sharp rise in interest rates weighed on investors’ appetite. Consequently, outstanding CP issuances declined to ₹3.7 lakh crore as on July 31, 2022 as compared with ₹4.7 lakh crore a year ago. During 2022-23 so far (up to August 12, 2022), the effective policy rate has increased by 180 bps,22 and the WACR has mirrored it, firming up from 3.27 per cent on April 7, 202223 to 5.17 per cent on August 12, 2022. Similarly, the rates in the outer money market segments increased in the range of 173 to 196 bps (Table 5).
Table 5: Variations in Money Market Rates
(As on August 12, 2022 over the Respective Period)
(in bps) | | Period | Repo | WACR | 3 Months T-bill Rate | 3 Months CD Rate | 3 Months CP Rate | | 04-Aug-22 | 50 | 58 | 0 | 6 | 15 | | 07-Jun-22 | 100 | 106 | 54 | 58 | 60 | | 03-May-22 | 140 | 152 | 146 | 174 | 185 | | 07-Apr-22 | 140 | 190 | 166 | 202 | 202 | | 31-Mar-22 | 140 | 161 | 173 | 196 | 185 | | Sources: RBI; and Bloomberg. | In the fixed income market, bond yields extended a softening bias during the second half of July but hardened briefly, with the repo rate hike on August 5. The 10-year G-sec yield closed at 7.29 per cent on August 12, easing from 7.44 per cent on July 15, 2022. While the rise in crude oil prices and the sharp depreciation of the Indian rupee (INR) propelled the initial surge in yields, it softened thereafter with the sharp decline in US treasury yields. Across the yield curve, yields generally declined for securities up to 15 year maturity (Chart 49a). The spread between the 2-year G-sec and 3-month T-bill yields moderated further, reflecting the impact of monetary tightening and resulting in a decline in curvature24 (the yield curve became less hump-shaped) (Chart 49b). While are upward shift in the level of the yield curve coexists with a declining slope (as measured by the 10-year and 2-year spread) since April, a perceptible decline in curvature that is evident since the May policy meeting is indicating the diffusion of the impact of monetary tightening across various maturity segments. 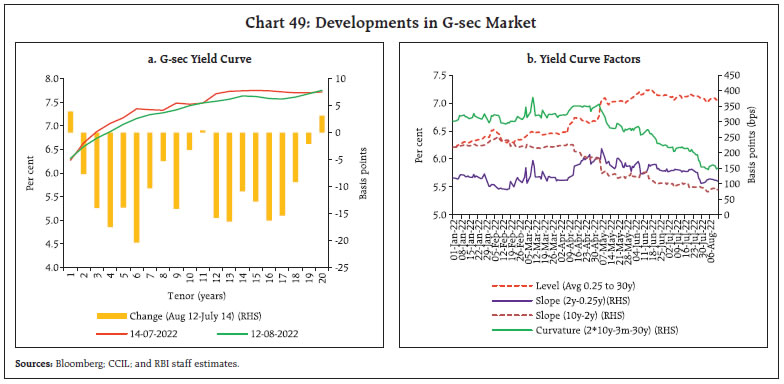
| Table 6: Financial Markets - Rates and Spread | | Instrument | Interest Rates (per cent) | Spread (bps) (Over Corresponding Risk-free Rate) | | June 8- Jul 15 2022 | Jul 16 - Aug 11 2022 | Variation (in bps) | June 8- Jul 15 2022 | Jul 16 - Aug 11 2022 | Variation (in bps) | | 1 | 2 | 3 | (4 = 3-2) | 5 | 6 | (7 = 6-5) | | Corporate Bonds | | | | | | | | (i) AAA (1-yr) | 6.61 | 6.63 | 2 | 31 | 27 | -4 | | (ii) AAA (3-yr) | 7.47 | 7.33 | -14 | 40 | 41 | 1 | | (iii) AAA (5-yr) | 7.56 | 7.51 | -5 | 19 | 30 | 11 | | (iv) AA (3-yr) | 8.18 | 8.05 | -13 | 112 | 113 | 1 | | (v) BBB-minus (3-yr) | 11.86 | 11.73 | -13 | 480 | 481 | 1 | | 10-yr G-sec | 7.45 | 7.27 | -18 | | | | Note: Yields and spreads are computed as monthly averages.
Source: FIMMDA; and Bloomberg. | Corporate bond yields generally softened across tenors and the rating spectrum, in tandem with G-sec yields (Table 6). The credit risk premium – as reflected in the spread of yields on corporate bonds over G-sec yields of comparable maturities – increased marginally as risk aversion rose on fears of mark-to-market losses. This prompted large borrowers to approach the banking system for meeting their funding requirements. Reserve money (RM) excluding the first-round impact of the cash reserve ratio (CRR)25 grew by 8.0 per cent on a y-o-y basis as on August 5, 2022 (10.9 per cent a year ago). Currency in circulation (CiC) – the largest component in RM – registered a growth of 8.2 per cent (10.0 per cent a year ago) [Chart 50]. Money supply (M3) grew by 8.6 per cent as on July 29, 2022 (9.9 per cent a year ago), with its largest component – aggregate deposits with banks – also growing at the same pace as a year ago (9.8 per cent). Scheduled commercial banks’ (SCBs’) credit growth, which has been consistently rising since February 2022, grew at 14.5 per cent y-o-y as on July 29, 2022 (6.1 per cent a year ago). Among various sectors, credit flow to the micro, small and medium enterprises (MSMEs) sector remained buoyant. According to the latest SIDBI-TransUnion CIBIL MSME Pulse Report, total credit disbursements to MSMEs increased by about 43 per cent in Q4:2021-22.26 Bank credit to medium industries grew by 47.6 per cent in June 2022 on top of a growth of 59.0 per cent a year ago. Bank credit growth to micro and small industries accelerated to 29.6 per cent in June 2022 from 11.6 per cent in June 2021.  Banks have adjusted their repo linked benchmark lending rates upward during April to July 2022, in line with the cumulative hike of 90 bps in the policy repo rate up to June. Furthermore, the 50 bps repo rate hike in the August policy meet has been transmitted to the repo linked lending rates of the majority of the domestic banks, while others are considering adjustments soon. During April-July 2022, SCBs have increased their 1-year median marginal cost of funds-based lending rates (MCLRs) by 40 bps. The weighted average lending rate (WALR) on fresh and outstanding rupee loans increased by 8 bps and 14 bps, respectively. The weighted average domestic term deposit rate (WADTDR) on outstanding deposits increased by 6 bps (Table 7). The extent of pass-through is higher for lending rates vis-à-vis retail term deposit rates as the latter are dependent on demand for credit as well as liquidity conditions in the banking system.27 As liquidity in the system has started normalising, banks have started raising their bulk deposit rates aggressively. While the median term deposit rate on retail deposits increased by 14 bps, banks have increased their bulk deposit rates significantly in the current tightening period. If overall transmission to term deposit (including retail and bulk deposits) is considered, it is comparable to transmission to lending rates. | Table 7: Transmission from the Repo Rate to Banks’ Deposit and Lending Rates | | (Variation in Basis Points) | | Period | Repo Rate | Deposit Rates | Lending Rates | | Median TDR (Fresh Deposits) | WADTDR (Out- standing Depos- its) | 1–Year MCLR (Median) | WALR (Fresh Rupee Loans) | WALR (Out- standing Rupee Loans) | | April-July 2022* | 90 | 14 | 10 | 40 | 31 | 19 | | Memo | | | | | | | | April 2022 | 0 | 0 | 0 | 0 | -12 | -2 | | May 2022 | 40 | 0 | 4 | 3 | 35 | 7 | | June 2022 | 50 | 3 | 6 | 20 | 8 | 14 | | July 2022 | - | 0 | - | 12 | - | - | | | | (-2 to 27) | | (-20 to 20) | | | Note: Fiigures in parentheses indicate a range of bank-wise variations for domestic banks.
* Data on WALRs and WADTDR pertains to June 2022.
WALR: Weighted average lending rate; WADTDR: Weighted average domestic term deposit rate.
MCLR: Marginal cost of funds-based lending rate; TDR: Term deposit rate.
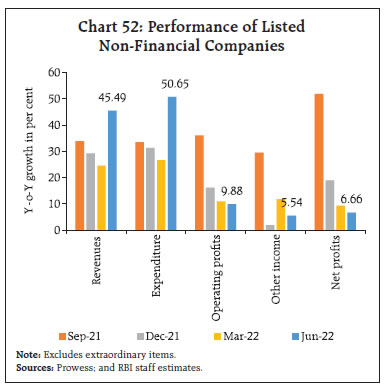
Source: RBI staff estimates. | The interest rates on various small savings instruments (SSIs) have been left unchanged for the last nine quarters (up to Q2:2022-23). With the upward movement in G-Sec yields, the spread between the existing interest rates on various SSIs and the formula-based rates is now negative for most small saving schemes. In the equity market, the benchmark index (BSE Sensex) increased by 8.6 per cent in July, registering its highest monthly gain since August 2021. Most of the uptick was recorded during the second half of the month amidst robust corporate earnings, resurgence in foreign portfolio flows, positive global cues and moderation in crude oil prices. The market was also supported by the announcement of a reduction in the windfall tax on exports of domestically produced crude oil, diesel and aviation fuel. The equity market continued its upward trajectory in August, with the BSE Sensex increasing by 3.9 per cent (up to August 16, 2022) amidst upbeat domestic manufacturing data and decline in crude oil prices. In July 2022 and August so far, foreign portfolio investors (FPIs) turned net buyers again in Indian equities (Chart 51). The corporate sector delivered firm earnings in Q1:2022-23; with profit growth riding out headwinds from rising input costs. Non-financial companies recorded y-o-y growth in excess of 40 per cent in revenues/sales as well as expenditures (Chart 52).28 The growth in expenditure outpaced that of revenue, which was reflected in raw material costs registering an uptick during the quarter.29 Wages and salaries also registered double digit growth. Growth in operating profits (y-o-y) remained a tad below the double digit mark. Other income, which includes earnings from treasury operations, recorded a modest increase. Furthermore, interest expenses of companies increased during the quarter. Overall, net profit growth (y-o-y) remained in single digit, registering some moderation from the previous quarter. 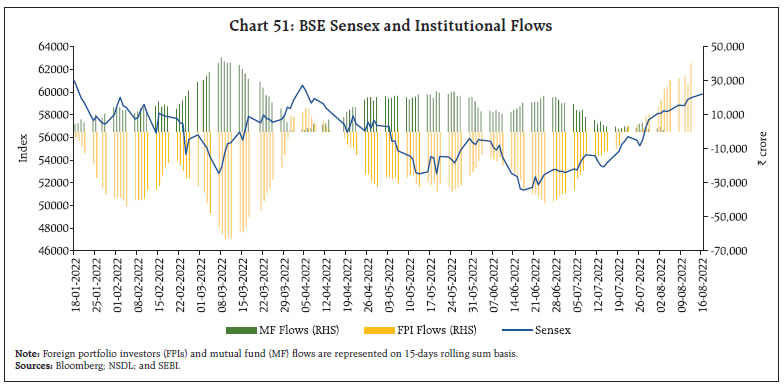
 Banking and financial sector companies recorded double digit growth in revenues – which primarily include interest income – aided by a pickup in credit growth (Chart 53).30 Other income, which inter alia includes profit/loss from security transactions, fees and commissions, registered a decline following mark-to-market losses on investments. Expenditure grew at a lower rate than revenues; however, a fall in other income led to a moderation in y-o-y growth in operating profits. There was, however, a decline in provisioning costs as a result of which net profits for banking and financial sector companies grew in excess of 50 per cent during Q1:2022-23. Gross inward foreign direct investment (FDI) at US$ 22.3 billion in Q1:2022-23 was broadly comparable with its level a year ago. Net FDI, however, increased to US$ 13.6 billion during this period from US$ 11.6 billion a year ago on account of an increase in fresh equity inflows and a decline in outward FDI from India (Chart 54). Manufacturing, services, and retail and wholesale trade sectors received the major share of FDI equity inflows during April-June 2022.
Investment by FPIs in equities led to net inflows of US$ 0.5 billion in July 2022 and US$ 4.7 billion in August 2022 (up to 12th) even as equity markets in major emerging market economies (EMEs) such as Indonesia, Philippines, South Africa, Taiwan, and Turkey recorded net outflows (Chart 55). Financial services, fast moving consumer goods (FMCGs) and power sector attracted FPI inflows. At US$ 3.6 billion, gross disbursements of external commercial borrowings (ECBs) to India remained at the same level in Q1:2022-23 as a year ago. Excluding inter-company borrowings however, ECBs recorded net repayments of US$ 3.3 billion during this period as against net disbursements of US$ 0.2 billion in the first quarter last year. In June 2022, a major share of ECBs has been raised for the purpose of on-lending/sub-lending, infrastructure development and working capital. More than two-thirds of the outstanding ECBs remain effectively hedged in terms of explicit hedging, rupee denominated loans and loans from foreign parents (Chart 56). The remaining amount also included loans with natural hedges (i.e., borrowers’ earnings are in foreign currency), limiting the exposure to currency volatility.
At US$ 573.0 billion, foreign exchange reserves on August 5, 2022 were equivalent to 9.4 months of imports projected for 2022-23 (Chart 57). In the foreign exchange market, the strengthening US dollar continued to put pressure on EME currencies. On average, the Indian rupee (INR) depreciated by 1.9 per cent vis-à-vis the US dollar (m-o-m) in July 2022, even as the US dollar index appreciated by 2.9 per cent. Nevertheless, the Indian rupee performed better than most major EME currencies (Chart 58). The INR depreciated by 0.4 per cent in terms of the 40-currency real effective exchange rate (REER) in July 2022, showing a relatively higher depreciation in currencies of India’s major trading partners vis-à-vis the US dollar (Chart 59).
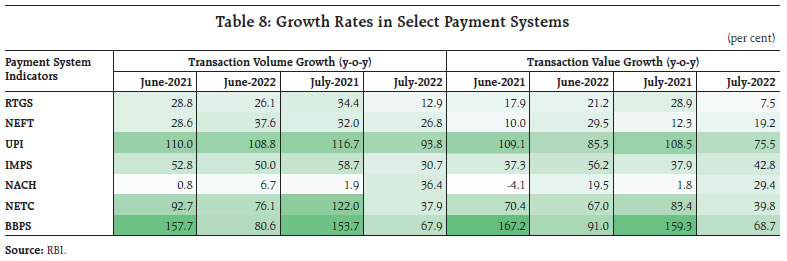
Payment Systems The Reserve Bank’s Digital Payments Index rose to 349.30 in March 2022, a growth of 14.8 per cent over September 2021. In terms of both volume and value growth, digital payments across various modes sustained a rising trajectory in July 2022 (Table 8). The Unified Payments Interface (UPI) dominated retail payments, with a share of 70 per cent in overall retail transactions volume in June 2022 (59.4 per cent a year ago) (Chart 60). This uptick was also evident in the share of UPI transaction by value, which increased by 4.8 percentage points to reach 19.5 per cent. There was a discernible escalation in the growth rate of transactions through the National Automated Clearing House (NACH) in July 2022 owing to government transfers. 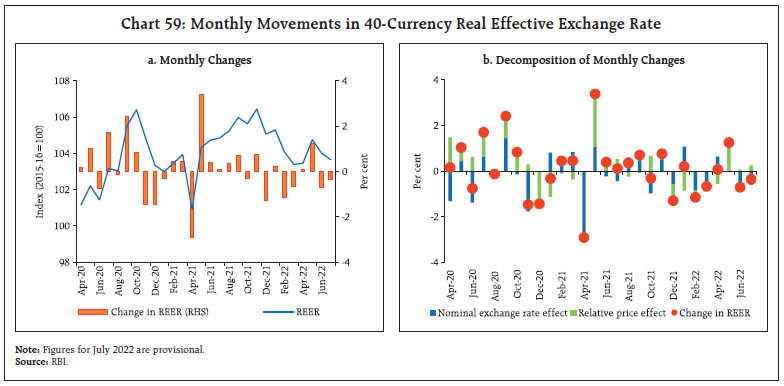
 The Reserve Bank has proposed to link UPI and Rupay Credit cards to widen the choice of payment avenues and enhance convenience for more than 26 crore unique UPI users31. This initiative should give a fillip to UPI Person-to-Merchant (P2M) transactions, which stood at ₹769 per transaction in July 2022. It will also contribute to the rising share of P2M transactions in total UPI transactions32 while enabling adoption of UPI across businesses with multiple use cases for merchants like overdraft facilities, capture and hold facility, and invoicing support. Reflecting the significant achievements in tokenisation, around 20 crore cards – about a fifth of outstanding cards – across card networks have been tokenised since December 2021.33 Furthermore, the Reserve Bank relaxed card-on-file data storage norms related to guest accounts on e-commerce platforms. In the Monetary Policy Statement of August 5, 2022 it has been proposed to enable Bharat Bill Payment System (BBPS) to accept cross-border inward payments to facilitate non-resident Indians’ (NRIs) utility, education, and other bill payments on behalf of their families in India. Efforts towards fostering sound and reliable innovations while encouraging efficiency in financial services are bearing fruit, with four out of eight entities successfully exiting the second cohort of the Reserve Bank’s Regulatory Sandbox on cross-border payments. In addition, the Reserve Bank announced arrangements for invoicing, payment, and settlement of exports/imports in INR to encourage exports from India and reinforce the interest of traders across the globe in the INR as an international currency.34  V. Conclusion To conclude on a positive note, perhaps the most heartening development in recent times has been the easing of inflation in July 2022 by 30 basis points from June 2022 and an appreciable 60 basis points from the average of 7.3 percent for Q1:2022-23. This has validated our hypothesis that inflation peaked in April 2022. For the rest of the year, the RBI’s projections scent a steady easing of the momentum of price changes. With the trajectory of outcomes largely in line with projections, we expect momentum to ease from 3.0 per cent in Q1 to 1.7 per cent in Q2 and further to 1.3 per cent in Q3 and turn mildly negative in Q4 before picking up modestly and on seasonal food price effects to 2.2 per cent in Q1: 2023-24. Fortuitously, base effects are favourable all through. If these expectations hold, inflation will fall from 7 to 5 per cent in Q1 next financial year - within the tolerance band, hovering closer to the target, but not yet positioned for landing. This is a decisive point in its trajectory. Imported inflation pressure points remain the overarching risk, followed by pending pass-through of input costs if producers regain pricing power, and wages. Yet, some risks have turned down - commodity prices, especially of crude; supply chain pressures; revving up of monsoon activity due to the depression in the Bay of Bengal. After Q1: 2023-24, the task before the MPC would be to guide inflation to its target of 4 percent. This may prove to be more arduous than the loss of height into the tolerance band. The next heartening development is the return of capital flows to India after a hiatus when the appetite of portfolio flows to EMEs deteriorated as the US dollar appreciated breathlessly with the US Fed accelerating its hiking cycle. Since March 2022, the Institute of International Finance estimates that portfolio investors withdrew US$ 39.3 billion from EMEs, partly offset by inflow of US$ 4.6 billion in the debt segment.35 Yet, investors appear to have differentiated. While commodity exporting EMEs, viz., Brazil, Saudi Arabia, Indonesia, Malaysia, Colombia and Chile benefitted from portfolio inflows into equities, exposures were cut down for China, India and Turkey. In the debt segment, China recorded the largest outflow among EMEs while other EMEs together recorded net inflows. India is becoming a preferred destination for portfolio flows - in August so far (until 12th), equity and debt segments recorded net inflow of US$ 4.4 billion and 0.3 billion, respectively. What is the outlook for these fickle flows? EMEs face the passive investor syndrome - exchange traded funds, index driven funds and such vehicles into which investors repose confidence in savvy fund managers out of the best business schools who are also the most sensitive to global spillovers. The IMF estimates that the response of passive portfolio flows to a one standard deviation shock to the interest rate has gone up six times now from that at the time of the taper tantrum.36 Tightening of global funding conditions as monetary policy is front loaded is hence expected to worsen the outlook for portfolio flows. India is cautiously returning to be the flavour of this season’s portfolio flows, with inflows of US$ 5 billion upto August 12, 2022. The market value of portfolio investments in India stood at US$ 623.8 billion on August 12, 202237. In this context, the capital flows at risk assessment presented in the June 2022 issue of this Bulletin provides vital insights. By assigning specific probabilities to capital flow events of various magnitudes- inflows and outflows - it can contribute to contingency planning. To illustrate, the model indicates that there is a 5 per cent chance of outflows of the order of US$100.6 billion of portfolio investment from India due to the interplay of what are called push and pull factors. This is the actual experience of the current phase of outflows during October 2021 to June 2022. “This is indicative of the level of liquid reserves that need to be maintained at all times – in addition to standard metrics of import and debt servicing cover – to quell bouts of instability that volatile capital flows can impose in a dynamic and highly uncertain global setting in which pandemics, supply chain disruptions, and elevated commodity prices and geopolitical tensions keep interacting and intertwining” (Patra et al., 2022)38. Deepening domestic financial markets can help countries mobilise savings, promote information sharing and diversify risk while dampening the volatility of asset prices. According to the IMF, interventions can lean against market illiquidity, and thus, play a role in muting excessive volatility. Capital outflow management measures should be a part of a broad policy package without avoiding macroeconomic adjustment wherever warranted. Debt management strategies are important for EMEs in view of their limited access to global financial markets. Hence, active strategies are called for in minimising market and rollover risks. Macro prudential policies can reduce the impact of shocks on market conditions and the economy. In the final analysis, India is poised to sustain a growth differential vis-a-vis the rest of the world on the basis of several fundamental factors: a demographic dividend alluded to in the July edition of this article; expansion in the availability of capital with increasing formalization of the economy and digital financial inclusion - adaptation into the digital payment space has already accounted for India logging the largest number of real time transactions in the world; the financialisation of savings as retail participation in capital markets grows; a sounder and fitter banking system with stronger balance sheets and a return to profitability. All these factors coming together could unleash a jump in productivity going forward. The challenges before us are to regain the momentum lost to the pandemic and the shocks that followed in its train, close the infrastructure gap, build a high quality labour force and gain an outward orientation that expands the markets for our products, our professionals and business presence beyond national boundaries and on to the world stage. India’s time has arrived. We must seize the initiative with both hands.
|