Notwithstanding headwinds of COVID-19, India’s inward remittances have proven to be a resilient source of current account receipts. In this article cross-country remittances inflows are found to be driven by altruism motive, captured by the infection rate in the destination country and the stringency of the lockdown in the source countries. The fifth round of the survey on remittances for the reference period 2020-21 finds that the share of Gulf countries has declined, reflecting slower pace of migration and presence of Indian diaspora in informal sectors which was hit the most during the pandemic period. Further, the impact of COVID-19 led stressed income conditions was discernible as small size transactions gained share in total remittances in 2020-21. The divergence was also reflected in the bank-group wise transactions as public sector banks lost market share while private banks retained their dominance in remittances business. 1. Introduction Remittances are the second major source of external financing for low and middle-income countries after foreign direct investment. Its effect on household income and contribution to financial asset building to improve people’s quality of life is well recognised in the literature (Azizi, 2021; Basnet et al., 2021; Ogunniyi et al., 2020). Defying adverse predictions of unprecedented global recession triggered by COVID-19, remittances have proved to be resilient during the pandemic (Kpodar et al., 2021; World Bank, 2021a). According to the World Bank Report on Migration and Remittances (World Bank, 2021b), remittance flows to low and middle-income countries declined marginally to US$540 billion in 2020, only 1.6 per cent below the US$548 billion in 2019. India, being the top recipient country, was expected to be one of the worst affected (projected decline of 23 per cent) (World Bank, 2020) as its host country basket was vulnerable to the twin effect of economic slowdown and slump in oil prices. Defying the early projections, however, India remained the top recipient country, accounting for 12 per cent of total global remittances, recording a marginal decline of 0.2 per cent in 2020 and a growth of 8 per cent in 2021. Recent research has largely focused on analysing the pattern of cross-country remittances and the impact of COVID-19 on the actual volume of remittances (Kpodar et al., 2021; World Bank, 2021). However, there is limited empirical research on the resilience of remittances during the pandemic. This paper attempts to address this gap. First, it identifies the factors determining the resilience of remittance inflows using a sample of 49 countries. Second, based on the data reported under the ‘Fifth round of Remittance Survey’ for 2020-21, the paper validates the macro findings and insights on various aspects of remittances. The rest of the paper is organised as follows. Section 2 models the resilience of remittances using a sample of 49 major recipient countries. Section 3 presents the survey results based on data reported by 84 Authorised Dealers (ADs) and 3 Money Transfer Operators (MTOs) regarding the characteristics and pattern of remittances received in India during 2020-21, i.e., COVID-19 period. Section 4 sets out concluding observations and policy inferences. 2. Global Scenario: Resilience against COVID-19 Stylised facts In the last decade, remittance flows to emerging market economies (EMEs) have steadily increased (Chart 1). In fact, remittances have exceeded foreign direct inflows in several countries, including India, Philippines, Pakistan and Bangladesh, accounting for about 3 per cent of GDP in low-income and 1.6 per cent of GDP in middle-income countries (Chart 2). In several major recipient countries, the flow of remittances has remained resilient in 2020 and increased in 2021(Chart 3). However, quarterly growth variations can be seen since the onset of COVID-19 in India and Indonesia (Chart 4). India showed a net drop in remittances between Q2:2020 to Q4:2020, with a rebound from Q1:2021. In the case of India, remittances dwindled on year-on-year (y-o-y) basis during Q2 to Q4 of 2020 but rebounded since Q1 of 2021.
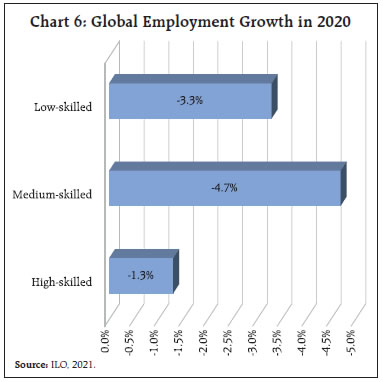
The United Arab Emirates (UAE), the Unites States of America (USA) and Saudi Arabia have been the three major destinations of Indian migrants for the past two decades. Out of the total migrants from India, 48.6 per cent were in the UAE, the USA and Saudi Arabia as at end 2020 (Chart 5). From the perspective of global remittances, however, the impact of the pandemic on migrants has varied across regions. Strict lockdown measures disproportionately impacted sectors with high reliance on migrant labour than others in certain economies. Migrants employed in low-skilled professions in countries with high level of informality were particularly vulnerable due to lower savings and limited access to social security. Further, the global employment declined more for women, youth, low-skilled and medium-skilled population with low-wage workers affected disproportionately by the pandemic in 2020 (International Labour Organisation, ILO, 2021) (Chart 6). Even after almost two years since the onset of the pandemic, the employment recovery has remained fragile and quite divergent across country groups (Chart 7). The growth across regions was primarily driven by high productivity sectors and high wage earners, indicating a compositional shift across regions. 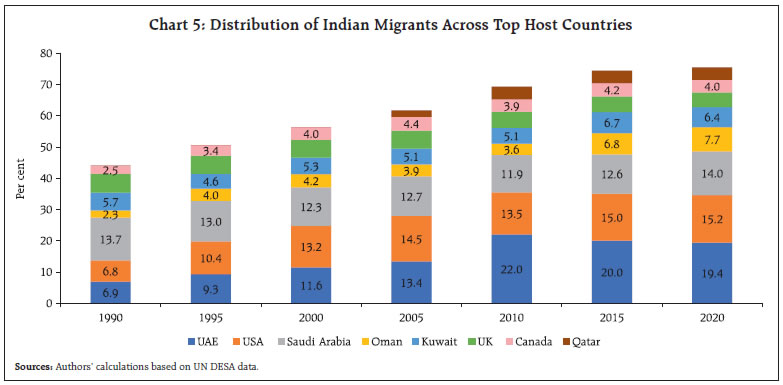
 India’s geographical pattern of migration has been historically dominated by the Gulf Cooperation Council (GCC) region. While the share of migrant stock in AEs, particularly the US, the UK, Canada and South Africa has been around 30 per cent, the India-Gulf corridor remained the second highest migrant corridor with a combined share of 28 per cent. Despite the continued dominance of the GCC corridor, the migration pattern to the GCCs has changed significantly with a sharp contraction in the number of emigration clearances (ECs) issued since 2015, generally issued to unskilled or semi-skilled workers and women seeking overseas employment (Table 1). Notwithstanding that India remained the largest source of international migration in 2020, migration from India to the GCCs slowed in the last five years due to economic slowdown, sluggish oil prices, stricter labour laws, introduction of nationalisation policies, higher work permit renewal fees and taxes. These factors coupled with pandemic induced travel restrictions and changes in the region’s labour market reduced the employment opportunities and dented the scope for absorption of blue-collar workers (Chart 8 and Table 1). 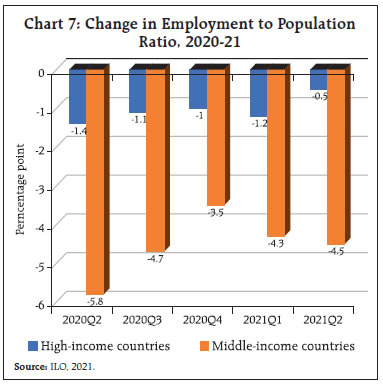 The compositional shift in India’s migration towards AEs, notably, the US, the UK, Canada and South Africa dominated by high-skilled white-collar workers augurs well for total remittance inflows. However, the potentiality of the severe adverse impact on India’s low-wage low-skilled workers from the successive waves of the pandemic and the uneven economic recovery in the low and middle-income countries may have long-term implications for remittances inflows. Factors influencing remittances during COVID-19 period While the contractionary effect of COVID-19 was much milder than anticipated in the initial phase of COVID-19, there was wide variation across recipient economies. Kpodar et al. (2021) argues that a positive association between remittance inflows and COVID-19 infection rate in the home country would support the hypothesis that migrants’ altruism or the insurance motive has played a role in the strong resilience of remittance inflows observed so far. This argument is consistent with the countercyclical nature of remittances, as it has been evidenced during periods of recessions, financial crises, food price shocks and natural disasters (Combes et al., 2014; De et al., 2019; Frankel, 2021.; Kpodar et al., 2021). However, as a counter-argument, evidences suggest that the increase in remittances in Mexico from the USA, during the initial few months of COVID-19, was partially due to a shift in remittances from informal channels to formal ones and thus the role of fiscal stimulus at the host country and altruism in boosting remittance inflows to home country is ruled out (Dinarte et al., 2022). In the following discussion, an empirical analysis is attempted to examine the relative importance of various factors that might have influenced remittances during the COVID-19 period. | Table 1: India's Emigration to the GCC Region | | (in Lakhs) | | GCCs | 2015 | 2017 | 2019 | 2020 | | Saudi Arabia | 3.1 | 0.8 | 1.6 | 0.4 | | UAE | 2.3 | 1.5 | 0.8 | 0.2 | | Kuwait | 0.7 | 0.6 | 0.5 | 0.1 | | Oman | 0.9 | 0.5 | 0.3 | 0.1 | | Qatar | 0.6 | 0.2 | 0.3 | 0.1 | | Bahrain | 0.2 | 0.1 | 0.1 | 0.0 | | Total | 7.6 | 3.7 | 3.5 | 0.9 | | Source: Based on emigration clearance data, MEA, Government of India. | Data and Variables Internationally comparable quarterly data on remittances is sourced from the Balance of Payments Statistics (BOP) of the International Monetary Fund (IMF). This study uses ‘personal transfers’ component of the BOP as an estimate of remittances inflow. An unbalanced panel dataset comprising quarterly data of 49 countries for the period Q1:2020 to Q2:2021 is used1. COVID-19 related impact was evident in the majority of the sample countries, albeit most of them recovered in subsequent quarters. Nevertheless, remittances in 13 sample countries were yet to recover to their pre-pandemic levels by Q1:2021 (Chart 9). The dependent variable (DEV_REMGR) is the deviation of remittance growth (y-o-y) calculated taking 2019 as the base for quarterly flows during the study period. In other words, the dependent variable captures the remittance performance of each sample country relative to its pre-pandemic period. The independent variables include Herfindahl–Hirschman index of diversification of migrants across host countries (HHI)2, per capita GDP of host countries (PCGDP), global oil prices (OLPRC), cost of receiving remittance equivalent to US$ 200 (REMITCOST), average stringency index in major ten host countries (STRING) and infection rate in home country (INFEC). The details of data sources and summary statistics is given in Appendix Table A2 and A3, respectively. Empirical models This section focuses on the pandemic period (January 2020 through June 2021) and adopts the following models to explain developments in remittances in Asia. Where, sample countries i= 1 to 49, time period t =1 to 6 and w is the weight (i.e., share) of each of top 10 remittances sending country (p=1 to 10) in the total remittance inflows of the host country. This model (Eqn. 1) is estimated using a panel data regression model with country fixed effects. To capture the effect of diversification of diaspora, HHI is included in a random effect model that allows for the inclusion of time-invariant factors. To verify the robustness of the results, this paper uses the positive deviation of quarterly remittances growth from its trend growth as the dependent variable and estimates the following panel logit regression (Eqn. 2). When yit=1, when the country reports a higher quarterly y-o-y growth of remittances than the average annual trend growth rate for the last five years. Results The results show that in the country fixed effect (FE) model, the economic soundness of the host country as reflected by PCGDP is positive and significant. This also supports the anecdotal evidence that fiscal stimuli provided in various recipient countries might have improved disposable income levels of overseas workers and migrants, which aided remittances flows. However, PCGDP becomes insignificant in the random effect model. Results also shed light on the negative effect of the stringency index on the hardship of migrant workers, implying more stringent lockdown norms in host countries impacted flows of remittances. On the other hand, the paper finds a positive and significant effect of home infection rate on the deviation of remittance growth. It implies that countries with a severer impact of COVID-19 received greater support than others for family maintenance from the overseas diaspora. This finding validates the altruism motive of remittances. Further, the country FE estimation results presented in Table 2 column 2 are broadly consistent and strengthen the results obtained by adding HHI without FE in column 3. The model does not find HHI as a significant factor influencing remittances during the COVID-19 period. The coefficient of remittance cost, oil prices, and the exchange rate movements, the standard factors determining inward remittances during normal periods, are found to be statistically insignificant in the model. The results in Table 1 are also consistent with those in Appendix Table A4. | Table 2: Factors Explaining Remittance Performance-Regression Results | | (1) | (2)
Country Fixed Effect Model | (3)
Random effect Model | | | DEV_REMGR | DEV_REMGR | | PCGDP | 1.454** | 0.0909 | | | (0.665) | (0.138) | | REMITCOST | 0.0160 | -0.00322 | | | (0.0178) | (0.0114) | | INFEC | 0.0310*** | 0.0295*** | | | (0.00630) | (0.00588) | | STRING | -0.00346*** | -0.00335*** | | | (0.000926) | (0.000921) | | DEV_EXCR | 0.171 | 0.118 | | | (0.268) | (0.189) | | OILPRC | 0.000344 | 0.000399 | | | (0.00110) | (0.00108) | | HHI | | 0.152 | | | | (0.138) | | Constant | -15.24** | -0.926 | | | (6.948) | (1.452) | | Observations | 271 | 271 | | Prob > F | 0.000 | 0.000 | | Number of countries | 49 | 49 | Standard errors in parentheses.
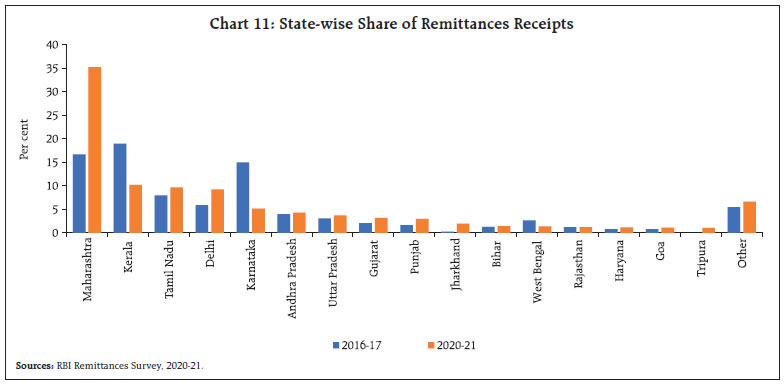
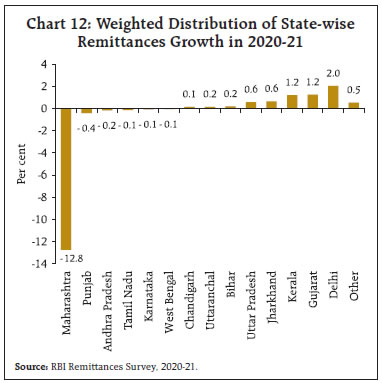
*** p<0.01, ** p<0.05, * p<0.1. | 3. India’s Remittances: Insights from the Fifth Round of the Survey While India’s inward remittances remained resilient defying the crisis at the macro level, there has been significant changes in the geographical and socio-economic composition of remittances, driven by the home and host country crisis dynamics and the severity of the impact across different working class. To analyse the factors contributing to the resilience of remittances and to understand to what extent the pandemic has changed the underlying dynamics of remittances flow, the Reserve Bank of India conducted the fifth round of the Survey on Remittances for the year 2020-21 based on a census of all AD banks and major MTOs engaged in cross border transfer of funds. This round of the survey covered 98 ADs, of which response was received from 79 ADs accounting for 99.3 per cent of total amount reported under family maintenance and 3 MTO providers. The survey findings largely corroborate with the resilient trend in aggregate remittances but highlights the changes in the sources and destination pattern in 2020-21 and the varying impacts of the pandemic across banks and MTOs. As per the survey, the share of remittances from the GCC region in India’s inward remittances is estimated to have declined from more than 50 per cent in 2016- 17 (last surveyed period) to about 30 per cent in 2020- 21 (Chart 10 and Appendix Table A5). Amid steady migration of skilled workers, AEs, particularly the US, the UK and Singapore emerged as an important source country of remittances, accounting for 36 per cent of total remittances in 2020-21. The US surpassed the UAE as the top source country, accounting for 23 per cent of total remittances in 2020-21. This corroborates with the World Bank report (2021)3 citing economic recovery in the US as one of the important drivers of India’s remittances growth as it accounts for almost 20 per cent of total remittances. The share of the traditional remittance recipient states of Kerala, Tamil Nadu and Karnataka, which had strong dominance in the GCC region, have almost halved in 2020-21, accounting for only 25 percent of total remittances since 2016-17, while Maharashtra has emerged as the top recipient state surpassing Kerala. (Chart 11 and Appendix Table A6). Apart from the host country dynamics, reducing wage differentials, changing occupational patterns in these states with increasing white collar migrant workers to GCC region and entry of low-wage semi-skilled workers from other states and Asian countries may have led to this compositional shift. By contrast, migration from Uttar Pradesh, Bihar, Orissa and West Bengal to the Gulf countries has increased in recent years. According to the Ministry of External Affairs data, more than 50 per cent of the approved emigration clearances for GCC region in 2020 were for these states. With the dominance of low-wage unskilled labourers, however, their share in remittances has remained significantly low while the share of Maharashtra and Delhi has increased significantly in 2020-21. Nevertheless, Maharashtra, being one of the worst affected states with the largest number of COVID-19 affected population and prolonged lockdown phases impacting mobility of return migrants and economic and business operations, witnessed the sharpest decline in remittances in 2020-21(Chart 12). 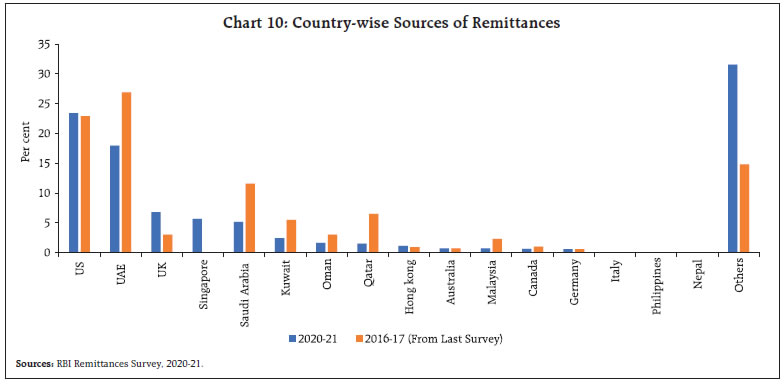
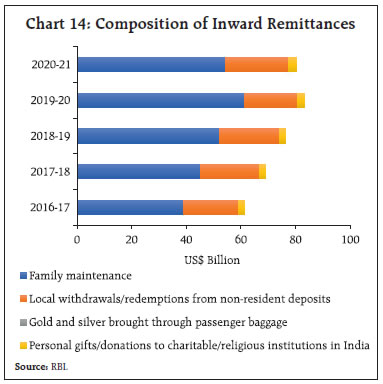
 One of the compensatory forces which is argued to have assisted in a steady flow of remittances in 2020-21 is the savings brought in due to return migration during the pandemic, reflecting a temporary frontloading of remittances by migrants which may not sustain if the pandemic related economic stress persists in the long run (Kpodar et al. 2021). In India, while the deposits from overseas Indians in NRI deposit schemes are treated as capital account transactions, local withdrawals/redemptions from NRI deposits (especially NRE and NRO rupee deposit schemes) are treated as forming part of private transfers (Balance of Payments Manual, RBI, 2010).4 While NRI deposits are empirically found to be driven by exchange rate and interest differentials, trend in NRE account, which is typically used for parking income from abroad by non-resident Indians in INR, witnessed a sharp spike in the consecutives waves of the pandemic (Chart 13). Apart from favourable yields, deposits in the NRE accounts increased significantly during this period as returning overseas migrants amidst layoffs and heightened uncertainty regarding their return and future employment prospects repatriated their savings into these accounts. While overseas remittances for family maintenance, representing a major chunk of India’s in-bound remittances (Appendix Table 7), moderated with loss of overseas employment opportunities; local withdrawals from non-resident rupee denominated deposit accounts increased implying the drawdown of savings to tide through the crisis (Chart 14). 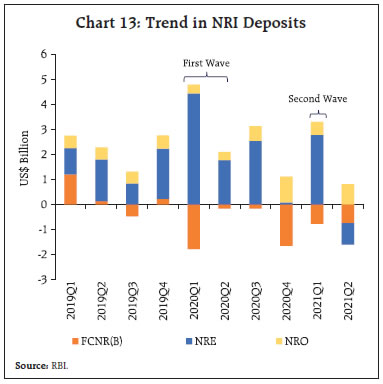
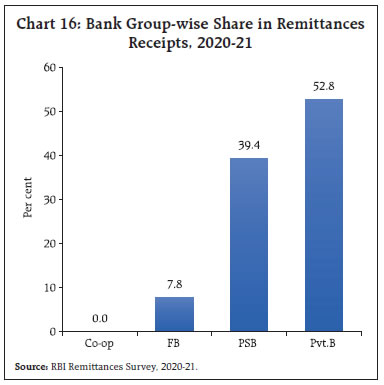
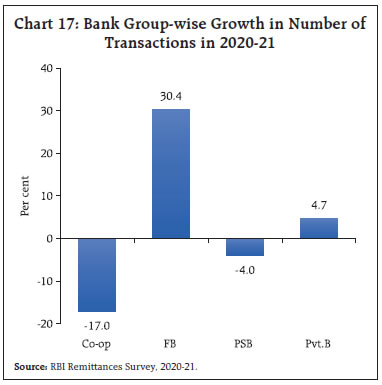
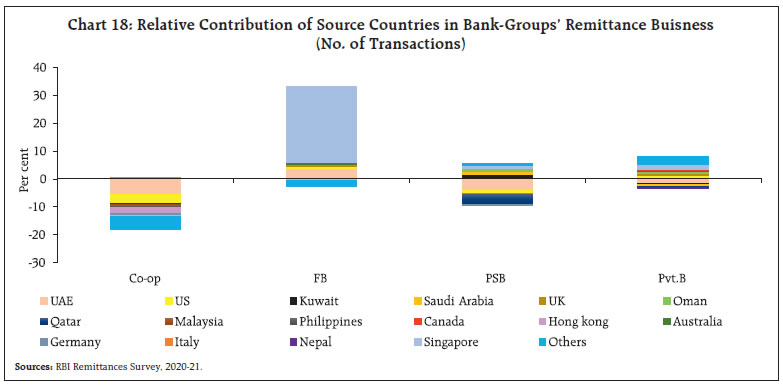
 A more disaggregated state-level withdrawal also corroborates the compensatory effect of savings on the financial stress caused by moderation in remittances for family maintenance in most states (Chart 15). Heterogeneous impact on banks’ remittances transactions The impact of slowdown in remittances has been quite diverse across banks. While public sector banks (PSBs) and cooperative banks (CoBs) suffered loss of business, reflected in lower number of transactions, private sector banks (Pvt.Bs) and foreign banks (FBs) improved their market share as private banks retained their market leadership followed by PSBs and FBs (Chart 16 and 17 and Appendix Table A8). Improved market share of Pvt.Bs can be attributed to their source-country balanced portfolio as decline in remittances from Gulf countries was offset by increased flows from AEs including the US, the UK and Singapore. The share of FBs increased to 9.8 per cent in 2020-21 from 7.5 per cent in 2019-20 driven by sharp increase in remittances from Singapore which more than outweighed almost static or lower inflows from other source countries. On the other hand, the decline in remittances business of PSBs was primarily driven by lower receipts from Qatar and the UAE, which outweighed improved transactions in other countries (Chart 18). Incidentally, In September 2021, the Reserve Bank and the Monetary Authority of Singapore (MAS) have initiated integration of India’s Unified Payments Interface (UPI) with PayNow, Singapore’s fast payment system to facilitate faster, efficient and transparent cross-border transactions relating to trade, travel and remittances between the two countries (RBI, September 2021)5. 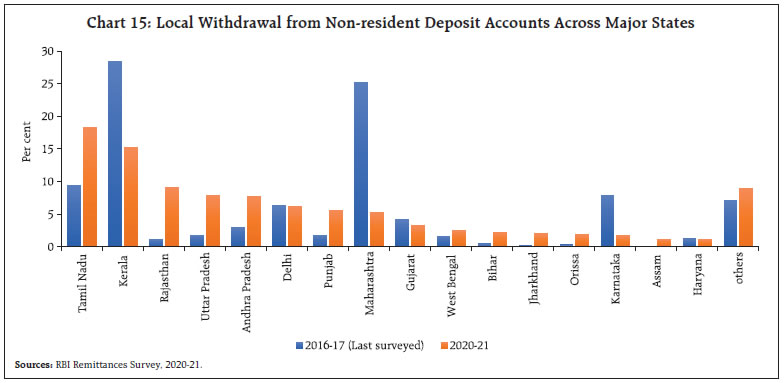
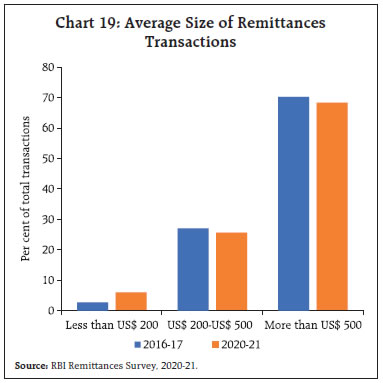 The signs of financial distress among remitters were evident in the increase in smaller denominated transactions (i.e., less than US$ 200) in 2020-21 (Chart 19 and Appendix Table A9). While the increase in small size transactions may be due to the reduced sending capacity of the overseas remitters, it might also be indicative of more frequent financial support required by their low-income beneficiaries during the pandemic period. The variation is more prominent across bank groups depending on their remitter country, income profiles and business channels (Chart 20). This has been corroborated by the heterogeneous impact on the average size profile of transactions across bank groups. In the case of PSBs, a shift from large size transactions to small and medium size is evident in 2020-21, while private sector banks have not only been able to retain their largest market share (in terms of value) but also recorded higher transactions in 2020-21 as compared with 2019-20 reflecting economic rebound mainly in advanced economies. 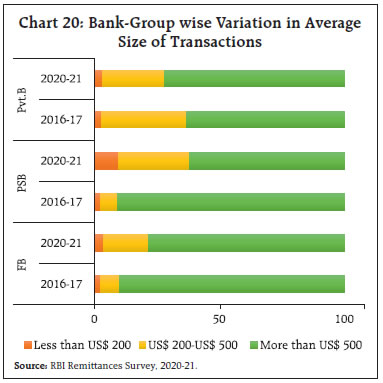 Cost of Remittances The global average cost of remittances remains above the SDG target at 6.3 per cent and 5.0 per cent for US$ 200 and US$ 500 respectively in Q2 2021, the level, however, has come down since 2017 (World Bank, 2021)6. The global trend is mirrored in the G20 countries as the average cost of remitting to the G20 has remained mostly below the global average for both denominations in recent years. The cost of sending remittances to the major G20 countries, however, varies with Mexico being the cheapest corridor followed by India with a below average cost of remittances (Chart 21 and 22). The survey, however, reveals wide divergence in the cost structures of bank groups, largely depending on the business channels and their tie-ups with overseas banks/entities. While for private banks, the cost of remittances has gone up across all sizes of transactions and not much variation is observed within the Pvt.B group, the PSBs have reported larger variation across countries with lower charges normally accruing to the GCC region and neighbouring countries like Nepal, while higher cost charged mostly in the case of Singapore, the US and Hong Kong. Similar cost pattern was reflected in large denominations as well, but the level is much lower than small size transactions (Table 3). Foreign banks, though accounting for a smaller share of India’s remittances accounts, have reduced their cost structure quite significantly in 2020-21 as compared with 2016-17, albeit with larger cross-country variations. This has augured well for improving their share in remittances transactions in 2020-21 despite the global turmoil. 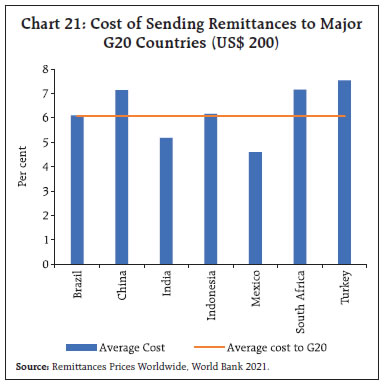

| Table 3: Maximum Charges by Bank Groups across Countries | | (Per cent) | | Amount | Year | PSB | Pvt. B | FB | | US$ 200 | 2016-17 | 4.4 | 12.6 | 13.3 | | | 2020-21 | 2.8-11.3 | 19.7 | 0.8-11.8 | | US$ 500 | 2016-17 | 2.5 | 5.1 | 6.2 | | | 2020-21 | 1.1-4.5 | 13.3 | 0.3-4.7 | Note: 1. The composition of banks in each group varies across years.
2. Since there is wide variation across countries, the maximum amount is taken here.
3. Cost includes GST.
4. The maximum cost range is given where the bank-wise cross-country cost variation is high.
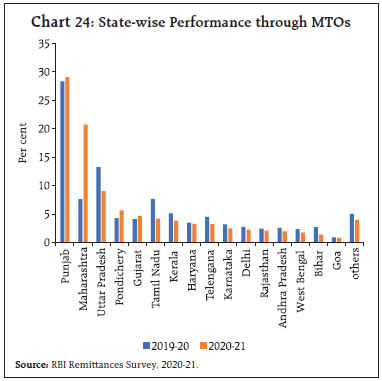
Source: RBI Remittances Survey, 2020-21. | As reported by ADs, a major portion of remittances continues to be received under Rupee Drawing Arrangements (RDAs) through the Rupee Vostro Account of Exchange Houses (Appendix Table 10). Money Transfer Operators (MTOs) The dominance of MTOs as a non-banking entity in the remittances business has gained due to their business and cost structures which are often found to be very competitive and people friendly (Jain et al., 2018)7. While from supply side, greater adoption of digital technologies has given MTOs the ability to respond to the increased digital demand during the current COVID-19 crisis, the societal effect of lockdown has been a great accelerator of change, driving the customer demand towards online transactions (Webber, 2020). Recognising their growing role in the remittance transactions, the Reserve Bank has allowed MTOs to offer digital products in conjunction with banks to facilitate more seamless transactions. In November 2021, the RBI announced issuance of pre-paid instruments by banks and authorised non-bank entities, appointed as Indian agent of overseas principal, to beneficiaries of remittances under the Money Transfer Service Scheme (MTSS) (RBI, 2021).8 MTO transactions also mirrored global slowdown recording a decline of about 25 per cent business in 2020-21, primarily driven by top few entities. Overseas labour migration pattern and diverse host country experiences of MTOs corroborated the bank-wise pattern as the decline was primarily driven by sharp fall in remittances from the UAE and Saudi Arabia, accounting for about 10 per cent of the total fall in MTO remittances transaction in 2020-21 (Chart 23). The state-wise pattern also highlighted the losing dominance of Southern states like Kerala, Karnataka and Tamil Nadu and growing share of Punjab, Maharashtra and Uttar Pradesh as new destinations mirroring the changing labour migration pattern (Chart 24). 
 According to the World Bank report and a few other studies (Dinarte et al., 2021, Kpodar et al., 2021), the resilience of remittances in some countries, despite a sharp decline in economic growth was more on account of a shift towards the official banking channel transactions. Remittances transactions through MTOs in India also reflected a similar pattern in 2020-21 as the dominance of cash transactions moderated with a significant shift towards direct transfers through bank accounts (Chart 25 and Appendix Table A11).
| Table 4: Cost of Sending Remittances to India through MTOs | | (per cent) | | Amount Sent (US$) | Year | Avg. Cost * | Range | | 200 | 2016-17 | 1.9-4.0 | 0-11.1 | | | 2020-21 | 1.7-2.0 | 0-12.6 | | 500 | 2016-17 | 1.0-2.4 | 0-7.1 | | | 2020-21 | 0.9-1.1 | 0-10.2 | Note: 1. *Depending on the mode of transfer, upper band for cash and lower band for direct bank transfer.
2. Data based on available data from 3 major MTOs.
Source: RBI Remittances Survey, 2020-21. | The pandemic period also witnessed a significant reduction in the average cost of remittances across the major MTOs (Table 4). Growing competition in the market with entry of new entities, slowdown in business during the lockdown and shifting to digitalised transactions are the primary reasons for such decline which augurs well for remittances. The upper limit for the average cost across various modes have almost halved for both US$200 and US$500 in 2020-21 as compared with the last surveyed year (2016-17). This is corroborated by the World Bank International MTO Index which tracks the prices of MTOs that are present in major corridors. According to the June 2021 data, there has been considerable moderation in the sending cost of both US$ 200 and US$ 500 since 2017 (Chart 26). 4. Conclusion While the COVID-19 pandemic has raised concerns regarding cross country labour mobility and prompted discussions on migrants’ vulnerability in source countries, this article captures the dynamics of remittance flows to India during the pandemic period. Based on the ‘Fifth Round of the Survey on Remittances’ for reference period 2020-21, a few major inferences can be drawn. First, evidence on fall in the remittances from the Gulf region is in line with the global employment dynamics as Indian diaspora working in informal sectors in the Gulf region seems to have been impacted the most inter alia due to lockdown restrictions, and subdued crude oil prices and slower pace of migration in the recent years. Second, stressed income conditions are discernible from small size transactions gaining share in total remittances during the pandemic period. Third, notwithstanding sharp decline in remittances to Maharashtra in 2020- 21, it has emerged as the top recipient state along with Delhi apart from the traditional states of Kerala and Tamil Nadu which have witnessed gradual decline in recent years. Fourth, majority of the remittances continues to be routed through private sector banks, followed by public sector banks although foreign banks have witnessed marginal increase in remittances transactions, particularly from Singapore. Fifth, the average cost of remittances charged by private sector banks increased as compared with the earlier survey, the cost structure for public and foreign banks have come down since the last surveyed period. Notwithstanding, India is the second cheapest remittance receiving market in the G20 group after Mexico, the cost for certain remittance corridors has been consistently higher than others. The policy measures need to be undertaken that expand the scope of MTSS in high-cost corridors. Further, remittance service providers need to adapt to the changing times by investing heavily in digital technologies. Efforts towards digital payment methods and integration with mobile and digital channels would not only help drop the cost of remittances but also bode well for virtual KYC by connecting the digital wallets of senders and recipients to their SIM cards. Policy environment also needs to facilitate domestic banks in taking a prudent view to facilitate MTOs’ access to correspondent banking. During the pandemic period, the World Bank (2021) has noted the phenomenon of de-risking among banks in certain jurisdictions which can potentially push-up costs of sending remittances. References: Azizi, S. (2021). The impacts of workers’ remittances on poverty and inequality in developing countries. Empirical Economics, 60(2), 969–991. https://doi.org/10.1007/s00181-019-01764-8 Basnet, H. C., Koirala, B., Upadhyaya, K. P., & Donou- Adonsou, F. (2021). Workers’ remittances and financial development: The case of South Asia. International Review of Economics, 68(2), 185–207. https://doi.org/10.1007/s12232-020-00359-5 Combes, J.-L., Ebeke, C. H., Etoundi, S. M. N., & Yogo, T. U. (2014). Are Remittances and Foreign Aid a Hedge Against Food Price Shocks in Developing Countries? World Development, 54, 81–98. https://doi.org/10.1016/j.worlddev.2013.07.011 De, S., Islamaj, E., Kose, M. A., & Reza Yousefi, S. (2019). Remittances over the business cycle: Theory and evidence. Economic Notes, 48(3). https://doi.org/10.1111/ecno.12143 Dinarte, L., Medina-Cortina, E., Jaume, D., & Winkler, H. (n.d.) (2022). Neither by Land nor by Sea: The Rise of Electronic Remittances during COVID-19. 41. Frankel, J. (2011). Are Bilateral Remittances Countercyclical? Open Economies Review, 22(1),1-16. Jain, R., Gajbhiye D., & Tewari, S. (2018). Globalising People: India’s Inward Remittances”, RBI Bulletin, Reserve Bank of India, November 2018. Kpodar, K., Quayyum, S., Gammadigbe, V., & Mlachila, M. (2021). Defying the Odds: Remittances During the COVID-19 Pandemic. IMF Working Papers, 2021(186), 1. https://doi.org/10.5089/9781513578453.001 Ogunniyi, A. I., Mavrotas, G., Olagunju, K. O., Fadare, O., & Adedoyin, R. (2020). Governance quality, remittances and their implications for food and nutrition security in Sub-Saharan Africa. World Development, 127, 104752. https://doi.org/10.1016/j.worlddev.2019.104752 Webber, Daniel (2020), “How Money Transfer Companies Squeezed Four Years of Digital Growth Into Just Two Months”, Forbes, https://www.forbes.com/sites/danielwebber/2020/05/28/how-money-transfer-companies-squeezed-four-years-of-digital-growth-into-just-two-months/?sh=6903b0d3a7b6. World Bank. (2020). COVID-19 Crisis Through a Migration Lens. Migration Development Brief,no. 32;. World Bank, Washington, DC License: Creative Commons Attribution CC BY 3.0 IGO World Bank. (2021a)”Remittances Prices Worldwide Quarterly- An Analysis of Trends in Cost of Remittances”, The World Bank Group, Issue 38, June 2021. World Bank. (2021b). “Migration and Development Brief 35: Recovery: COVID-19 Crisis through a Migration Lens”, KNOMAD-World Bank, Washington, DC. License: Creative Commons Attribution CC BY 3.0 IGO.
Appendix Tables | Table A1: List of selected countries | | Sl. | Country | Sl. | Country | | 1 | India | 26 | Ecuador | | 2 | Philippines | 27 | Uzbekistan | | 3 | Mexico | 28 | Brazil | | 4 | Nigeria | 29 | Jamaica | | 5 | Egypt, Arab Rep. | 30 | Haiti | | 6 | Pakistan | 31 | Croatia | | 7 | Bangladesh | 32 | Bulgaria | | 8 | Indonesia | 33 | Tajikistan | | 9 | Guatemala | 34 | Ghana | | 10 | Lebanon | 35 | Algeria | | 11 | Ukraine | 36 | Bosnia and Herzegovina | | 12 | Morocco | 37 | Georgia | | 13 | Sri Lanka | 38 | Armenia | | 14 | Nepal | 39 | Nicaragua | | 15 | Poland | 40 | Albania | | 16 | Thailand | 41 | Uganda | | 17 | Colombia | 42 | Belarus | | 18 | El Salvador | 43 | Azerbaijan | | 19 | Romania | 44 | Turkey | | 20 | Hungary | 45 | Ethiopia | | 21 | Jordan | 46 | Paraguay | | 22 | Honduras | 47 | Myanmar | | 23 | Czech Republic | 48 | Costa Rica | | 24 | Serbia | 49 | Panama | | 25 | Peru | | |
| Table A2: Variable Definitions and Source | | Variables | Definition | Source | | Inward Remittances | Only personal transfers component of balance of payments. | BOP, IMF | | Per capita Gross Domestic Product | GDP per capita is gross domestic product converted to international dollars using purchasing power parity rates. | World Development Indicators | | Infection rate | Number of new COVID confirmed cases per lakh population | Oxford COVID-19 Government Response Tracker | | Stringency Index | The stringency index is a composite measure based on nine response indicators including school closures, workplace closures, and travel bans, rescaled to a value from 0 to 100 (100 = strictest) | Oxford COVID-19 Government Response Tracker | | Remittance cost of US$ 200 | The transaction cost of receiving US$ 200 in the home country | World Bank | | Oil Prices | Global Crude oil prices based on Brent | US Energy Information Administration | | Exchange rate (LUC per US$) | Value of US$ of one unit of local currency | International Financial Statistics, IMF | | Herfindahl–Hirschman index of Migrants | Measures the diversification of migrants in remittance sending countries | Author’s estimation using bilateral remittance matrix, World Bank |
| Table A3: Summary Statistics | | Variable | Observations | Mean | Std. Dev. | Min | Max | | DEV_REMIT | 271 | 0 | 0.27 | -0.96 | 0.95 | | OILPRC | 271 | 48.81 | 11.87 | 31.42 | 68.62 | | REMITCOST | 271 | 5.84 | 2.27 | 0.98 | 12.18 | | INFEC | 271 | 620.24 | 960.55 | 0.02 | 5558.81 | | EXCR | 270 | 916.95 | 2756.88 | 0.71 | 14989.86 | | HHI | 271 | 0.33 | 0.25 | 0.09 | 1.00 | | PCGDP | 271 | 35753.35 | 8004.57 | 20163.38 | 56703.19 | | STRING | 271 | 61.43 | 14.38 | 23.57 | 89.23 |
| Table A4: Robustness check | | (1) | (2)
Logit Fixed effect | (3)
Logit Random Effect | | | POSDEV=1 | POSDEV=1 | | PCGDP | 1.487 | 0.400 | | | (32.54) | (1.339) | | REMITCOST | 0.349 | -0.0123 | | | (0.280) | (0.130) | | INFEC | 0.377*** | 0.333*** | | | (0.110) | (0.0975) | | STRING | -0.0355** | -0.0288** | | | (0.0154) | (0.0147) | | DEV_EXCR | -1.827 | 0.115 | | | (4.279) | (2.211) | | OILPRC | -0.0153 | -0.0219 | | | (0.0176) | (0.0167) | | HHI | | 1.614 | | | | (1.312) | | Constant | | -3.286 | | | | (14.02) | | Observations | 198 | 271 | | Number of Countries | 35 | 49 | Standard errors in parentheses
*** p<0.01, ** p<0.05, * p<0.1 |
| Table A5: Country-wise Share in Inward Remittances, 2020-21 | | Source Country | Share in Total Remittances (Per cent) | | United States | 23.4 | | United Arab Emirates | 18.0 | | United Kingdom | 6.8 | | Singapore | 5.7 | | Saudi Arabia | 5.1 | | Kuwait | 2.4 | | Oman | 1.6 | | Qatar | 1.5 | | Hong Kong | 1.1 | | Australia | 0.7 | | Malaysia | 0.7 | | Canada | 0.6 | | Germany | 0.6 | | Italy | 0.1 | | Philippines | 0.0 | | Nepal | 0.0 | | Others | 31.6 | | Total | 100.0 | | Source: RBI Remittances Survey, 2021. |
| Table A6: State-wise Share in Inward Remittances, 2020-21 | | Destination State | Share in total remittances (Per cent) | | Maharashtra | 35.2 | | Kerala | 10.2 | | Tamil Nadu | 9.7 | | Delhi | 9.3 | | Karnataka | 5.2 | | Andhra Pradesh | 4.4 | | Uttar Pradesh | 3.7 | | Gujarat | 3.2 | | Punjab | 3.0 | | Jharkhand | 1.9 | | Bihar | 1.4 | | West Bengal | 1.4 | | Rajasthan | 1.2 | | Haryana | 1.2 | | Goa | 1.1 | | Tripura | 1.1 | | Uttaranchal | 0.7 | | Madhya Pradesh | 0.5 | | Orissa | 0.5 | | Chandigarh | 0.4 | | Jammu and Kashmir | 0.3 | | Chhattisgarh | 0.3 | | Pondicherry | 0.2 | | Assam | 0.2 | | Himachal Pradesh | 0.1 | | Diu | 0.1 | | Arunachal Pradesh | 0.1 | | Others | 3.3 | | Total | 100.0 | Note: "Others" includes states with negligible shares including Daman, Sikkim, Manipur, Dadra Nagar Haveli, Nagaland, Meghalaya, Mizoram, Andaman and Nicobar, Lakshadweep and those remittances for which banks could not identify the specific destination.
Source: RBI Remittances Survey, 2021. |
| Table A7: Purpose of Remittances, 2020-21 | | Purpose of Remittances | Share in total Remittances (Per cent) | | Family maintenance (i.e., consumption) | 43.6 | | Deposits in Banks | 34.6 | | Investments (landed property /equity shares/etc.) | 10.2 | | Others | 11.7 | | Total | 100.0 | | Source: RBI Remittances Survey, 2021. |
| Table A8: Bank-wise Distribution of Inward Remittances, 2020-21 | | Bank Group | Share in Total Remittances (Per cent) | | Private Banks | 52.8 | | Public Sector Banks | 39.4 | | Foreign Banks | 7.8 | | Total | 100.0 | | Source: RBI Remittances Survey, 2021. |
| Table A9: Size-wise Distribution of Remittances, 2020-21 | | Size of Remittances | Share in Total Remittances (Per cent) | | Less than or equal to US$ 200 | 6.0 | | Between US$200 - US$500 | 25.7 | | Greater than or equal to US$ 500 | 68.4 | | Total | 100.0 | | Source: RBI Remittances Survey, 2021. |
| Table A10: Mode-wise Remittances Transfer, 2020-21 | | Mode of Transfer | Share in Total Remittances (Per cent) | | RDA/Vostro Account | 56.5 | | SWIFT | 41.2 | | Direct Transfer | 1.9 | | Others (including Cheque and draft) | 0.3 | | Total | 100.0 | | Source: RBI Remittances Survey, 2021. |
| Table A11: Mode-wise Transfer through MTOs, 2020-21 | | Mode of Transfer | Share in Remittances of MTOs (Per cent) | | Cash | 64.9 | | Direct Transfer to Bank Account | 35.1 | | Others | 0.01 | | Total | 100.0 | | Source: RBI Remittances Survey, 2021. |
|