Downside risks to global growth have accentuated with the risk of commodity price driven inflation turning more generalised. Despite global headwinds, domestic macroeconomic conditions continued to strengthen. With a growth rate of 8.7 per cent in 2021-22, India’s gross domestic product (GDP) surpassed its pre-pandemic (2019-20) level by 1.5 per cent and the recovery remains robust in 2022-23 so far. The y-o-y Consumer Price Index (CPI) inflation print for May was lower than the previous month after seven months of continuous rise. Introduction Since the publication of last month’s edition of the State of the Economy, domestic economic activity has been gaining traction in spite of formidable headwinds from external developments. The protracted war in Europe and resulting sanctions have kept global commodity prices elevated while dampening global trade and growth. Concurrently, the faster pace of monetary policy normalisation in response to record high inflation is heightening volatility in global financial markets. In its June 2022 issue of the Global Economic Prospects, the World Bank has cautioned that the combination of feeble growth and elevated inflation raises the risk of stagflation with potentially harmful consequences for low and middle-income countries.1 In the midst of these global adversities, the Indian economy is consolidating the path of recovery. Gross domestic product (GDP) for 2021-22 surpassed its pre-pandemic (2019-20) level by 1.5 per cent and activity is gaining strength in 2022-23 so far as gauged from high frequency indicators. In the job market, the unemployment rate dropped in May 2022 for both urban and rural constituents. Revenue collection under the goods and services tax (GST) stood at ₹1.4 lakh crore, reflective of the gathering pace of business activity. With inflationary pressures from firming global commodity prices becoming accentuated, the Government has taken a number of steps to ease domestic prices. They, inter alia, include export restrictions on wheat and sugar, cut in the import duty on edible oils, waiver of import duty on raw materials for steel industry and a cut in the central excise duty on petrol and diesel. The latest round of the inflation expectations survey (IES) of the Reserve Bank incorporated an extension survey of urban households undertaken after the excise duty cuts on petrol and diesel and the results show a significant moderation in their inflation expectations post the excise duty cut. Headline inflation breached the tolerance level of 6 per cent during 2022 so far. As the upside risks to inflation as highlighted in the April and May 2022 policies materialised earlier than anticipated both in terms of timing and magnitude, the Monetary Policy Committee (MPC) judged that further monetary policy measures are warranted to anchor inflation expectations. In his interaction with the press post the announcement of the monetary policy decision of June 8, 2022 to increase the policy interest rate by 50 basis points, Governor Shri Shaktikanta Das drew attention to a stark feature of recent inflation developments - “75 per cent of the increase in our inflation projection, compared to what we had made in April, is attributed to food inflation…primarily the food inflation spike is linked to external factors, namely, the war in Europe. He also stated that “we believe that our actions will have an impact on bringing down inflation and inflation expectations…. Inflation must come down. Economic recovery also must continue.” It is worthwhile to communicate with clarity as to what the RBI seeks to achieve with the recent monetary policy action. The idea is to share with the public a common set of expectations so that monetary policy serves as an anchor for the Indian economy. There is no doubt that the first impact of a food and fuel price shock to inflation lies outside the realm and remit of the RBI - especially with food and fuel prices constituting 60 per cent of the CPI and the food shock emanating from external sources, in this case, the war in Europe. But what happens next? First, households’ inflation expectations tend to be backward looking. They tend to look at recent food and fuel prices which are salient items in the average consumption basket and they form their opinion about what inflation would be in the future, say three months or a year from now. If households believe that inflation will go up and stay up, they are in effect saying that it is better to prepare for that difficult situation. Second, as households and firms increasingly share this view, they will build it into price mark-ups, wage negotiations, rents on houses, transportation costs and the prices of services more generally such as personal services like housekeeping, medical and education fees, entertainment and bus, train and auto fares. With households accounting for two third of India’s GDP in the form of private consumption expenditure, this will mean that inflation will become entrenched in the Indian psyche, and will become persistent and generalised. This would imply an adverse outlook for the economy. Businesses will stop investing, wages and costs will go up, export competitiveness will be damaged and savings in banks will be pulled out and put into assets like gold - that age old repository of value - which actually means capital flight from India since 98 per cent of gold demand is met from abroad for which foreign exchange has to be paid. Here comes the sun - monetary policy. Inaction by the Reserve Bank will be seen as accommodating the inflation shock and such a perception may lead to a belief that inflation is getting out of control. On the other hand, if the Reserve Bank increases interest rates and tightens monetary and liquidity conditions, it will (a) demonstrate that the RBI cares about people’s expectations and is determined not to let matters slip away; (b) anchor people’s faith in the RBI’s commitment to price stability and strengthen the foundations of growth; (c) prevent the second-round effects of food and fuel prices described earlier from getting entrenched; and (d) deter discretionary spending so that even if people’s spending on food and fuel goes up because of the price shock, they will adjust their expenditure on other items which will have a moderating impact on overall inflation. In effect, the RBI’s actions will cause inflation other than that related to food and fuel, or what is called core inflation, to ease and this will bring down headline inflation. Foreign investors are particularly sensitive to such monetary policy actions. They tend to see it as Indian policy authorities being resolute in their intent of protecting the value of Indian assets and so they will not pull out their investments in India and, in fact, they will invest more with the assurance of this intent to preserve macroeconomic and financial stability. Depreciation pressure on the rupee that is being experienced now will ease and this, in turn, will curb imported inflation. What the RBI is trying to do is to stabilise the price situation when the economy is able to bear it because in the longer run, price stability is beneficial for growth. The RBI kept interest rates and liquidity conditions low and easy through all of 2020-21 and 2021-22. The Indian economy registered a growth rate of 4.1 per cent as a result in the quarter January to March 2022, when several advanced and emerging economies fell into contraction. In the first quarter of 2022-23, available indicators of economic activity have strengthened. Unlike the rest of the world, India is recovering and getting resilient and stronger. This is the best time to put the stabilising effects of monetary policy into action so that the costs to the economy are minimised. Will these monetary policy actions exorcise the evil spirit of inflation? Who knows till when the war in Ukraine would last? But the RBI has to act. Monetary policy is usually unsung and unseen; but when the dark clouds gather over the Indian economy, the Reserve Bank has to rise from the anonymous depths it usually inhabits and act with everything at its command in defence of the Indian economy. This is the role of monetary policy. Set against this backdrop, the remainder of the article is structured into four sections. Section II captures the rapidly evolving developments in the global economy. An assessment of domestic macroeconomic conditions is presented in Section III. Section IV reviews financial conditions in India, while the last Section concludes the article. II. Global Setting The global economy remains on the edge as positive sentiments from improvements in supply chain pressures as well as relaxations in lockdown measures in some parts of the world are offset by continued commodity prices pressures and monetary policy tightening. In its latest Economic Outlook released on June 8, 2022, the Organisation for Economic Co-operation and Development (OECD) has revised down the global growth forecast for 2022 by 1.5 percentage points from its December 2021 projections (Table 1). The Global Economic Prospects of the World Bank released in June 2022 slashed global growth projection for 2022 down by 1.3 percentage points from its January release. 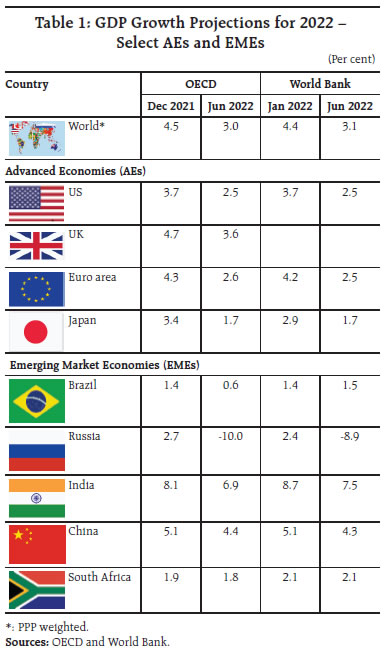 Among high frequency indicators, the global composite purchasing managers’ index (PMI) picked up marginally to 51.5 in May from 51.2 a month ago as growth of new business gained pace while new export business declined (Chart 1). The manufacturing PMI exhibited a modest increase whereas the services PMI remained unchanged at April’s three-month low of 52.2. Country-wise PMIs suggest that economic activity continued to expand in major economies of the world although the pace of expansion has moderated significantly in the US, Australia and the UK in recent months (Chart 2). There are also signs emerging that supply disruptions may be easing. The New York Fed’s global supply chain pressure index (GSCPI) eased in May, after having edged up in April (Chart 3).
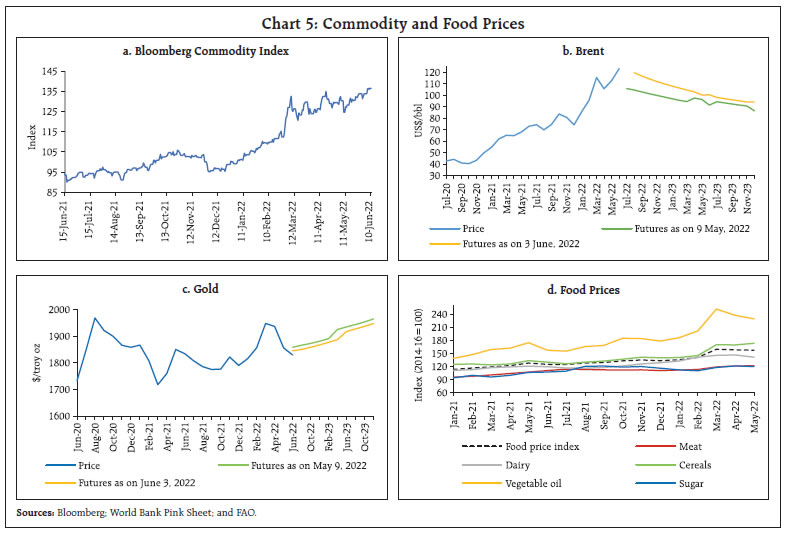
On the external front, the May 2022 release of the World Trade Organisation’s Goods Trade Barometer - a forward-looking composite of real-time indicators - remained flat at 99.0 for March 2022 (previous reading of 98.7 for February) and below the baseline value of 100. The growth of merchandise trade volume decelerated to 2.5 per cent (y-o-y) in March from 6.2 per cent in February on a negative monthly momentum as well as an unfavourable base effect (Chart 4a). The Baltic Dry Index − a measure of shipping charges for dry bulk commodities − increased by 6.7 per cent in May. The trajectory, however, remains volatile with a sharp increase in the first half of the month followed by moderation in the last week (Chart 4b). The Bloomberg commodity price index hit a fresh 8-year high in early June (Chart 5a). Crude oil prices gained momentum, averaging US$ 123 per barrel in June 2022 (till June 6) due to extremely tight supply conditions amidst soaring demand as mobility restrictions eased in China and the European Union’s sanctions targeting Russian oil imports likely to take full effect by the end of the calendar year. Crude prices have notched up a 60 per cent gain year to date (up to June 6, 2022). The Organization of the Petroleum Exporting Countries (OPEC) plus’s agreement to accelerate output increases over the next two months could not provide any significant breather to rising prices as Saudi Arabia sharply increased prices for its crude sales in July, highlighting extremely low inventories (Chart 5b). Gold prices faced headwinds as bond yields hardened and the US dollar strengthened (Chart 5c). The Food and Agriculture Organization (FAO) food price index retreated marginally for the second successive month to 157.4 in May from the all-time high registered in March due to moderation in vegetable oil and dairy prices while meat and cereal prices continued to increase (Chart 5d). Despite a correction by about 9 per cent over March 2022 levels, the vegetable oil index remained higher by 32 per cent above its levels witnessed in May 2021. 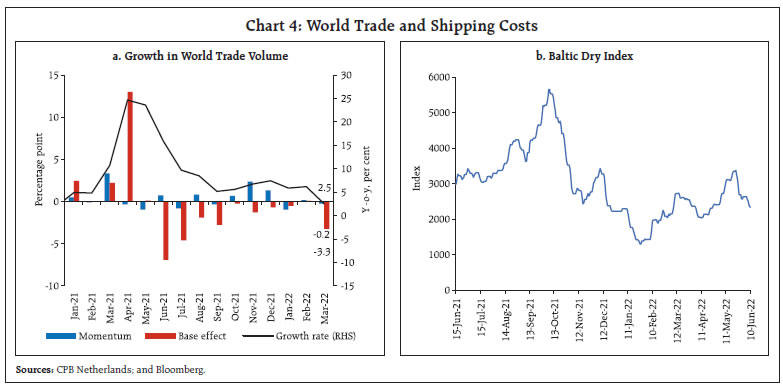
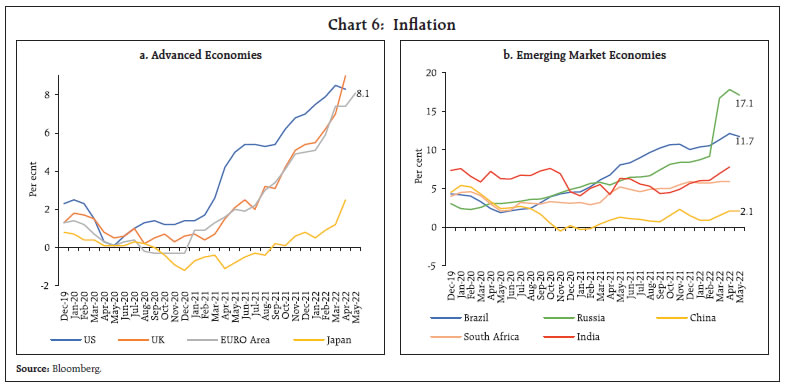 Inflation continues to soar in several economies, with price pressures hardening on escalating commodity prices while becoming increasingly broad-based (Chart 6). Inflation in the US measured by the y-o-y change in the personal consumption expenditure (PCE) price index decelerated to 6.3 per cent in April 2022 from 6.6 per cent in March with a monthly momentum of 0.2 per cent – the lowest since November 2020. Core PCE inflation also moderated to 4.9 per cent in April 2022 from 5.2 per cent a month ago as the monthly momentum of 0.3 per cent was cloaked by a favourable base effect. US CPI inflation, however, accelerated to 8.6 per cent in May 2022 from 8.3 per cent a month ago with a high monthly momentum of 1.0 per cent. The Euro area annual inflation also soared to a new record of 8.1 per cent in May, primarily driven by energy and followed by food, alcohol and tobacco. Among BRICS economies, inflation in Brazil at 11.7 per cent in May remained in double digits for the ninth consecutive month while in China, it remained constant at 2.1 per cent in May as in the previous month (Chart 6b). In Russia, following sanctions and a sharp depreciation in the rouble, inflation remained high at 17.1 per cent in May, albeit a moderation from 17.8 per cent in April. Global financial markets, though volatile, have recovered some lost ground, stabilising during the second half of May and finishing the month with modest gains, mostly driven by EMEs. As a result, the MSCI World Equity Index shed 0.1 per cent in May as the AE equity index declined by 0.2 per cent while the EME equity index increased by 0.2 per cent (Chart 7a). In the bond markets, the US Treasury yields broadly softened, averaging 2.80 per cent in the second half of May for the 10-year benchmark as markets priced in less aggressive Fed tightening than previously anticipated. Furthermore, short term rates have also moved in tandem so that the yield spread has stayed flat (Chart 7b). Yields registered high volatility, however, gyrating in response to incoming data. The dollar index hit a two-decade high in the second week of May before weakening in the latter half of the month on mixed economic news and shifting sentiments (Chart 7c). Most EME currencies recorded modest gains with net capital inflows supporting them (Chart 7d). 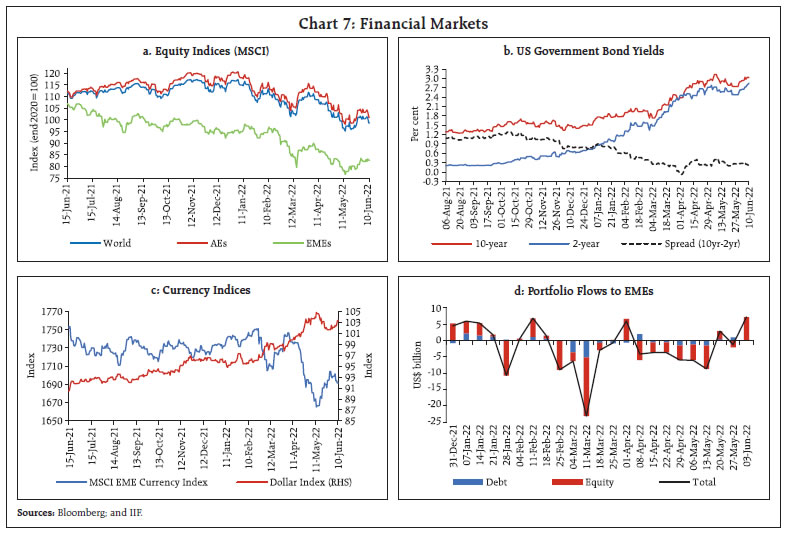 Monetary policy stances continue to tighten concurrently for most economies, both AEs and EMEs. The Federal Reserve’s balance sheet tightening commenced from June 1, as enunciated in the Federal Open Market Committee (FOMC) meeting on May 4, 2022. In view of heightened inflation risks, the European Central Bank (ECB) Governing Council met on June 9, 2022 and decided to take further steps in normalising its monetary policy which includes ending of net asset purchases under its asset purchase programme (APP) as of 1 July 2022. The Governing Council also intends to raise the key ECB interest rates by 25 basis points (bps) at its July monetary policy meeting and expects to raise rates again in September. The Reserve Bank of New Zealand and the Bank of Canada also raised their policy rates by 50 bps each in May and June, respectively. The Bank of Japan has reiterated its current monetary easing stance, given its negative output gap, and therefore remains in direct contrast to its peers. Most EME central banks have continued with policy tightening, including Hungary and South Africa hiking their benchmark rates by 350 bps and 100 bps, respectively, in 2022 so far. The central banks of Philippines and Malaysia have also commenced raising their policy rates in May by 25 bps each – the first rate hike in their current tightening cycle. On the other hand, the Bank of Russia reduced its policy rate by 300 bps in May taking the cumulative reduction to 900 bps in the last two months, almost reversing the emergency rate action post the outbreak of the war. The People’s Bank of China reduced the 5-year loan prime rate (LPR), the mortgage reference rate, by 15 bps to 4.45 per cent and retained the policy rate i.e., the 1-year LPR at 3.7 per cent (Chart 8). 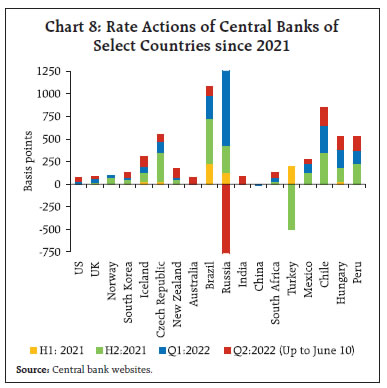 To sum up, the downside risks to global growth have accentuated as most economies are swiftly withdrawing their accommodative policy stance given the risk of commodity price driven inflation turning more generalized. In the meanwhile, continued uptrend in energy prices keeps inflation risks to the upside, especially for the net importing countries including India. III. Domestic Developments Domestic macroeconomic conditions strengthened further in May 2022 in spite of headwinds from adverse global developments. Although COVID-19 infections are rising again in some parts of the country, the proactive and aggressive vaccination drive has played a critical role in reducing hospitalisation. Total vaccination doses crossed 194 crore as on June 9, 2022 (Chart 9a). Over 87 per cent of the adult population (83 crore) and more than 4.6 crore children in the 15-18 year age group are fully vaccinated, while 3.4 crore children in the 12-14-year age group have been inoculated with the first dose and 1.8 crore children have taken the second dose. The pace of inoculation in India is comparable with the rest of the world, with the total per cent of the population that is vaccinated being above global average (Chart 9b). Daily infections increased to 7,584 as on June 9, 2022 from 1,829 as on May 17, 2022 while the daily positivity rate edged up to 2.26 per cent from 0.42 per cent during the same period (Chart 9c). The overall pick-up in economic activity is also evident from the trends in mobility, with the google mobility index normalising above baseline pre-pandemic levels for most activities in June (till June 9). While mobility around grocery, pharmacy and parks were 50 per cent above the baseline, mobility around residential units remained higher than the baseline metric, reflecting work-from-home/ hybrid models of work. (Chart 10). With the opening of contact-intensive services sector outlets, electricity demand increased strongly in recent months. With increased cooling demand amidst early onset of summer, rising temperatures and heat wave conditions continuing to prevail in several parts of the country, power demand also recorded a further increase in May 2022. This has put pressure on electricity distribution companies (DISCOMs), leading to an increase in daily peak shortages during the first week of May (Chart 11a). Since then, however, the situation has stabilized, owing to a strong increase in generation surpassing its pre-pandemic level and the levels recorded a month ago (Chart 11b). 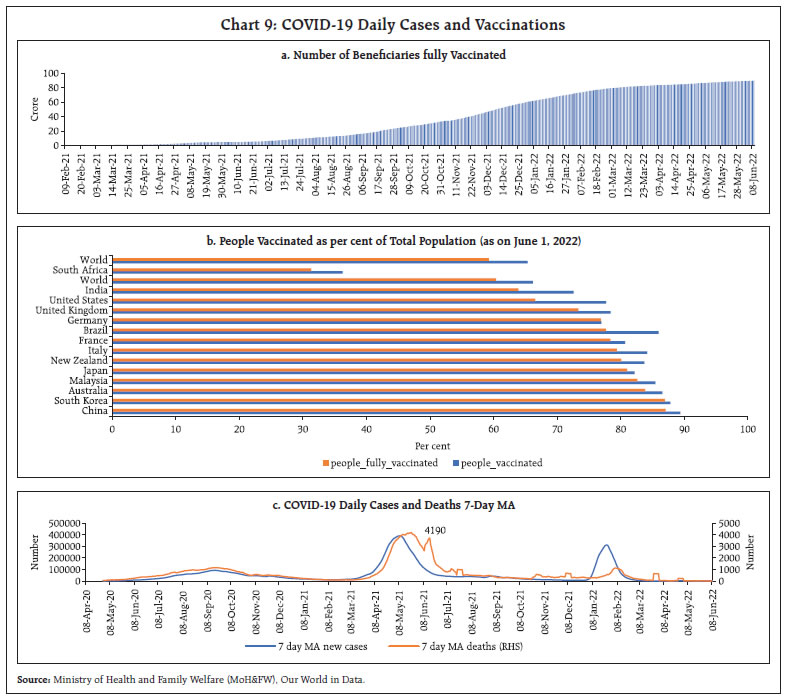 The level of coal stocks at power plants remains low for 96 thermal power plants (as of June 8, 2022). The risk of coal shortages for thermal power companies, however, remains as low stocks coincide with low production due to seasonal factors (Chart 11c). To ease off the domestic supply pressure, the Government has mandated minimum blending of imported coal to the extent of 10 per cent. In terms of availability, preferential access on coal import after the recent interim agreement with Australia (a major coal exporter) is expected to help India in meeting its growing energy needs. As global coal prices are higher than the Coal India Limited notified prices, increasing imports of coal to meet the blending requirement by power generation companies may further add to the cost of energy generation. Aggregate Demand As per the provisional estimates (PE) of annual national income released by the National Statistical Office (NSO) on May 31, the Indian economy recorded a growth of 8.7 per cent in 2021-22, a downward revision of 20 basis points from the second advance estimates (SAE). A growth rate of 4.1 per cent was clocked in Q4:2021-22, weathering headwinds from the Omicron wave in January 2022 and the ongoing conflict in Europe (Chart 12). Private consumption moderated in Q4:2021-22 owing to the third wave of the pandemic restraining contact-intensive activities, coupled with higher inflationary pressures. With construction activity gaining traction, fixed investment growth surged to 5.1 per cent in Q4:2021-22. Both exports and imports maintained a steady momentum to register double-digit growth in Q4:2021-22. E-way bills generation in May 2022 was the third highest recorded since the series began in April 2018 with a y-o-y increase of 84.1 per cent. There was a marginal decline in inter-state trade even as intra-state trading improved (Chart 13a). Toll collections also increased in value and volume terms y-o-y as well as on a sequential basis, indicating a sustained momentum in trade and transport activity (Chart 13b).
Fuel consumption increased on the back of a surge in summer travel and the start of the harvesting season, aided by cut in excise duties on petrol and diesel. While petrol and diesel consumption remained above pre-pandemic levels for the third and fourth consecutive month, respectively, consumption of aviation turbine fuel (ATF) recovered to about 90 per cent of pre-pandemic levels (Chart 14a). Taking into consideration, additional aviation indicators of domestic and international passenger and cargo freight, the aviation sector is expected to have near normalised. The automobile industry also recorded recovery in May 2022, with sales increasing y-o-y on a low base of lockdown marred activity in May last year. Sales were driven by marriage season demand and a pick-up in rural demand on the back of expectations of a normal monsoon. All segments recorded positive year-on-year growth, with passenger vehicles continuing to rise over pre-pandemic levels and sales of two-wheelers near normalised at 97 per cent of pre-pandemic sales. Three wheelers, continued to lag albeit with sequential recovery in sales (Chart 14d). Recovery in sales of two-wheelers and motorcycles came on the back of easing supply disruptions and offices and educational institutions shifting back to physical presence. Retail sales of automobiles also inched up, led by increase in registration of transport vehicles. Over pre-pandemic level, however, registrations continued to record contraction (Chart 14c). 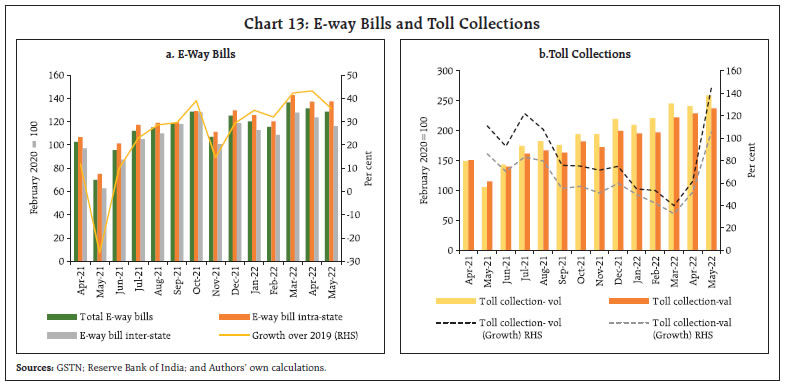 The entry level car segment (micro and mini cars in the range of under 3600 mm) underperformed other segments, with its share in total sales falling to 17 per cent in May from the long run average of 20 per cent. Price sensitive consumers delayed purchases as regulations on safety and emissions, coupled with inflationary pressures, increased prices (Chart 14b). Rural demand picked up as the forecast of a normal monsoons buoyed sentiments which was reflected in an increase in domestic sales of two wheelers, motorcycles and tractors (Chart 14d).
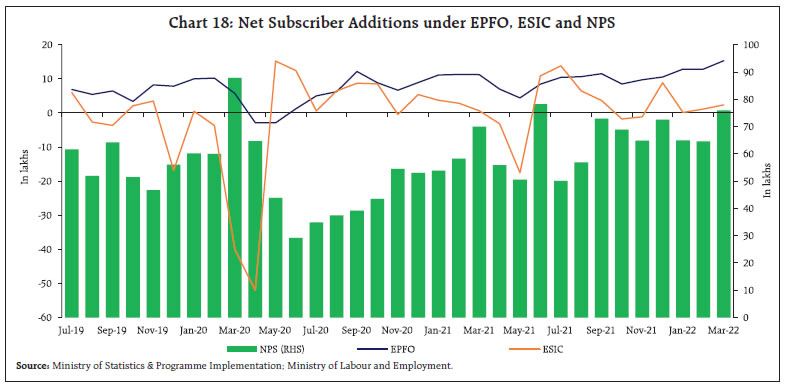
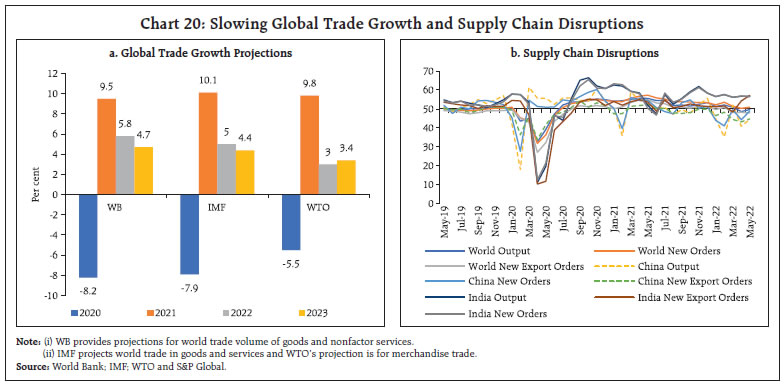
The FMCG industry registered a sequential decline in demand in May 2022 from both urban and rural pockets as consumers tempered purchases in the face of rising prices. Sales of smaller packs substituted larger packs, indicating that price hikes were having an adverse impact on consumption. As per the household survey of the Centre for Monitoring Indian Economy (CMIE), the labour participation rate fell marginally to 39.9 per cent in May 2022 from 40.2 per cent last month. The employment rate, however, maintained its level from a month ago, registering a value of 37.1 per cent in May. This led to a fall in the labour market slack, as indicated by the decrease in the unemployment rate from 7.8 per cent in April to 7.1 per cent in May (Chart 15). The CMIE’s employment statistics shows that the total number of employed workers increased over both last month and y-o-y by 1.0 million and 28.3 million respectively, in May 2022. Over its pre-pandemic level in May 2019, they increased by 0.3 million (Chart 16). This indicates continued strengthening of the labour market, despite the turbulence caused by the ongoing supply chain disruptions. The PMI, which is a survey-based indicator, shows that the employment conditions in the manufacturing and services sector diverged in May 2022. While the employment sub-index for the manufacturing sector expanded from 50.5 in April to 51.0 in May, the services sector shows a reversion to contraction, albeit marginally, at 49.8 in May from 50.8 a month ago (Chart 17). Net subscriber addition data for the Employees’ Provident Fund Organisation (EPFO), the Employees’ State Insurance Corporation (ESIC) and the National Pension System (NPS) was released for March 2022. Under the EPFO, the average monthly net subscriber additions increased from 6.5 lakh in 2019-20 to 10.2 lakh in 2021-22 while under the ESIC, it turned around from a contraction of 4.2 lakh subscribers to an addition of 2.0 lakh subscribers. Average monthly subscribers under the NPS increased from 61,095 in 2019-20 to 64,700 in 2021-22 (Chart 18). India’s merchandise exports grew by 20.6 per cent in May 2022, a moderation over the previous month (Chart 19). Exports have stayed above US$ 30 billion over the past 15 months. The moderation in trade momentum reflects rising uncertainty due to the escalation of the Russia-Ukraine war and aggravating supply chain disruptions. While global trade flows in manufacturing deteriorated, with new export orders dropping, down for the third straight month, India registered robust growth in May 2022 for new manufacturing export orders (Chart 20). 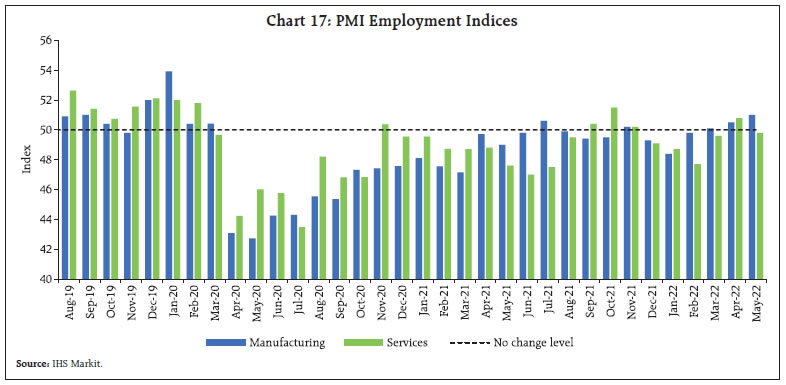
 Export growth was broad-based, as 8 out of 10 major commodity groups accounting for more than 75 per cent of exports grew on a y-o-y basis in May 2022. The improvement in export performance stemmed from the higher value of shipments of petroleum products, engineering goods and electronic goods (Chart 21a). Around half of export growth in May 2022 was on account of petroleum products (Chart 21b). Merchandise exports recorded contraction, however, on a sequential basis across all major exporting segments. Engineering goods export growth moderated to 12.7 per cent (y-o-y) in May 2022. In volume terms, wheat exports, which grew by 235.7 per cent on y-o-y basis in 2021-22, are expected to fall as the Government of India temporarily restricted wheat exports to ensure domestic food security and to control rising price pressure locally. 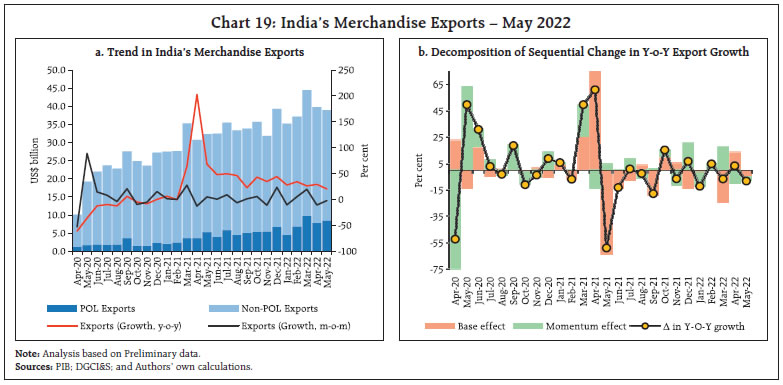
 Merchandise imports at US$ 63.2 billion remained above US$ 60 billion mark for the third consecutive month, reflecting strong domestic demand as well as the impact of higher commodity prices. Imports registered a robust growth of 62.8 per cent on y-o-y basis and witnessed sequential growth of 5.0 per cent (Chart 22). Import growth remained broad-based as all 10 major commodity groups accounting for more than 80 per cent of imports witnessed expansion on y-o-y basis in May 2022 (Chart 23a). Petroleum products remained the leading driver of import growth, followed by gold which contributed positively for the first time in 2022 (Chart 23b).
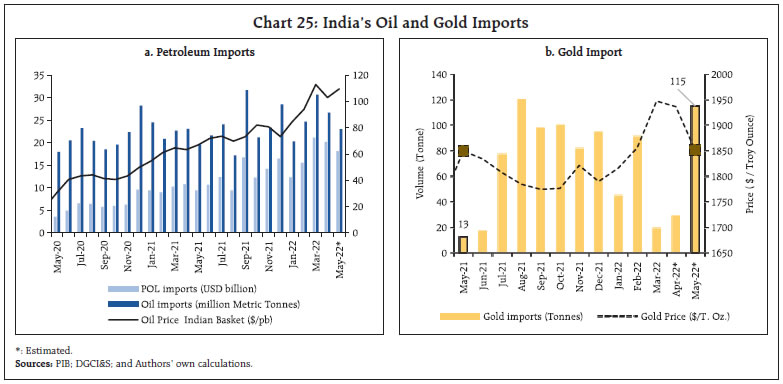
International oil prices reacted sharply to geopolitical developments and the Covid trajectory in China. Drawdowns in US fuel stockpiles and expectations of tighter sanctions on Russia pushed prices upwards. Oil prices fell by about US$ 7 per barrel after failure of the EU to announce an embargo on Russian oil in the second week of May.2 Towards the second half of May 2022, easing restrictions in China and the official EU embargo completely banning seaborne crude oil exports of Russia3 further provided momentum to the benchmark index Brent which reached US$ 125.53 on May 31, 2022 (Chart 24). 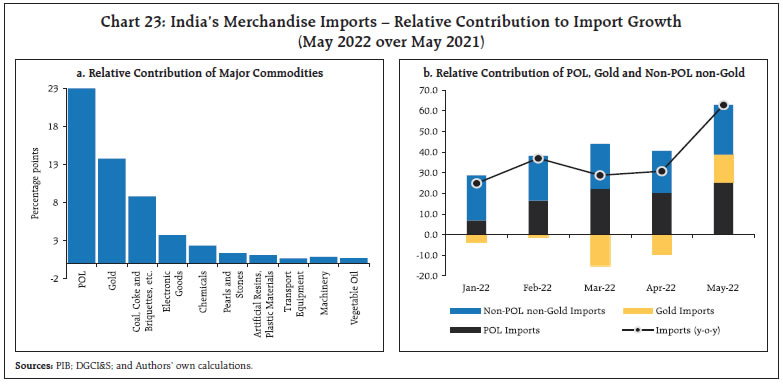 With 63.6 per cent rise in price of Indian basket of crude oil (at US$ 109.5/bbl), India’s oil imports at US$ 19.2 billion grew by 102.7 per cent in value terms and 23.9 per cent in volume terms on y-o-y basis (Chart 25a). Oil supply may improve in the coming months following the OPEC+ announcement on June 2, 2022, to raise output by 648,000 barrels per day in July and August, most of which is anticipated to be supplied by Saudi Arabia and UAE owing to capacity constraints faced by other members.4 Gold imports surged to a 9-month high at US$ 5.8 billion (Chart 25b). Sharp rise in gold imports were driven by volume as gold prices largely remained range bound.5 Rising domestic demand following easing of COVID-19 restrictions, revival of contact intensive activities as well as higher inflation were the factors driving gold imports. 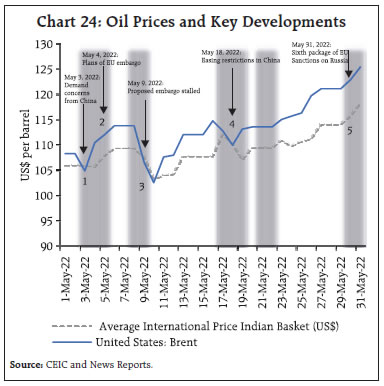
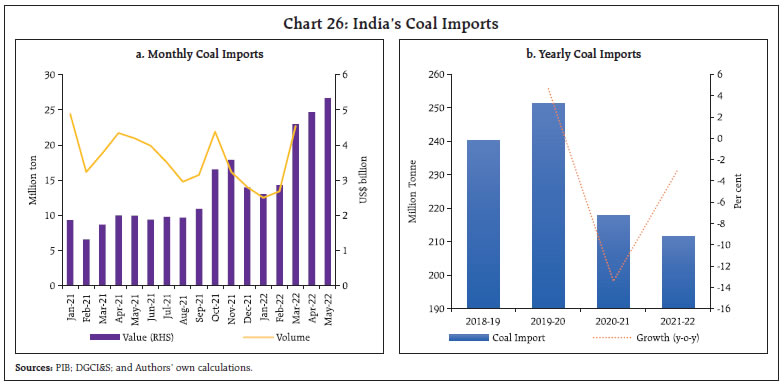 India’s coal, coke and briquettes imports at US$ 5.4 billion reached another historical high in May 2022, growing by 172.1 per cent on a y-o-y basis (Chart 26a). However, annual imports of coal have fallen for the second consecutive year and recorded contraction of 2.9 per cent on a y-o-y basis (Chart 26b). International coal prices have risen to record high levels. The Australian coal price rose to US$ 385.7/mt in May 2022, increasing by 288.6 per cent and 27.1 per cent on a y-o-y and m-o-m basis, respectively. Import of vegetable oil has decelerated in May 2022. In order to augment domestic supply to reign in price pressures, the Government has allowed 20 lakh metric tonnes (LMT) of duty and cess free import of crude soyabean/sunflower oil for 2022-23 and 2023-24. The government also revised downwards the base import prices of crude and refined palm oil. India’s trade deficit at US$ 24.3 billion increased to its highest monthly level in May 2022. Around 70 per cent of the increase in the trade deficit was on account of petroleum and its products; and gems and jewellery (Chart 27).
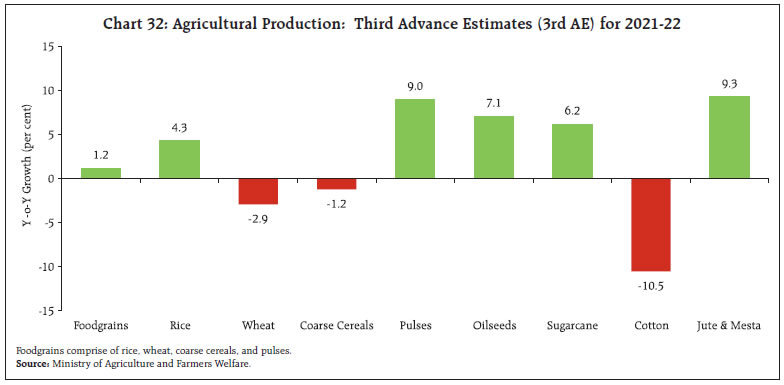
The consolidated gross fiscal deficit of states/ UTs declined sharply to around 2.9 per cent of GDP6 in 2021-22 from 4.3 per cent a year ago7 (even lower than the budgeted ratio of 3.7 per cent for 2021-22) (Chart 28). This sharp decline was driven by higher revenue receipts, led by tax and non-tax revenue, coupled with a reduction in revenue expenditure. At the same time, capital outlay has remained strong, supporting the economic recovery. Various fiscal performance indicators such as interest payment to revenue receipts, interest payment to revenue expenditure and revenue expenditure to capital outlay have improved in 2021-22 vis-à-vis 2020-21 (Chart 29). Aggregate Supply On the supply side, aggregate supply, as measured by gross value added (GVA) at basic prices, increased by 8.1 per cent in 2021-22, as against a contraction of 4.8 per cent a year ago. Apart from the agriculture sector exhibiting resilience, a sustained revival in the industry and the services sectors facilitated this acceleration. GVA of all the sectors, barring trade, hotels, transport, communication and services related to broadcasting, have surpassed their respective pre-pandemic levels in 2021-22. Real GVA growth stood at 3.9 per cent in Q4:2021-22, on the back of resilience of agriculture and recovery in the services sector, while the industrial sector exhibited moderation (Chart 30). Manufacturing registered a marginal contraction owing to pressures emanating from higher input costs and supply side disruptions. Within the services sector, there was a broad-based resurgence with the third wave receding. The early onset of Southwest Monsoon (SWM) on the Indian mainland 3 days ahead of the scheduled date and the forecast of normal monsoon rainfall by the India Meteorological Department (IMD) has raised prospects for the forthcoming Kharif season. The progress of the monsoon has however, become slow, with activity weakening over the Arabian Sea, as on June 10, 2022, although it has covered most of Karnataka and Tamil Nadu. Summer or Zaid crops sown between March and May have covered an area of 76.4 lakh hectares as on May 27, 2022. It is 5.1 per cent higher than a year ago attributable to substantial increase over the normal acreage under pulses (78.0 per cent higher than normal) (Chart 31a). The total live storage in 140 major reservoirs as on May 26, 2022, was higher at 32 per cent of the full reservoir level (FRL) as compared to 30 per cent of FRL during the previous year and the decadal average of 23 per cent of FRL (Chart 31b). The third advance estimates (3rd AE) of agricultural production (released on May 20, 2022) placed the foodgrains production in 2021-22 at 314.5 million tonnes, touching a record level for the sixth consecutive year (higher by 1.2 per cent over the final estimates of 2020-21) [Chart 32]. Rice achieved record production for the sixth consecutive year. The estimate for wheat production has been revised downwards by 2.9 per cent to 106.4 million tonnes, mainly on account of yield loss due to persistent heat waves since March 2022. Maize marked a record production of 33.2 million tonnes with y-o-y growth of 4.8 per cent over the previous year. With record production, total pulses are estimated 9.0 per cent higher than a year ago. Except production of moong which is lower by 7.8 per cent y-o-y, other major pulses remained higher than in the previous year, including a record production of gram (17.4 per cent over the previous year). Among the commercial crops, oilseeds (including rapeseed and mustard) and sugarcane recorded highest ever production, showing y-o-y growth of 7.1 per cent and 6.2 per cent, respectively. Cotton production was lower by 10.5 per cent than in the previous year. 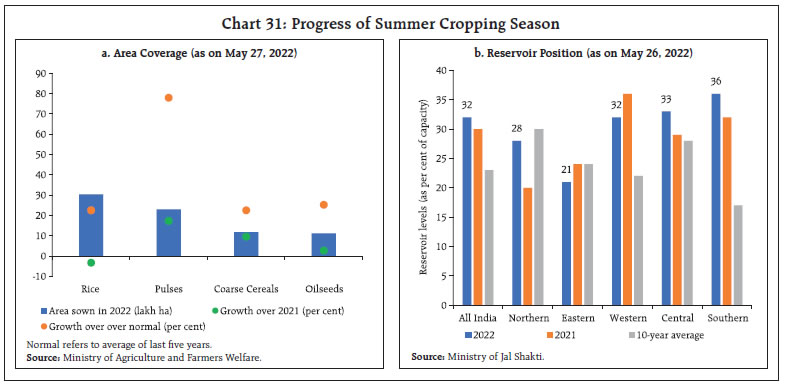
 The Government of India announced the Minimum Support Price (MSP) for 14 major kharif crops for the marketing season of 2022-23 on June 8, 2022. MSPs have been revised upwards in the range of 4.4 – 8.9 per cent with an average of 6.1 per cent (Chart 33). The highest y-o-y growth of MSPs is seen in the case of soyabean (8.9 per cent), followed by jowar (8.5 per cent) and sesamum (7.2 per cent). On the other hand, the lowest growth is recorded in the case of bajra (4.4 per cent), followed by urad and maize. Except for Urad, Tur and Bajra, the magnitude of increase has been higher than in the previous year. 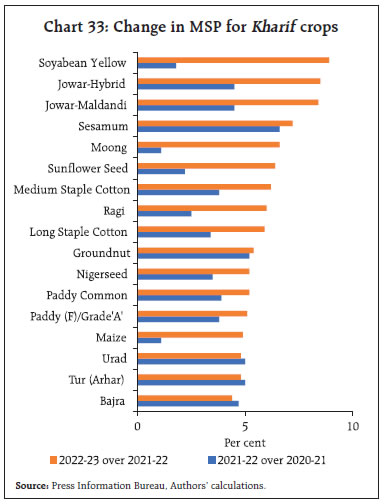
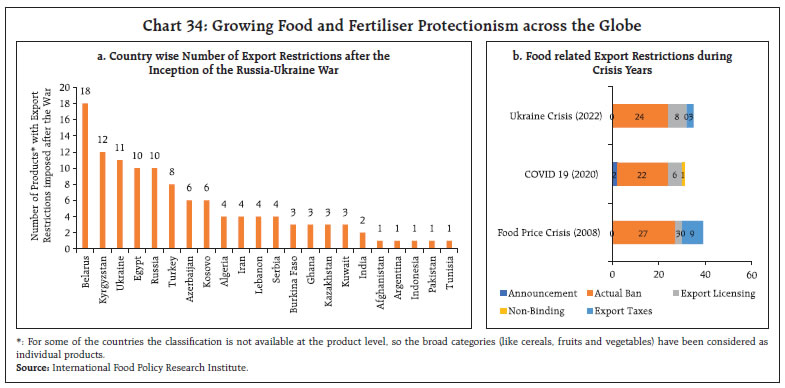 Recent developments in global agricultural markets have also raised fresh concerns over food security across the globe. Many countries have been using trade measures (including both export restrictions and licensing) to overcome shortages and curb price spikes (Chart 34a). The total number of restrictions imposed currently is almost at par with those during the outbreak of COVID-19 (2020) and the global food crisis (2008) [Chart 34b]. India imposed restrictions on the export of two commodities viz., wheat and sugar. Following the imposition of these restrictions on May 13, 2022 global wheat prices firmed up temporarily but reverted to the pre-restriction level within a week. Domestic prices, however, continued to moderate post export restrictions (Chart 35). On the import front, the Government has allowed duty free import of 20 lakh tonnes each of crude soybean oil and crude sunflower oil annually for the current year as well as the next year (2023-24). Apart from downward revision in wheat output, the supply of other crops (mainly mangoes and tomatoes) has also been significantly affected in terms of both quantity and quality. Procurement of rice was 2.7 per cent higher, whereas that of wheat was 55.3 per cent lower on a y-o-y basis (as on June 11, 2022). As of May 31, 2022 the stock of rice and wheat stood at 3.7 and 4.2 times the quarterly buffer norms. Therefore, recent policy measures, along with adequate buffer stocks, allay any food security concerns in India at the current juncture. 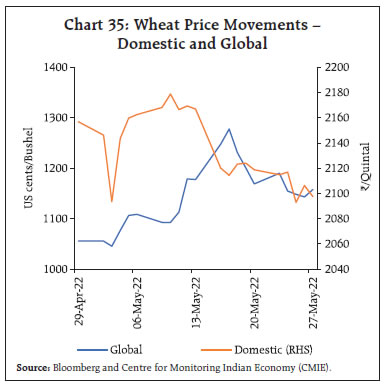
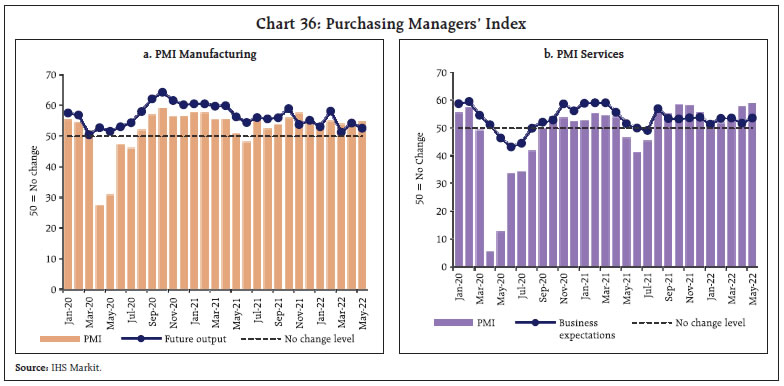 In the industrial sector, the headline manufacturing PMI index maintained its improvement at 54.6 in May 2022 from 54.7 last month. While the expansion is led by an increase in factory orders and sales, increase in input cost pressures remains a point of concern, leading to a decline in business expectations from 53.4 in April to 52.6 in May. PMI services, on the other hand, further accelerated to 58.9 in May 2022 from 57.9 last month, marking a solid recovery in the services sector. With further strengthening in economic recovery amidst opening up of services sector outlets, the index was driven by fast increases in new business and output. The business expectations index (BEI) for services expanded for the tenth successive month in May 2022, but it remains below the long-run average due to large increases in input prices (Chart 36). In the services sector, transport indicators recorded growth, with railways freight traffic increasing by 14.6 per cent (y-o-y) in May 2022 despite a high base last year (Chart 37a). An increase in freight was recorded in coal, cement, food grains, fertilisers and POL (Petroleum, oil and lubricants). Cargo at major ports recorded marginal improvement in May 2022 as compared to April 2022. On y-o-y basis, it showed a growth of 8.9 per cent in May 2022. The improvement was on account of increase in commodities of non-containerised cargo, POL, fertiliser and raw materials which together account for 46 per cent of total cargo (Chart 37b). The contact intensive services sector remained on a sustained recovery path. Hotel occupancy rates in April 2022 increased beyond pre-pandemic levels in April 2019, and at 65.9 per cent, it was the highest recorded since the outbreak of the pandemic. The average room rate and revenue per available room inched up, surpassing pre-pandemic average rates in 2019 (Chart 38 a and b). As per Ormax Media and GroupM reports, audience footfall has increased in cinemas, and revenues from ticket sales in January- April 2022 surpassed corresponding pre-pandemic period levels. The total box office collections in 2022 are also projected to cross collections in 2019 as people throng to cinemas in revenge consumption. 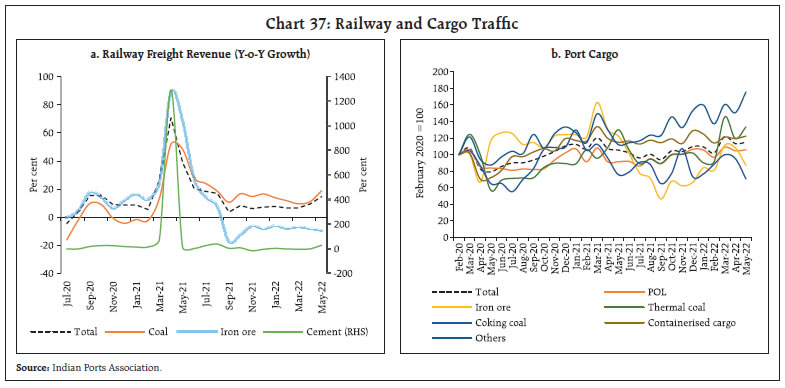 Activity in the construction sector picked up during April-May 2022, with cement production and steel consumption recording expansion over the pre-pandemic month. While cement production declined sequentially in April due to year-end effects, growth in steel consumption moderated in May on account of an adverse base effect (Chart 39). The sustained pick-up comes despite increasing prices, as demand picks up on the back of robust infrastructure activity in the economy. The aviation sector picked up in May 2022, with both passenger and cargo segments recording growth on a y-o-y basis and sequentially. Daily domestic airport footfalls averaged 7.3 lakh per day – an expansion by 5.4 per cent over the preceding month. International airport footfalls increased by 10.9 per cent sequentially, while the cargo segment increased by 4.0 per cent for domestic cargo and contracted by 0.8 per cent for international cargo. In the first eight days of June, domestic airport footfalls increased by 1.3 per cent over the corresponding period in May, while international airport footfalls increased by 14.4 per cent.
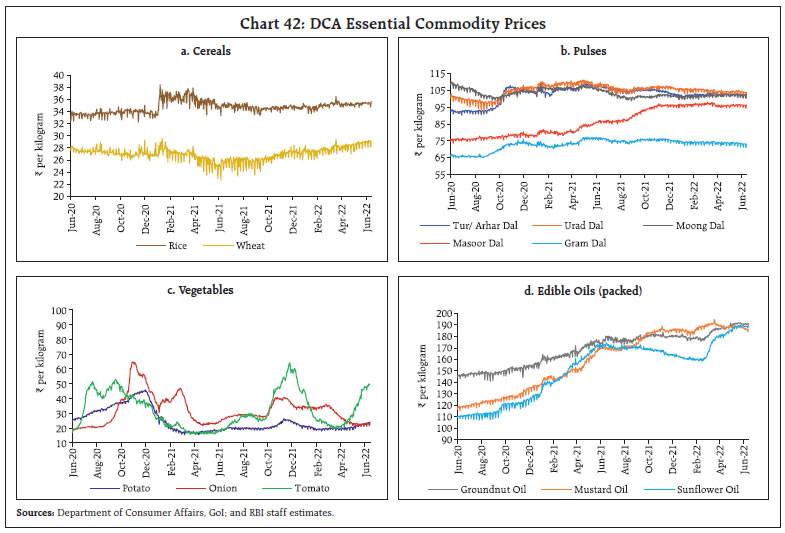
In the services sector, activity gained momentum, echoed in high frequency economic indicators of trade and transport sectors. Contact intensive aviation and tourism sectors also recorded sequential improvement, but recovery remains lagged. Decline in rural demand was reflected in the two wheelers and tractors segments (Table 2). Inflation Inflation as measured by year on year (y-o-y) changes in the all India consumer price index (CPI), moderated to 7.0 per cent in May 2022 from 7.8 per cent in April as per the provisional data released by the NSO [Chart 40a]. Over the previous month, the index increased by 94 bps which was more than offset by strong favourable base effects (month-on-month change in prices a year ago) of 165 bps, leading to a decline in headline inflation by 75 bps between April and May. The increase in prices in May was largely driven by the food and beverages and fuel and light groups which increased by 1.5 per cent and 1.4 per cent, respectively, over their levels a month ago while core CPI had a much lower momentum of 0.4 per cent. Significant price pressures were witnessed in respect of vegetables, meat and fish, and spices within the food group and liquified petroleum gas (LPG) in the fuel group, whereas the cut in petrol and diesel excise duties led to a decline in prices of those items. In terms of annual inflation, all the three major components of CPI exhibited a moderation in inflation in May (Chart 40b). Food and beverages group exhibited a moderation to 7.8 per cent in May from 8.1 per cent in April. Within this category, inflation softened in case of cereals, eggs, edible oils, fruits, pulses, sugar, spices and non-alcoholic beverages, while it edged up for meat and fish, vegetables and milk. The fuel group (weight of 6.84 per cent in the CPI basket) contributed to around 9.2 per cent of headline inflation in May. Over the previous month, fuel inflation moderated sharply from 10.7 to 9.5 per cent in May, primarily on account of a deepening of deflation in electricity prices to an all-time low of (-) 2.2 per cent, which was driven by the base effect. Inflation in LPG and kerosene, however, accelerated. Inflation excluding food and fuel fell sharply to 5.9 per cent in May from 7.1 per cent in April. The decline in inflation within this group was also broad based as sub-groups like pan, tobacco and intoxicants, clothing and footwear, transport and communication (reflecting the partial impact of the cut in excise duties in May), recreation and amusement, household goods and services, health and personal care and effects (due to decline in gold/silver prices) registered moderation. Inflation in the housing group, however, edged up marginally even though it remained low at 3.7 per cent. 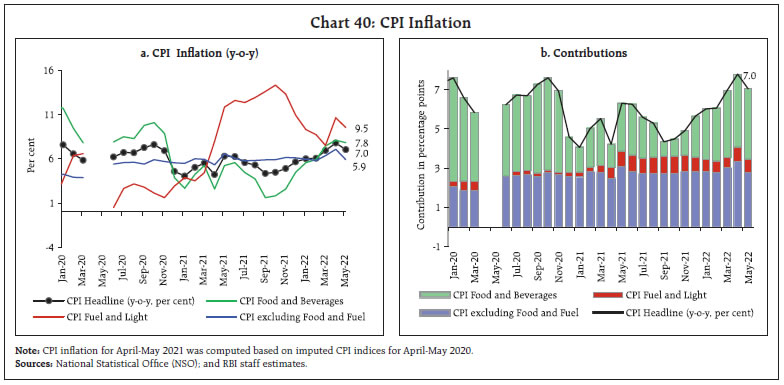 In terms of the regional composition of inflation, almost all of the decline in inflation in May has come from rural inflation which declined from 8.4 per cent in April to 7.0 per cent in May. Urban inflation, however, remained steady at 7.1 per cent. There has also been a wide variation of inflation across different states in India (Chart 41). Andhra Pradesh, Maharashtra, Telangana and West Bengal witnessed CPI inflation in excess of 8 per cent while Kerala recorded inflation of below 5 per cent. High frequency food price data from the Ministry of Consumer Affairs, Food and Public Distribution (Department of Consumer Affairs) for June so far (June 1-13, 2022) indicate an increase in cereals prices, primarily on account of a surge in retail prices of wheat. Pulses and edible oil prices, however, registered a decline, with the fall in mustard oil prices being the major contributor for the latter. Among key vegetables, tomato and potato prices rose sharply, while onion prices have remained steady in June so far (Chart 42). Retail selling prices of petrol and diesel in the four major metros remained steady in June so far (until 13th) though lower vis-à-vis last month’s levels, reflecting the impact of the cut in excise duties on petrol and diesel by ₹8 per litre and ₹6 per litre, respectively, on May 22, 2022. The decision of Government to provide a subsidy of Rs 200 per 14.2-kg LPG cylinder (upto 12 cylinders) to over 9 crore beneficiaries of Pradhan Mantri Ujjwala Yojana, which will be given through direct benefit transfer, would alleviate pressures on those households budgets though not explicitly reflecting in market prices. Kerosene prices have increased sharply in June so far (Table 3). 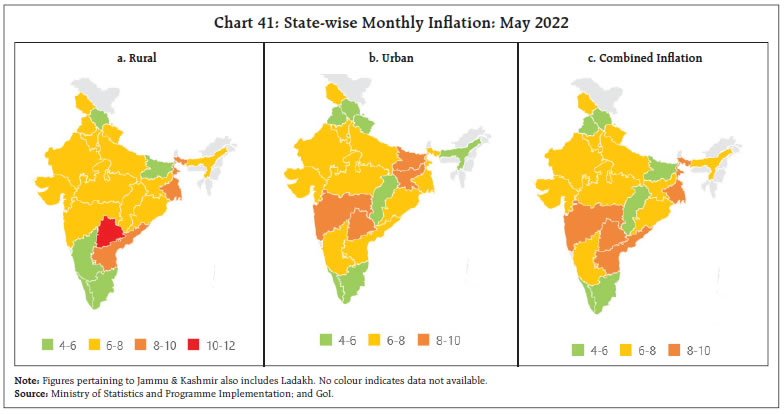
| Table 3: Petroleum Products Prices | | Item | Unit | Domestic Prices | Month-over- month (per cent) | | June-21 | May-22 | June-22^ | May-22 | June-22 | | Petrol | ₹/litre | 98.35 | 110.14 | 104.18 | -2.2 | -5.4 | | Diesel | ₹/litre | 91.00 | 98.27 | 93.48 | -1.9 | -4.9 | | Kerosene (subsidised) | ₹/litre | 32.13 | 58.81 | 61.99 | 3.2 | 5.4 | | LPG (non-subsidised) | ₹/cylinder | 819.63 | 1001.76 | 1013.25 | 4.3 | 1.1 | ^: For the period June 1-13, 2022.
Note: Other than kerosene, prices represent the average Indian Oil Corporation Limited (IOCL) prices in four major metros (Delhi, Kolkata, Mumbai and Chennai). For kerosene, prices denote the average of the subsidised prices in Kolkata, Mumbai and Chennai.
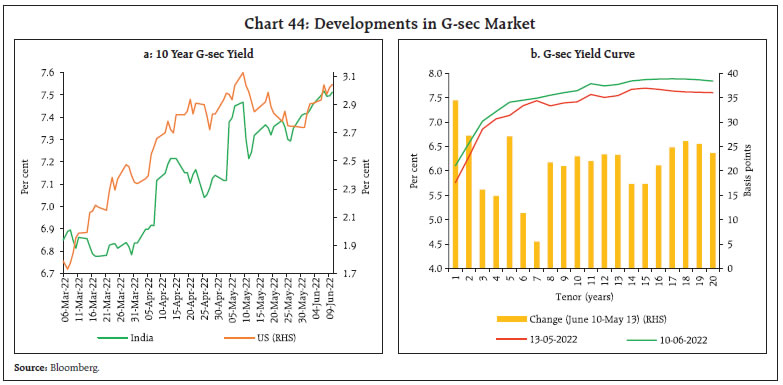
Sources: IOCL; Petroleum Planning and Analysis Cell (PPAC); and RBI staff estimates. | Input cost pressures increased in May 2022 across manufacturing and services as reflected in the PMIs. The input cost component in the PMI for services rose at a record high rate. Selling prices also edged up across manufacturing and services with manufacturing products reaching their highest level in the last nine years. IV. Financial Conditions Following the increase in the policy repo rate by 50 bps in the June 2022 meeting of the monetary policy committee (MPC) and its earlier hike of 40 bps in an off-cycle meeting, liquidity conditions have evolved in line with the stated stance, focussing on withdrawal of accommodation. Accordingly, daily liquidity absorption under the liquidity adjustment facility (LAF) averaged ₹4.9 lakh crore in the second half of May to June 8, moderating from ₹6.7 lakh crore during the second fortnight of April through mid-May 2022. The increase in cash reserve ratio (CRR) requirements effective from the beginning of the reserve maintenance cycle of May 21, coupled with moderation in government spending, drained liquidity from the banking system in the second half of May through June 8, 2022. Of the total absorption, average daily absorption under the standing deposit facility (SDF) was ₹2.2 lakh crore while the bulk of surplus liquidity was mopped up through variable rate reverse repo (VRRR) auctions (both main and fine-tuning) of various tenors. Overnight money market rates firmed up, with their spreads from the SDF rate narrowing considerably (Chart 43). On an average, the weighted average call rate (WACR), tri-party repo rate and market repo rate traded 7 bps, 5 bps and 6 bps, respectively, below the SDF rate during the second half of May 2022 to June 8 as compared with 15 bps, 7 bps and 22 bps lower, respectively, during mid-April to the first fortnight of May. In the outer term money market segment, yields on 3-month certificates of deposit (CDs) and 3-month commercial paper (CP) stayed elevated, trading above the ceiling of the LAF corridor in the second half of May 2022 through June 8, 2022. In the fixed income market, bond yields hardened further during the second half of May 2022 to June 8. The rise in crude oil prices, policy rate tightening by systemically important central banks and a pledged ban on Russian energy imports by the European Union (EU) unnerved market sentiment. Domestic inflation pressures, concerns over additional market borrowing following the government’s announcement of a reduction in excise duty on petrol and diesel kept bond markets on edge. The rise in the US treasury yields during June also imparted upward pressure domestically. The Reserve Bank’s policy action of June 2022 was largely anticipated by the market; consequently, the reaction of the bond market was muted, with the yield on 10 year security easing by 3 bps to close at 7.49 per cent on June 8 (Chart 44a). The yield curve flattened as the short end of the curve increased further in response to moderation in surplus liquidity (Chart 44b). Pressure on the short end was also discernible in the primary market, with 55 per cent of the notified amount (₹4,000 crore) for 4.56 per cent GS 2023 devolving on primary dealers in the auction conducted on May 27, 2022. The subsequent auction conducted on June 3 sailed through, with the government completing 36 per cent of the scheduled borrowing for H1:2022-23. 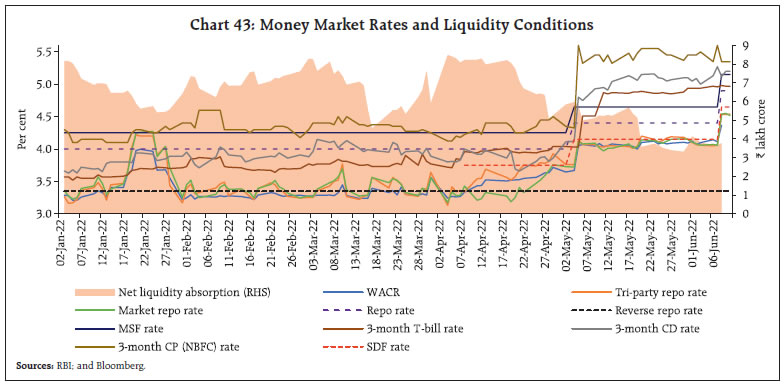
 Corporate bond yields reflected a hardening bias in June 2022 (up to June 8) – across tenors and rating spectrum – in tandem with the rise in G-sec yields (Table 4). The credit risk premium as reflected in spread of corporate bond yields over risk-free G-sec yields of equivalent maturities also rose during the same period. | Table 4: Financial Markets - Rates and Spread | | Instrument | Interest Rates
(per cent) | Spread (bps)
(over corresponding risk-free rate) | | May-22 | June 2022 (Up to June 8) | Variation (in bps) | May-22 | June 2022 (Up to June 8) | Variation (in bps) | | 1 | 2 | 3 | (4 = 3-2) | 5 | 6 | (7 = 6-5) | | Corporate Bonds | | | | | | | | (i) AAA (1-yr) | 6.20 | 6.84 | 64 | 42 | 51 | 9 | | (ii) AAA (3-yr) | 7.17 | 7.67 | 50 | 30 | 57 | 27 | | (iii) AAA (5-yr) | 7.35 | 7.59 | 24 | 11 | 18 | 7 | | (iv) AA (3-yr) | 7.86 | 8.37 | 51 | 99 | 127 | 28 | | (v) BBB-minus (3-yr) | 11.57 | 12.06 | 53 | 470 | 496 | 26 | | 10-yr G-sec | 7.34 | 7.47 | 13 | | | | Note: Yields and spreads are computed as monthly averages
Source: FIMMDA and Bloomberg. | Monetary and credit aggregates moved in tandem with the ongoing recovery in economic activity in May. Reserve money (RM), excluding the first-round impact of the CRR increase by 50 bps to 4.5 per cent effective May 21, 2022, grew by 8.0 per cent on a y-o-y basis as on June 3, 2022 (12.2 per cent a year ago) with currency in circulation (CiC), the largest component of RM, growing at 8.3 per cent (12.8 per cent a year ago). Money supply (M3) grew at 8.8 per cent as on May 20, 2022 (10.3 per cent a year ago), primarily driven by the growth in aggregate deposits with banks on the components side (having a share of around 85 per cent) at 8.7 per cent (9.7 per cent a year ago). On the sources side, bank credit to the commercial sector – the major constituent – led the expansion in M3. Scheduled commercial banks’ (SCBs’) credit growth accelerated to 12.1 per cent y-o-y as on May 20, 2022, more than double that of 6.0 per cent recorded a year ago (Chart 45). 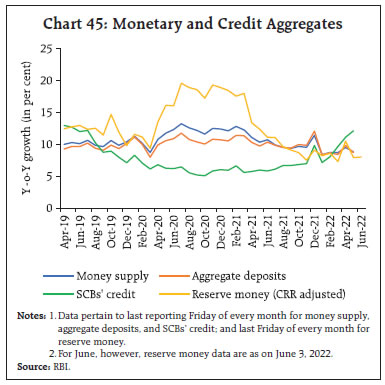 Most banks increased their external benchmark lending rates by 40 bps in May 2022. Amongst domestic banks, seven public sector banks and 12 private banks also increased their 1-year MCLR in a range of 2 to 31 bps (Chart 46). Banks have also started raising their interest rates on term deposits. Domestic banks have increased term deposit rates (average card rates across all tenors of retail deposits) in the range of 1 to 60 bps during the month of May (Table 5).
| Table 5: Transmission from the Repo Rate to Banks’ Deposit and Lending Rates | | (Variation in basis points) | | Period | Repo Rate | Term Deposit Rates | Lending Rates | | Median TDR (Fresh Deposits) | WADTDR (Out-standing Deposits) | 1 - Year median MCLR | WALR (Out-standing Rupee Loans) | WALR (Fresh Rupee Loans) | | October 2019- March 2022 | -140 | -180 | -180 | -128 | -150 | -189 | | Apr-22 | 0 | 0 | 0 | 0 | -2 | -11 | | | (-23 to 18) | | (-40 to 13) | | | | May-22 | +40 | 0 | - | 0 | - | - | | | (0 to 60) | | (0 to 31) | | | Note: Figures in parentheses indicate range of bank-wise variation for domestic banks.
WALR: Weighted average lending rate; WADTDR: Weighted average domestic term deposit rate; MCLR: Marginal cost of funds-based lending rate; TDR: Term deposit rate.
Source: RBI. | The weighted average lending rates (WALRs) on outstanding and fresh rupee loans declined by 2 bps and 11 bps, respectively, in April 2022. Considering the decline of 150 bps and 189 bps in WALRs on outstanding and fresh rupee loans during October 2019 to March 2022, the total decline in WALRs amounts to 152 bps and 200 bps, respectively, during the external benchmark period up to April 2022. Indian equity markets edged down in the first half of May 2022 reflecting concerns over the tightening of monetary policy by global central banks and risks of an ensuing global economic slowdown. In the second half of May 2022 and early June 2022, markets exhibited an uneven recovery; however, the benchmark Sensex still lost 4.8 per cent since the start of May (till June 10, 2022) to close at 54,303. Inflation, the size and pace of monetary policy tightening in the US and supply chain issues emanating from lagged effects of stringent pandemic-induced lockdowns remain headwinds to equity markets globally. In alignment with global markets’ correction since the beginning of the calendar year 2022, the Sensex has lost 6.8 per cent. The movement of equity markets has been highly volatile during this period with sudden declines and short rallies. The downswing in the BSE midcap and the smallcap indices has been much more pronounced than the BSE Sensex as they lost 9.9 per cent and 12.2 per cent, respectively (Chart 47). 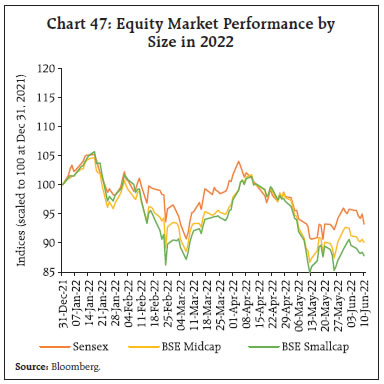 An analysis of data since January 2011 shows that the Sensex provided an average year-on-year nominal return of 13.1 per cent as against an average CPI inflation rate of 5.9 per cent. Significant variation, however, was found across inflation thresholds with low inflation periods on an average being associated with higher real returns for equities (Chart 48). In recent times, passive strategies, viz., index funds and exchange traded funds (ETFs) have emerged as low-cost alternatives to their active counterparts for investment. Since April 2019, combined assets under management (AUM) of index mutual funds and ETFs (excluding gold ETFs) have more than tripled from ₹1.36 lakh crore (5.5 per cent of total AUM of mutual funds) to ₹4.86 lakh crore (12.80 per cent of total AUM) at end-April 2022 (Chart 49). Considering the growth of passive investing in India and its advantages like transparency, cost-effectiveness and diversification, the Securities and Exchange Board of India (SEBI) recently undertook several measures to aid development of passive investment vehicles in India, such as the introduction of passive equity linked saving schemes (ELSS) funds, strengthening of disclosure norms and stipulating threshold tracking error for passive funds among others.8 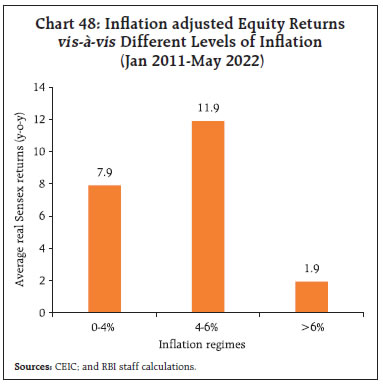 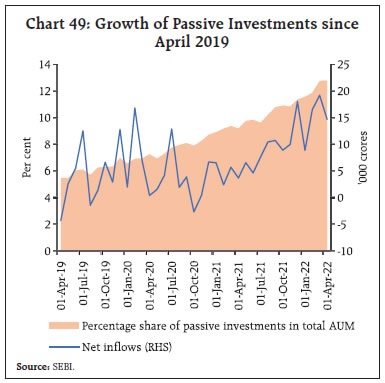 India’s largest ever initial public offering (IPO) of the Life Insurance Corporation (LIC) listed in May with an issue size of ₹20,557 crore. It received an active response from retail investors and policyholders, with an overall subscription rate of 2.95 times the issue size. In terms of number of applications received from retail investors, the LIC IPO ranked the first in all mainboard IPOs listed since April 2021 (Chart 50). Gross foreign direct investment (FDI) inflows at US$ 8.4 billion in April 2022 were higher than their level of US$ 6.3 billion recorded a year ago (Chart 51). Similarly, net FDI increased to US$ 5.0 billion in April 2022 from US$ 2.5 billion a year ago. Services and manufacturing sectors accounted for a major share in FDI equity inflows in April 2022. According to the UNCTAD’s9 World Investment Report (June 2022), India was the 7th largest recipient of FDI in 2021. 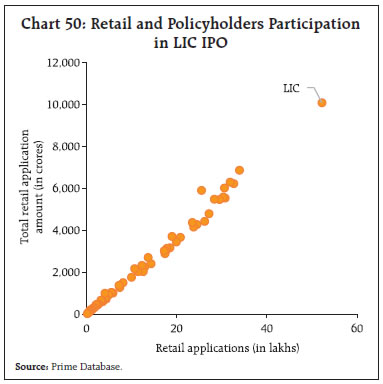 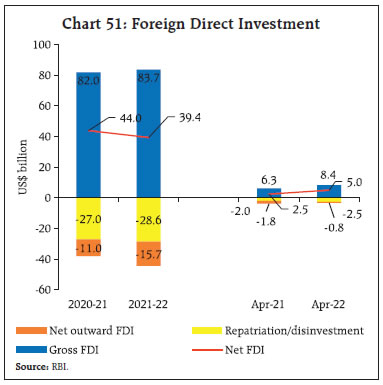 In May 2022, foreign portfolio investors (FPIs) remained net sellers in the Indian equity market amidst inflationary pressures, rising global interest rates, firming US dollar and crude price surges. Equity markets in major emerging market economies (EMEs) such as Brazil, Indonesia, Philippines, South Africa, and Turkey exhibited net outflows as well. FPIs, however, turned net purchasers in the domestic debt market, after being net sellers in the preceding three months. Net equity sell-off led to a total outflow of US$ 4.5 billion from the Indian capital market in the month of May (Chart 52). The information technology sector recorded the highest sell-offs by FPIs, followed by financial services, oil, gas and consumable fuels, and power sectors. Gross disbursements of external commercial borrowings (ECBs) to India were marginally lower at US$ 1.4 billion in April 2022 from their level of US$ 1.7 billion a year ago. ECBs, excluding inter-company borrowings, recorded net repayments of US$ 0.5 billion in April 2022 as against net disbursements of US$ 0.1 billion a year ago. A considerable part of ECBs has been raised for the purpose of working capital, import of capital goods and overseas investment in wholly owned subsidiaries. The foreign exchange reserves at US$ 601.1 billion as on June 3, 2022 were equivalent to about 10 months of imports projected for 2022-23 (Chart 53). In the foreign exchange market, the Indian rupee (INR) depreciated by 1.5 per cent vis-à-vis the US dollar (m-o-m) in May 2022 on the back of FPI equity outflows and strong US dollar (Chart 54a). Nevertheless, the depreciation of the INR was modest relative to major EME currencies (Chart 54b).
The INR, despite depreciating against the US dollar, appreciated in terms of the 40-currency real effective exchange rate (REER) in the month of May due to higher depreciation of currencies of India’s major trading partners against the US dollar and relative price effect (Chart 55). Payment Systems Digital payments continued their upward trajectory, with wholesale and retail segments exhibiting strong growth (y-o-y) in May and June 2022 (upto June 10). Large-value credit transfers through Real Time Gross Settlement (RTGS) gained further traction in tandem with economic activity. Retail digital payments exhibited a rise, primarily on the back of Unified Payments Interface (UPI), which hit a new high of 595 crore transactions while breaching the ₹10 lakh crore mark in value. Payment channels like the National Electronic Funds Transfer (NEFT) and Immediate Payment Service (IMPS) posted acceleration in both volume and value terms (Table 6). The turnover in National Automated Clearing House (NACH) also rose owing to the latest disbursal of the Pradhan Mantri Kisan Samman Nidhi (PM-KISAN) instalment. Transactions through the National Electronic Toll Collection (NETC) mode revealed a sharp uptick, given the ongoing normalisation in mobility, the rise in the number of tags issued,10 and the upward revision in toll rates (with effect from April 1, 2022).11 Buoyed by the measures aimed at streamlining biller onboarding and a wide range of biller categories, the Bharat Bill Payment System (BBPS) sustained its triple-digit growth run in May. Card transactions displayed resilience in April 2022, with average credit card spending at e-commerce platforms surpassing the value of average debit card payments by three times. Despite the overall low penetration of credit cards relative to debit cards, this points towards the proliferation of deferred payment services in the online space, which assumes significance in view of the growing popularity of the buy-now-pay-later (BNPL) segment.12 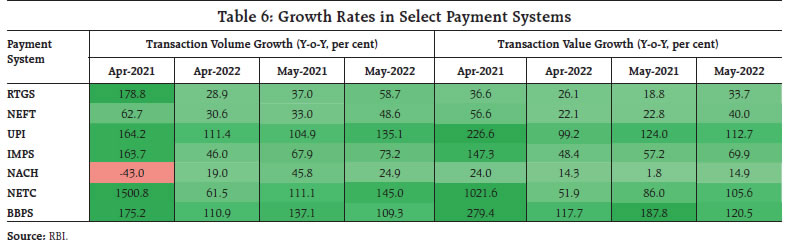 On the policy front, the Reserve Bank has allowed the provision of interoperable card-less cash withdrawal facility across all banks and ATM networks. Under this, customer authorisation and transaction settlement would be done through the UPI and the National Financial Switch/ATM networks, respectively.13 Since this will eliminate the need to carry cards, it will enhance customer convenience and help curb card-related fraudulent activities. To align the eligibility criteria for system participants in the BBPS framework, the Reserve Bank has reduced the minimum net worth criterion for non-bank entities seeking to operate as Bharat Bill Payment Operating Units (BBPOUs) from ₹100 crore to ₹25 crore.14 This is likely to deepen bill payments through the mode, promote competition and widen the BBPS network. Furthermore, the test phase will commence in June for the eight entities selected under the third cohort of the Regulatory Sandbox Scheme on ‘MSME Lending’. The Bank has also announced opening of the fourth cohort with ‘Prevention and Mitigation of Financial Frauds’ as the theme. Recognising that the awareness of digital payment products matters for acceptance, the National Payments Corporation of India (NPCI) took the initiative of making DigiSaathi available on social media platforms like WhatsApp.15 This will help plug information gaps and bolster trust in the adoption of digital payment services.16 In the latest Statement on Developmental and Regulatory Policies17, it has been decided that the Bank will enhance the limit for e-mandate based recurring payments from ₹5,000 to ₹15,000 per transaction to facilitate larger-value payments. To further deepen the reach and usage of UPI, it has also been decided to allow linking of Rupay credit cards to UPI. On the digital financial inclusion front, the Bank has proposed to modify the Payments Infrastructure Development Fund (PIDF)18 Scheme by inter-alia enhancing the subsidy amount and simplifying the subsidy claim process. This is expected to further augment the deployment of payment acceptance infrastructure in the targeted geographies. Giving credence to the digital revolution underway, it was recently reported that India recorded the highest number of real-time transactions19 in 2021, comprising 40 per cent of global transactions (48.6 billion), which is nearly three times that of China (18.5 billion). This is resulting in efficiency gains and release of additional economic output. Going ahead, digital payments are expected to contribute 1.12 per cent of the country’s GDP by 2026.20 V. Conclusion Global economic conditions continued to deteriorate as ratcheting up of commodity prices and financial market volatility have led to heightened uncertainty. Forecasts of global growth and inflation by various agencies paint a grim picture and it is increasingly becoming clear that in advanced economies, the war against inflation would entail significant monetary tightening, complicating the growth-inflation outlook. Emerging market economies grapple with the global trade slowdown, capital outflows and imported inflation. Some abatement of supply chain pressures and relaxation in lockdown measures by key industrial hubs have emerged as silver linings amidst the dark clouds looming over the global economy. In the midst of this increasingly hostile external environment, India is better placed than many other countries in terms of avoiding the risks of a potential stagflation. With most constituents of GDP surpassing pre-pandemic levels, domestic economic activity is gaining strength. The inflation print for May has brought some relief as it recorded a decline after seven months of continuous rise. The recovery remained broadly on track. This demonstrates the resilience of the economy in the face of multiple shocks and the innate strength of macro fundamentals as India strives to regain a sustainable high growth trajectory. The recent actions by the Reserve Bank which demonstrated its commitment to price stability while supporting growth augurs well in this milieu.
|