Efficient customer services and financial inclusion have been the key motives behind digitisation in urban cooperative banks (UCBs). Using survey-based data, this article brings out the consistent progress made by UCBs in digitisation in recent years. The progress evinced by UCBs has been most significant in the adoption of retail payment channels followed by application-based channels, such as mobile banking. However, even in 2021, the digital index score of UCBs stood at only 41 against a maximum of 100, indicating the distance still to be travelled by these banks. Moreover, UCBs exhibit stark differentiation in digitisation by (a) type (scheduled versus non-scheduled), (b) deposit base and (c) region. Introduction Urban Cooperative Banks (UCBs) are a critical part of the banking ecosystem in India. As on March 31, 2021, there were 1,534 UCBs (53 scheduled and 1,481 non-scheduled) with an aggregate asset size of ₹6,57,851 crore. UCBs constituted 3.4 per cent of the asset size of scheduled commercial banks. Even though they may be small in terms of asset size, given their local feel and familiarity coupled with last-mile credit delivery focused on relatively small-sized borrowers, UCBs have emerged as a key stakeholder in the process of financial inclusion. In the last three decades, technological and digital advances have redefined banking in India. Digitally aware customers, notably millennials, are seeking greater convenience and better customer services through digital modes. The COVID-19 pandemic has only accelerated the pace of digitisation given what scientists have called as “anthropause”, a major pause in modern human mobility (Rutz et al., 2020). Importantly, technological and digital platforms have also become a critical component of financial inclusion to ensure last-mile, quick and cost-effective delivery of financial services to the under-served sections. Even though digitisation has touched every segment of the banking system, including commercial and cooperative banks, there are certain qualitative differences in the way each of these segments have adopted technological changes. Unlike commercial banks, digitisation in UCBs has been largely spearheaded by the regulator i.e., the Reserve Bank of India (RBI). Ensuring efficient customer services and furthering financial inclusion have been the key motives behind the regulatory nudge to UCBs to adopt digital banking. In light of the various recent initiatives towards digitisation, it may be useful to assess the overall progress in digitisation among UCBs, as attempted in this article. The article addresses the following research questions: (a) What is the present extent of digital footprint of the UCB sector, and how differentiated is the sector with regard to digitisation? (b) What is the nature of digitisation in UCBs? What kind of digital banking channels are included in their operations? (c) Is there any association between digitisation and customer behaviour, which may manifest itself in the retention, or alternatively, attrition of UCB customers? This article delves into these questions using data collected directly from UCBs through a customised questionnaire. The article is divided into five sections. Section 2 discusses RBI’s steps towards digitisation in UCBs. Section 3 discusses the data sources used for the article. Section 4 discusses the empirical methodology used for the article along with its major findings. Section 5 provides the concluding observations. 2. RBI’s Approach to Digital Transformation in UCBs IT support has been an integral feature of the regulatory and supervisory reforms introduced by the RBI for the UCB sector. Following the Vision document in 2005, the RBI entered into a Memorandum of Understanding (MoU) with the Central and the respective State governments for establishing a consultative approach to supervision and regulation of UCBs. As part of the MoU, the RBI agreed to provide IT support to UCBs. In the later years, a number of working groups/committees set up by the RBI deliberated upon various regulatory, supervisory and operational aspects relating to UCBs and the matter of IT support was a key point for many of these working groups/committees. To illustrate, in 2007, a working group (Chair: R. Gandhi) examined various areas where IT support could be provided by the RBI. In 2016, the RBI prescribed standards and benchmarks for Core Banking Solutions (CBS) in UCBs and introduced a scheme to provide financial assistance to UCBs for implementation of CBS. While the RBI extended IT support to UCBs, it also endeavoured to protect the UCBs and their customers against cyber threats. In 2018, it prescribed a set of baseline cyber security controls for UCBs. In 2019, it introduced a comprehensive cyber security framework for UCBs. Baseline cyber security controls and resilience requirements were prescribed in a graded manner based on the digital depth of UCBs. Furthermore, in 2020, the RBI released the “Technology Vision for Cyber Security for Urban Co-operative Banks – 2020-2023” aimed at enhancing the cyber security posture of UCBs. 3. Data Sources Data for this article were collected through a survey of UCBs using a customised questionnaire.1 A total of 188 UCBs were selected for the survey including 23 scheduled and 165 non-scheduled UCBs.2 In terms of asset size, the selected UCBs covered about 32 per cent of total assets of the UCB sector. In choosing the sample, a conscious attempt was made to have a representative sample from all asset size categories instead of just focusing on the large-sized systemically important UCBs (Table 1). | Table 1: Asset-wise Distribution of Sampled UCBs | | No. | Asset category (₹ crore) | Number of UCBs | | 1 | Asset < 50 | 29 | | 2 | 50 < Asset <100 | 32 | | 3 | 100 < Asset < 250 | 46 | | 4 | 250 < Asset < 500 | 33 | | 5 | 500 < Asset < 1000 | 19 | | 6 | 1000 < Asset < 3000 | 16 | | 7 | Asset > 3000 | 13 | | | Total | 188 | | Source: Survey data and DBIE database. | While an attempt was also made to select UCBs from all geographical zones, UCBs from the western zone, being home to most UCBs, dominated in number. In all, 84 UCBs were from the western zone, 40 were from the northern zone, 56 from the southern and eight were from the eastern zone.3 The information sought included details on CBS, Internet banking, mobile banking, debit cards, credit cards, ATM switch, SWIFT, payment gateways, etc. Zone-wise information was collected from banks from 2016 to 2021. The year 2016 was purposively selected as the base year for the survey, keeping in view the demonetisation exercise that was expected to provide a fillip to digital payments.4 The survey-based data were supplemented by data on balance sheet and other financial parameters from the RBI supervisory returns. 4. Research Questions and Findings 4.1 What is the overall progress on digitisation and the present digital footprint of UCBs? To address this question, a Digital Index (DI) has been constructed using the survey data. The DI is designed to display a continuous score ranging from 0 to 100. The score represents the digital landscape of the given bank. It includes the digital banking channels used by the bank in its operations, digital products and services offered to its customers, and sophistication of the digital infrastructure. A score of 100 represents the extent of digital development possible through all basic modes of digital banking available to UCBs and canvassed in the survey. A score of 0 represents no digital footprint of the bank. 4.1.1 Constituent parameters of DI The DI uses 12 parameters, including features of CBS, Internet banking, mobile banking, centralised payment system, cheque truncation system, different retail payment channels, debit cards and ATMs. The list of parameters used for constructing DI is given in Annexure 1. The parameters have been chosen keeping in mind the basic mandate of financial inclusion for UCBs. Apart from this, customer’s expectations of convenience and ease of access to digital banking channels from these banks have also been considered. Each parameter contains several sub-parameters which represent the depth or sophistication under that parameter. To illustrate, the parameter of Internet banking has two sub-parameters: (i) “view only” type Internet banking services (ii) “transactions facility” type Internet banking services. 4.1.2 Construction of DI To construct the DI, each parameter has been assigned a maximum “parameter score”. These maximum scores are externally assigned based on supervisory judgement about the relative importance attached to a given parameter in strengthening the basic IT infrastructure of a bank, which can be leveraged to provide better quality and more advanced digital services to its customers. The clientele base of UCBs generally comprises small-sized, relatively underserved, and technologically less-savvy customers. Not surprisingly, features of CBS, the most fundamental aspect of the IT infrastructure in a bank, have been assigned the maximum score of 20. ATMs being the second-most important part of the IT infrastructure carry the maximum score of 10 along with retail payment channels, which also carry the maximum score of 10. Internet banking is regarded next in line and has been assigned a score of eight. The sub-parameters within each parameter too are assigned a score. These sub-parameter scores are designed such that they increase with the increasing depth of a given digital service. For example, the two sub-parameters of Internet banking are scored in the following manner: the “view only” Internet banking is given a basic score of five, while Internet banking with “transaction facility” is assigned the score of eight, which is the maximum score under the Internet banking parameter. The DI score for a bank ‘l’ in the sample is calculated as under: Pkl represents the score for kth parameter for lth bank with ‘k’ taking values from 1 to 12, representing the total number of parameters. Pkl is calculated as: Where, SPkjl represents the score for jth sub-parameter under parameter Pk, and m are the total number of sub-parameters within the parameter Pk. 4.1.3 Results The yearly DI score using the methodology as explained above is calculated from 2016 to 2021 for each bank. The increase in the DI score is expected to reflect the progress achieved in IT and digital infrastructure by a given bank. The following are the major findings from this exercise: A steady progress but current scores remain low The trends in the DI score indicated consistent progress by UCBs on the digitisation front from the base year 2016. However, in 2021, the average DI score for all UCBs was only about 41 as against a maximum score of 100, indicating a considerable distance still to be covered by these banks (Chart 1). A wide differential between scheduled and non-scheduled UCBs The overall DI score was pulled down by non-scheduled UCBs; there remained a stark difference between the progress achieved by scheduled and non-scheduled UCBs with regard to digitisation. A comparison of the basic descriptive statistics relating to DI scores for 2016 for scheduled and non-scheduled UCBs indicated that digitisation in non-scheduled banks was at a much weaker footing than scheduled banks to begin with (Table 2). Furthermore, the gains for the non-scheduled banks were tardy during the survey period as compared to scheduled banks. The first quartile score for non-scheduled banks even in 2021 was only 27 indicating that the current state of digitisation for these banks continued to be quite poor, and that these banks possibly suffered from inertia. 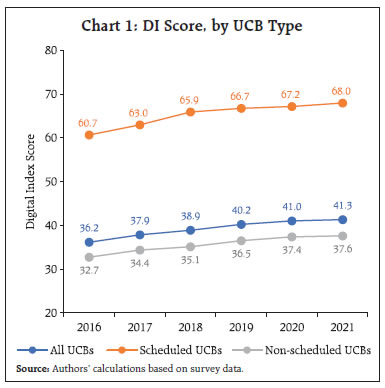
| Table 2: Basic Descriptive Statistics relating to DI Scores, by UCB Type | | Statistical parameter | Scheduled UCBs | Non-scheduled UCBs | | 2016 | 2021 | 2016 | 2021 | | Mean | 60.7 | 68.0 | 32.7 | 37.6 | | Median | 59.0 | 68.0 | 31.0 | 37.0 | | First quartile | 48.0 | 59.0 | 25.0 | 27.0 | | Third quartile | 75.0 | 78.0 | 40.0 | 47.0 | | Source: Authors’ calculations based on survey data. | Tier II UCBs faring better than Tier I UCBs Tier II UCBs (large UCBs having wider geographic presence and with deposits of ₹100 crore and above) fared better than Tier I UCBs (having deposits of less than ₹100 crore). Incidentally, all scheduled banks covered in the sample were Tier II banks. The tier-wise box-plot of the digital scores for the scheduled and non-scheduled UCBs indicated (a) a distinct shift in the DI scores for scheduled/Tier II banks in the upward direction, suggesting that most banks in this category made significant progress in digitisation during the study period; (b) an increase also for non-scheduled Tier II banks in the DI scores; and (c) a limited progress for non-scheduled Tier I UCBs with the DI scores of some banks from this category being stuck at low levels (Chart 2). In fact, the non-scheduled Tier I UCBs in the first quartile showed an extremely tardy change from 23 to 25 between 2016 and 2021 in their DI scores (Table 3). UCBs from western zone leading in digitisation UCBs from the western zone have been leading in terms of DI scores. Incidentally, all scheduled UCBs in the sample were from the western zone. This can hardly be deemed as a selection bias, as scheduled UCBs from the western zone account for about 98 per cent of the total assets of all scheduled UCBs in India. Clearly, the overall digital progress of scheduled UCBs is responsible for the western zone scoring above other zones. | Table 3: Basic Descriptive Statistics of DI Scores of Non-scheduled UCBs, by Tiers | | Statistical parameter | 2016 | 2021 | | Tier I | Tier II | Tier I | Tier II | | Mean | 29.4 | 34.9 | 31.1 | 41.9 | | Median | 28.0 | 34.5 | 29.0 | 43.0 | | First quartile | 23.0 | 27.0 | 25.0 | 33.0 | | Third quartile | 33.0 | 41.0 | 37.0 | 51.0 | | Source: Authors’ calculations based on survey data. | The non-scheduled UCBs are spread across all four zones viz., north, south, east and west. Notably, even the non-scheduled UCBs from the western zone have posted considerable progress in digitisation between 2016 and 2021 over non-scheduled UCBs from the other three zones (Chart 3). While there were clear signs of improvement in the DI score in the other three zones as well, there were differentials in the extent of improvement. To illustrate, the DI score of the UCBs from the eastern zone belonging to the first quartile showed a scant increase from 21.3 in 2016 to 22.8 in 2021 (Table 4). 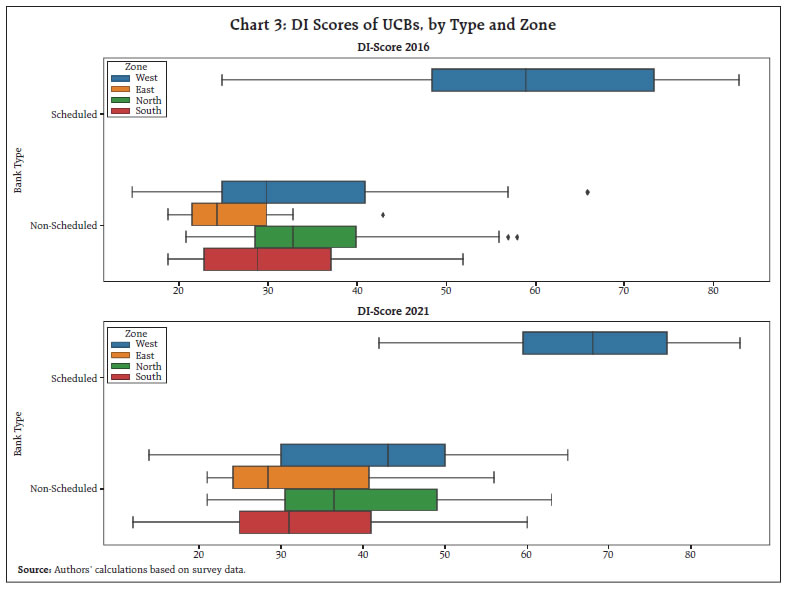
| Table 4: Descriptive Statistics of DI Scores of Non-scheduled UCBs, by Zone | | Parameters | 2016 | | East | West | North | South | | Mean | 27.0 | 33.7 | 35.4 | 30.7 | | Median | 24.5 | 30.0 | 33.0 | 29.0 | | First quartile | 21.3 | 25.0 | 28.3 | 23.0 | | Third quartile | 32.0 | 41.5 | 40.0 | 37.8 | | Parameters | 2021 | | East | West | North | South | | Mean | 33.0 | 41.2 | 39.1 | 33.3 | | Median | 28.5 | 43.0 | 36.5 | 31.0 | | First quartile | 22.8 | 29.5 | 29.5 | 25.0 | | Third quartile | 42.3 | 51.0 | 49.0 | 41.0 | | Source: Authors’ calculations based on survey data. | 4.2 What is the nature of digitisation in UCBs? What kind of digital banking channels are included in their operations? During the survey period, UCBs showed maximum progress in three channels of digital banking viz., IMPS as a retail payment channel (18 per cent of the surveyed UCBs had adopted this channel in 2016, which increased to 38 per cent in 2021), mobile banking (17 per cent of the banks to 36 per cent), and debit cards (38 per cent to 52 per cent) (Chart 4). There was a positive change in each of the digital channels between 2016 and 2021 except ATM switch and SWIFT. The trends for UCBs broadly support the recent trends in digital transformation in the banking sector. The digital transformation in the banking sector is indeed spearheaded by retail payments channels and application-based channels, such as mobile banking, owing to the growing popularity of smart phones and easy availability of mobile data. 4.3 Is there any association between digitisation and customer behaviour, which may manifest itself in the retention, or alternatively, attrition of UCB customers? As the existing customers of UCBs become more technologically aware, they are expected to demand better digital services from their banks. Digital banking can also lead to an intense competition within UCBs, and between UCBs and commercial banks, leading to a movement of customers across banks. To address this research question, the relationship between deposit behaviour of UCB customers and the digital depth of these banks is modelled using the fixed effects panel regression comprising the surveyed UCBs. From the supervisory experience, it has been observed that customers may not generally close their accounts with a bank but may reduce their usage or draw down the balance in these accounts. However, there is also a possibility that customers may indeed choose to close these accounts. Hence, to model the association between digital depth and customer behaviour, we use both the amount and number of deposit accounts. The regression equation can be specified as follows:
Where, “Deposit variable” refers to a. total amount of current and savings deposits, and b. total number of current and savings deposit accounts. The main variable of interest is the DI score. To control for the overall systemic dominance of a bank and its operating efficiency, we introduce log of asset size, and the ratio of operating expenses to operating income, respectively. This is because typically banks with larger market shares and stronger brand name, and better operating efficiency may draw in more deposits/depositors. We also include the bank type fixed effects to account for the differences in scheduled and non-scheduled UCBs, and time fixed effects to account for time-varying factors that may influence all UCBs uniformly. | Table 5: Relationship between Depositor Behaviour and Digitisation in UCBs | | Independent variable | Model 1: Using amount in CASA as the dependent variable | Model 2: Using number of CASA as the dependent variable | | DI score | 0.0095*** | 0.0105*** | | | (0.001) | (0.002) | | Size | 0.9076*** | 0.6213*** | | | (0.015) | (0.020) | | Operating Efficiency | 0.0365 | 0.1103** | | | (0.031) | (0.044) | | Bank type FE | Y | Y | | Year FE | Y | Y | | R2 | 0.92 | 0.77 | | Number of observations | 1008 | 1008 | Note: Sample period is from 2016 to 2021. Standard errors clustered around bank are reported in brackets. **p<0.05, *p<0.10, ***p<0.01.
Size is represented by log (total assets) and Operating efficiency refers to Total operating expenses/Total operating income
Source: Authors’ calculations based on survey data and Supervisory returns. | The results from the regression indicate a statistically significant and positive association of DI score with customer deposit behaviour (Table 5). Although the sign and significance of the coefficient are satisfactory, its strength is weak suggesting that digital depth in UCBs affects depositor behaviour moderately. 5. Conclusion Using survey-based data on scheduled and non-scheduled UCBs covering a period from 2016 to 2021, this article attempted to analyse (a) the overall digital development in the UCB sector, and differentiation in digital depth within the sector; (b) the various channels of digital banking rolled out by UCBs for their customers; and (c) the association between digitisation and depositor behaviour. The major findings suggest that despite the scale limitation, the UCBs have made considerable progress on the digitisation front from 2016 onwards. However, the present score of digital development (DI score) still remains at a low of 41, when marked on a scale of 0 to 100. Moreover, the digital development is marked by a stark differentiation across UCBs with the non-scheduled banks lagging significantly behind the scheduled banks. The relatively large-sized UCBs evince greater digital depth possibly owing to a larger customer base and associated economies of scale. Among the various digital channels, UCBs have shown maximum progress in the retail payment channels, such as IMPS. Furthermore, the adoption of application-based digital channels, such as mobile banking also show a striking increase during the study period. Digitisation shares a positive, albeit weak, correlation with the amount and number of current and savings deposits of UCBs. Simply put, digitisation may be a necessary but not a sufficient condition in influencing deposit retention among UCBs. During the survey, an attempt was also made to understand the reasons for the low levels of digitisation in UCBs. Cost involved in developing the IT infrastructure was cited as the major reason by most UCBs for low levels of digitisation. The lack of skilled technical workforce required for the operationalisation and maintenance of digital channels too came out as another reason. It was also noted that banks were often constrained in recouping the costs incurred on digital infrastructure development due to minimal/ no service charge. Furthermore, the relatively small customer base prevented banks from reaping the economies of scale from digital infrastructure development. Notwithstanding these constraints, UCBs were optimistic about the digital infrastructure development in their banks, and were, in fact, in the process of rolling out more digital channels for their customers at the time of the survey. References: Rutz, C., M.C. Loretto and A. E. Bates and others (2020), “COVID-19 lockdown allows researchers to quantify the effects of human activity on wildlife”, Nature, June 22.
| Annexure 1: Parameters used for Constructing the Digital Index Score | | S. No. | Parameters | Maximum parameter scores | Sub-parameter scores | | 1 | Features of CBS | 20 | | | If the bank has CBS | 10 | Additional features:
1) Bank has in-house CBS from bank’s data centre
2) Bank uses CBS of community cloud
3) Maker checker arrangement for CBS
4) DR Site for the CBS application
5) CBS meets all the requirements of the bank | | No. of additional features | Scores | | 1 | 12 | | 2 | 14 | | 3 | 16 | | 4 | 18 | | 5 | 20 | | | 2 | Number of ATMs | 10 | | No. of ATMs (X) | Scores | | X < 5 | 2 | | 5 < X < 10 | 4 | | 10 < X < 20 | 5 | | 20 < X < 30 | 6 | | 30 < X < 50 | 8 | | X > 50 | 10 | | | 3 | Retail Payment Channels (RPCs) – IMPS, UPI, Bharat bill pay, Bharat QR, AEPS, NACH | 10 | | No. of RPC | Scores | | 1 | 4 | | 2 | 6 | | 3 | 7 | | 4 | 8 | | 5 | 9 | | 6 | 10 | | | 4 | Internet Banking
a) View only
b) Transaction facility | 8 |
5
8 | | 5 | Mobile Banking
a) Through SMS
b) Through application | 8 |
5
8 | | 6 | Centralised Payment System (CPS)
a) Bank is only a sub-member
b) Bank is Direct member of CPS
c) Bank provides sub-membership to other banks for CPS | 8 |
4
6
8 | | 7 | Cheque Truncation System
a) Bank is a sub-member of CTS
b) Bank is a direct member of CTS | 8 |
5
8 | | 8 | Debit Cards | 8 | – | | 9 | Clearing Corporation of India Ltd.
a) Bank is a direct member of CCIL
b) Bank provides sub-membership to other banks for CCIL | 5 |
3
5 | | 10 | Payment Gateway
a) Bank is using a third-party payment gateway
b) Bank has its own payment gateway | 5 |
3
5 | | 11 | SWIFT | 5 | – | | 12 | ATM Switch | 5 | – | | Total | 100 | – |
|